


Features
- 6 Unique slides
- Fully editable and easy to edit in Microsoft Powerpoint, Keynote and Google Slides
- 16:9 widescreen layout
- Clean and professional designs
- Export to JPG, PDF or send by email


Do you have any questions?
Recommend


4 slides
Human Anatomy Visual Guide Presentation
Visualize body systems with clarity using the Human Anatomy Visual Guide Presentation. Featuring a simplified female silhouette with highlighted organs, this slide layout is perfect for medical education, wellness topics, or anatomy-focused data. Each labeled section (A–D) includes space for concise insights. Fully editable in Canva, PowerPoint, Keynote, and Google Slides.


6 slides
Environmental Protection and Ecology Plan Presentation
Highlight your green initiatives with the Environmental Protection and Ecology Plan Presentation. Featuring a lightbulb-leaf graphic, this template helps you present sustainability goals, eco strategies, and key action steps clearly. Ideal for environmental reports, proposals, or educational content. Fully customizable in Canva, PowerPoint, or Google Slides.


4 slides
Home Design and Architecture Presentation
Showcase Home Design and Architecture with this layered house-themed presentation template. This stacked structure layout effectively illustrates key concepts such as floor planning, architectural elements, space optimization, and construction insights. Ideal for architects, interior designers, and real estate developers, this template helps communicate design strategies and structural layouts with clarity. Fully customizable and compatible with PowerPoint, Keynote, and Google Slides.


22 slides
Jade Graphic Design Project Plan Presentation
Unleash creativity with this vibrant Graphic Design Project template! Perfect for showcasing your design process, prototypes, and assets, it keeps the audience captivated with clean visuals and a fresh, modern look. Whether you're outlining color palettes or final designs, every slide exudes style. Ideal for PowerPoint, Keynote, and Google Slides!


10 slides
Strategic Business Action Plan Presentation
Create a roadmap for success with the Strategic Business Action Plan presentation. This well-structured template provides a clear, step-by-step framework for executing business strategies, making it ideal for corporate teams, entrepreneurs, and business consultants. Its modern design ensures effective communication of key goals and objectives. Fully customizable and compatible with PowerPoint, Keynote, and Google Slides.


4 slides
Risk Assessments Matrix Presentation
Bring clarity to complex decisions with this bold, color-coded layout designed to pinpoint threats, compare impact levels, and communicate risks with confidence. This presentation makes evaluation simple, structured, and visually clear for any audience. Fully editable and ready for professional use. Compatible with PowerPoint, Keynote, and Google Slides.


26 slides
Nahla Presentation Template
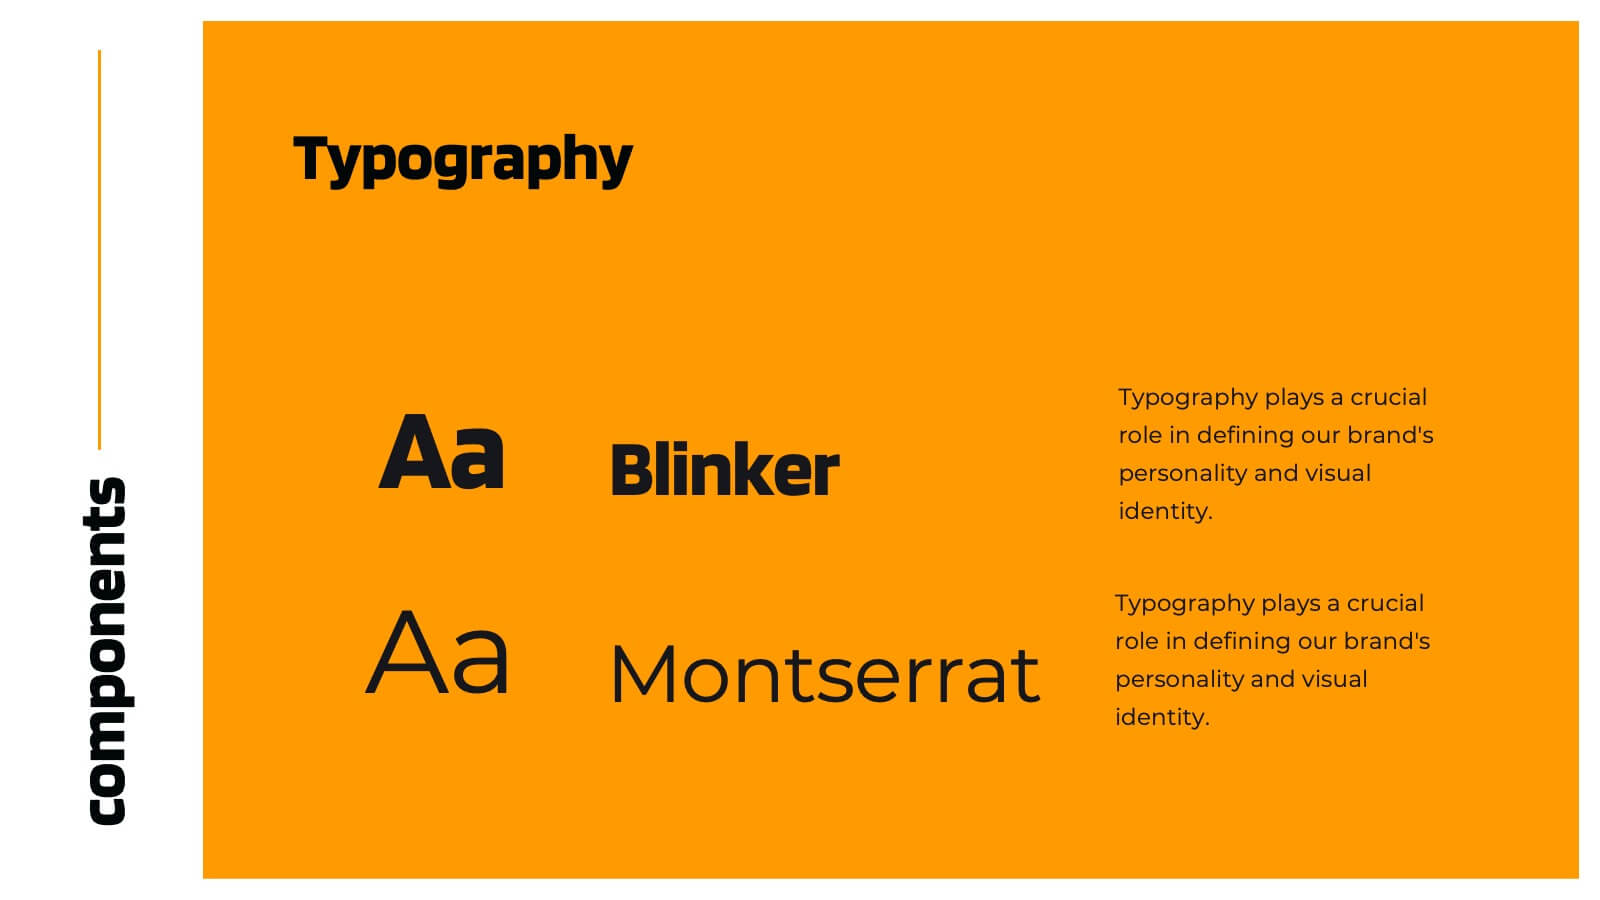
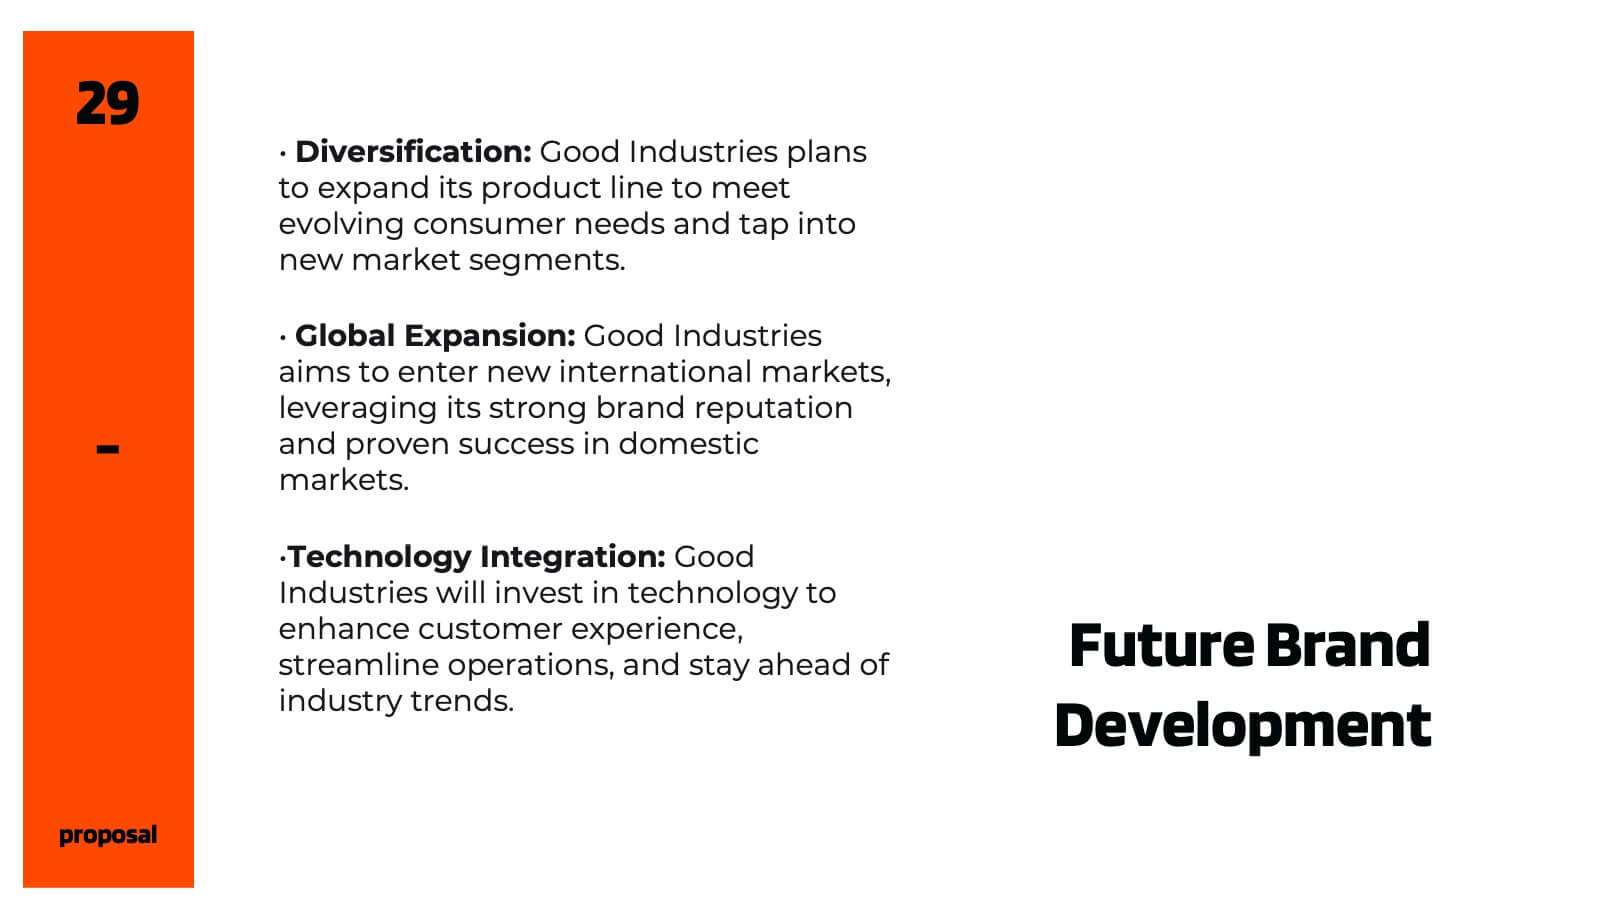
Brand guidelines are the set of rules that define the overall look and feel of your brand. They allow you to build a brand identity. A brand style guide is the ultimate resource for communicating your brand’s identity to everyone on your team. Use the Nahla template to help define your company's branding the correct way. This is a highly customizable, responsive template. Create a unique ambience that your customers and audience can recognize across all platforms. Nahla provides a platform for the design team to help shape the direction of your brand, while ensuring consistency.


6 slides
Green Business Practice Implementation Presentation
Showcase your sustainability strategy with this Green Business Practice Implementation Presentation. Featuring a segmented lightbulb diagram, this slide is ideal for outlining eco-friendly initiatives, sustainable development goals, or ESG compliance efforts. Perfect for corporate sustainability reports or green business planning. Fully compatible with PowerPoint, Keynote, and Google Slides.


4 slides
Oceania Business Growth Opportunities Map Presentation
Highlight key business locations across Oceania with this clean and modern map slide. Featuring pinpoint icons and four customizable title areas, it’s ideal for showcasing market entry points, regional offices, or investment zones. Fully editable in PowerPoint, Keynote, and Google Slides for seamless business planning and strategic presentations.


4 slides
Sports Metrics and Training Goals Presentation
Track, analyze, and present athletic performance with the Sports Metrics and Training Goals template. Featuring bar charts and a sports court graphic, this design is ideal for visualizing statistics, strategies, and progress. Fully customizable in Canva, PowerPoint, and Google Slides to align with your team’s branding and performance objectives.


30 slides
Chromalight Brand Guidelines Proposal Presentation
Elevate your brand's story with this visually engaging presentation template that embodies modern, professional aesthetics. From mission and vision statements to brand identity and market positioning, each slide is crafted to showcase your brand's core essence. Ideal for brand strategists and marketers, this template is compatible with PowerPoint, Keynote, and Google Slides.


6 slides
Responsive Design Display with Devices Presentation
Highlight your multi-device experience with the Responsive Design Display with Devices Presentation. This clean and modern layout features a central monitor and mobile phone illustration, surrounded by five customizable text points—ideal for showing key features or compatibility. Fully editable in Canva, PowerPoint, Keynote, and Google Slides.


6 slides
Construction Project Timeline and Stages Presentation
Map out your project from groundbreaking to completion with the Construction Project Timeline and Stages Presentation. This visual timeline uses illustrated trucks to represent key construction phases—ideal for progress reports, planning reviews, or contractor briefings. Fully editable in PowerPoint, Keynote, and Google Slides.


5 slides
Market Improvement Trends and Expansion in Oceania Map Presentation
Present your market insights with clarity using this Oceania-focused expansion map. Highlight four key regions with callouts and data pointers, ideal for tracking growth trends, regional strategies, or entry points. Fully editable and compatible with PowerPoint, Keynote, and Google Slides—perfect for strategic planning, investor decks, and regional market analysis.


12 slides
Real Estate House Market Trends Presentation
Analyze Real Estate House Market Trends with this insightful presentation template. Featuring a house-shaped hexagonal layout, this design helps illustrate key factors such as market demand, property values, investment opportunities, and housing policies. Ideal for real estate professionals, investors, and analysts looking to present market insights with clarity and impact. Fully customizable and compatible with PowerPoint, Keynote, and Google Slides.


5 slides
Business Strategy Infographic
A Business Strategy Infographic is a visual representation of a company's plan for achieving its long-term objectives. This infographic template includes charts, graphs, icons, illustrations, and texts that can help people understand and grasp the key points of a business strategy presentation. The colors, fonts, and layout are fully customizable making it easy to stay consistent with your company branding and style guidelines. Use this to provide an overview of your organization's mission, goals, competitive advantage, target market, products or services, and the tactics used to achieve success.


26 slides
Quantum Computing Presentation
Step into the future of technology with this fascinating presentation on quantum computing. Covering key concepts like quantum bits, superposition, entanglement, and real-world applications, this template helps simplify complex ideas for any audience. Fully customizable and compatible with PowerPoint, Keynote, and Google Slides for a seamless and insightful presentation experience.