


Features
- 4 Unique slides
- Fully editable and easy to edit in Microsoft Powerpoint, Keynote and Google Slides
- 16:9 widescreen layout
- Clean and professional designs
- Export to JPG, PDF or send by email


Do you have any questions?
Recommend


10 slides
Work-Life Balance and Time Planning Presentation
Showcase strategies for harmony and productivity with this scale-themed presentation template. Designed to highlight balance, prioritization, and goal-setting, this visual layout divides your content into four clear parts—perfect for wellness initiatives, HR planning, or personal productivity talks. Fully editable in PowerPoint, Keynote, and Google Slides.
8 slides
Creative Alphabet Visual Reference Presentation
This creative presentation uses a bold A–B–C visual structure to highlight key points in a clean, modern layout. Ideal for overviews, comparisons, or step-by-step frameworks. Fully customizable in Canva, it balances design and clarity—perfect for business strategies, education, or visual storytelling with strong alphabetical cues and icon integration.


7 slides
Roadmap Guide Infographic
A roadmap guide is a visual representation of the steps you need to take in order to reach your destination. A roadmap infographic is a great way to show your clients what the future will look like. Use this template to create an infographic that's high-energy, enthusiastic, and engaging. This infographic is designed to help guide you by showing where you are now, what direction you're going, and where you need to go next. This template is fully customizable and compatible with Powerpoint, Keynote, and Google Slides. Break down complex plans into easily digestible visual elements.


5 slides
Long-Term Strategy Slide Presentation
Ignite big ideas with a bold, forward-moving layout that makes long-range goals feel inspiring and achievable. This presentation helps you outline future plans, key milestones, and strategic priorities with clarity and visual impact. Easy to edit and fully compatible with PowerPoint, Keynote, and Google Slides.


6 slides
Project Proposal Goals Infographic
Maximize the impact of your project proposals with this professional collection of templates, designed to outline your project goals and strategies with precision. Each template facilitates clear communication of project objectives, timelines, and the desired outcomes, making them essential for project managers, consultants, and business analysts. These slides are crafted with a clean, corporate design that uses a harmonious blend of blue tones, engaging charts, and concise content layouts. This ensures that key points are easily digestible and effectively conveyed to stakeholders. The structured format of these templates is ideal for detailing the scope of work, expected milestones, and resource allocation, supporting a comprehensive overview of your project plan. Customize these templates to align with your organization's branding and project specifics, enhancing your presentation and strengthening the proposal's persuasive power. Whether for internal briefings or external pitches, these slides are tailored to help you present a coherent and compelling case for your projects.


21 slides
Aquamarine Creative Portfolio Presentation
Dive into creativity with this stunning aquamarine-inspired portfolio presentation! Perfect for showcasing your creative work, this template allows you to highlight your projects, skills, and achievements with a refreshing and modern design. Its clean and dynamic layout enhances your portfolio's impact. Compatible with PowerPoint, Keynote, and Google Slides.


6 slides
Mission and Values Overview Presentation
Your company's purpose deserves a visually stunning story! This infographic presentation template helps you clearly outline core values and mission statements with an engaging, structured design. Ideal for business strategy meetings, corporate presentations, and branding discussions, it keeps your content professional and impactful. Fully customizable and compatible with PowerPoint, Keynote, and Google Slides.


5 slides
Healthcare Solutions in Modern Medicine Presentation
Present pharmaceutical and medical data with clarity using these modern healthcare infographics. Designed with pill packs, bandages, and capsules, this editable template is ideal for illustrating treatment comparisons, solution options, or patient care data. Perfect for medical professionals, health startups, and researchers using PowerPoint, Keynote, or Google Slides.


7 slides
Smart House Concept and Design Layout Presentation
Present your smart home innovations with the Smart House Concept and Design Layout Presentation. This slide features a central house icon and six circular nodes, ideal for explaining home automation systems, IoT integrations, or security features. Fully editable in Canva, PowerPoint, Keynote, and Google Slides—perfect for tech startups, product demos, and future living pitches.


4 slides
Preventative Healthcare Strategies Presentation
Present medical insights with clarity using this syringe-themed slide layout designed for preventative healthcare strategies. Ideal for showcasing public health plans, vaccination drives, or early intervention tactics. Fully editable in PowerPoint, Keynote, and Google Slides, this modern visual aids healthcare professionals in delivering data-driven, concise messages with professional impact.


6 slides
Community Network Infographic
A community network is a localized, often root-driven, communication infrastructure that connects individuals, organizations, and institutions within a specific geographical area or community. This Infographic template visually represents the connections, relationships, and interactions within a community, often focusing on its members, resources, and activities. This template is a powerful way to showcase the dynamics and vitality of a community. This highlights the central theme or purpose of the community at the center of the infographic. This is fully customizable and compatible with Powerpoint, Keynote, and Google Slides.


21 slides
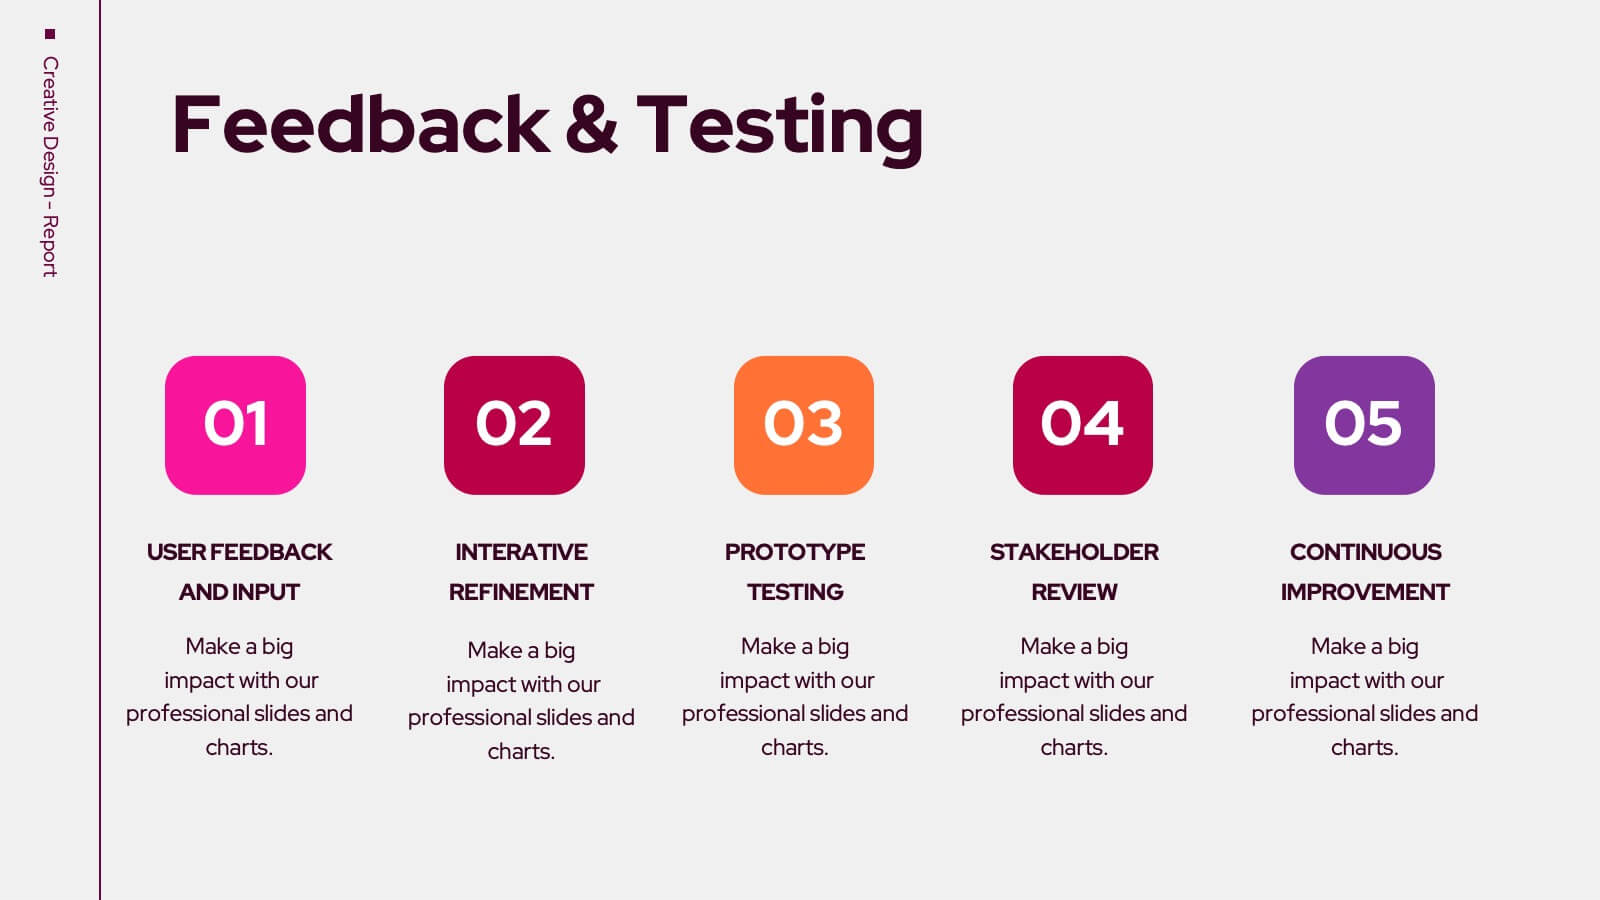
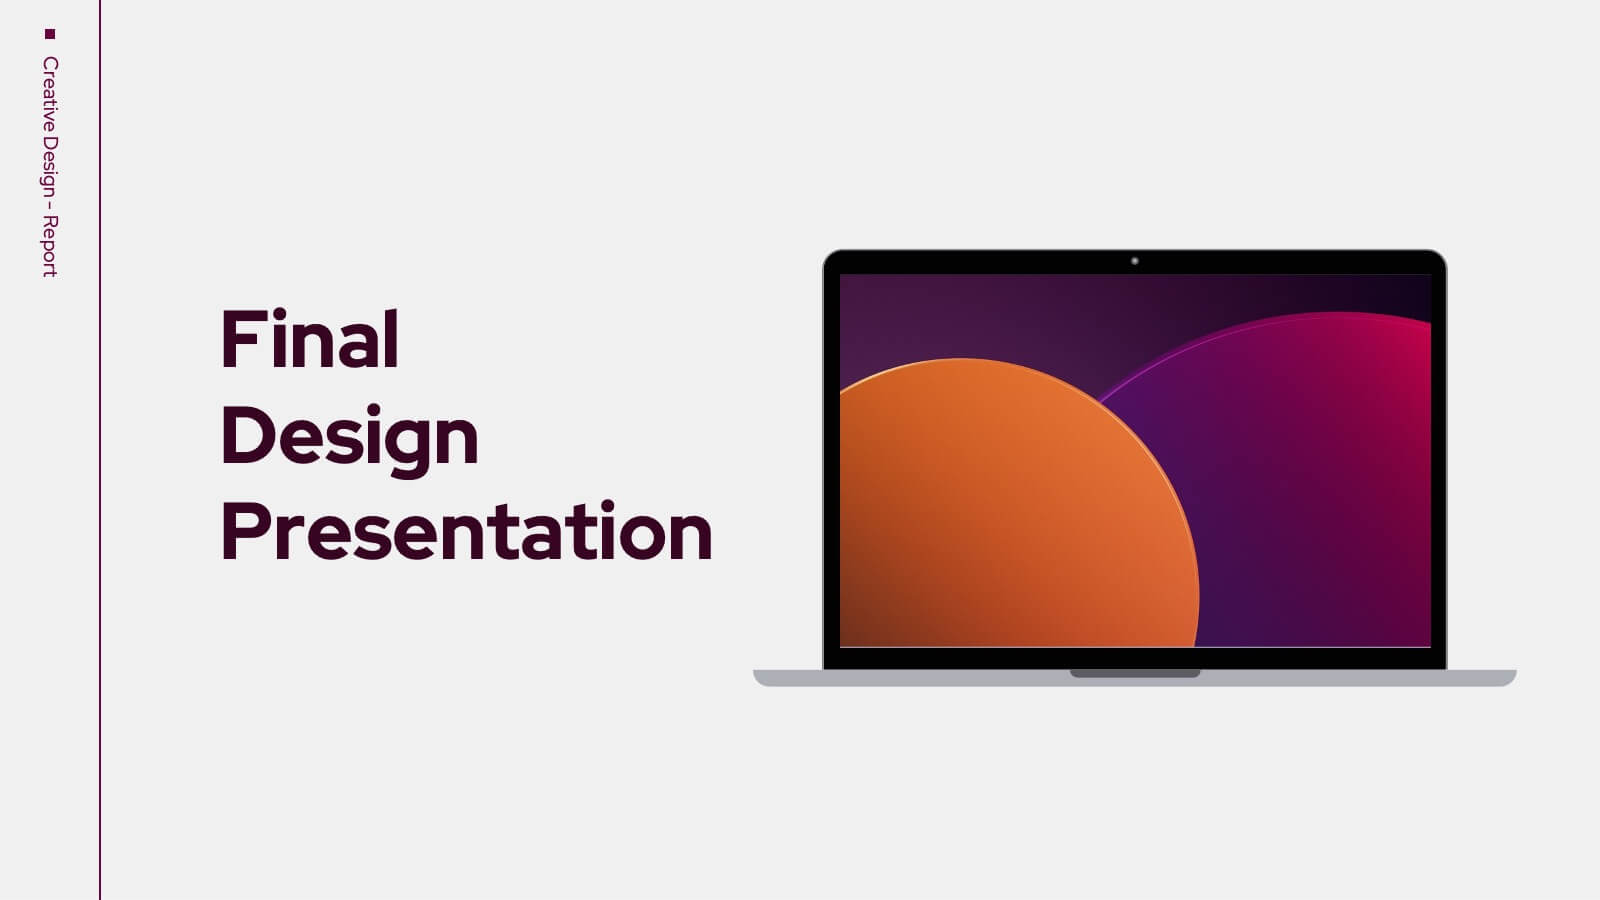
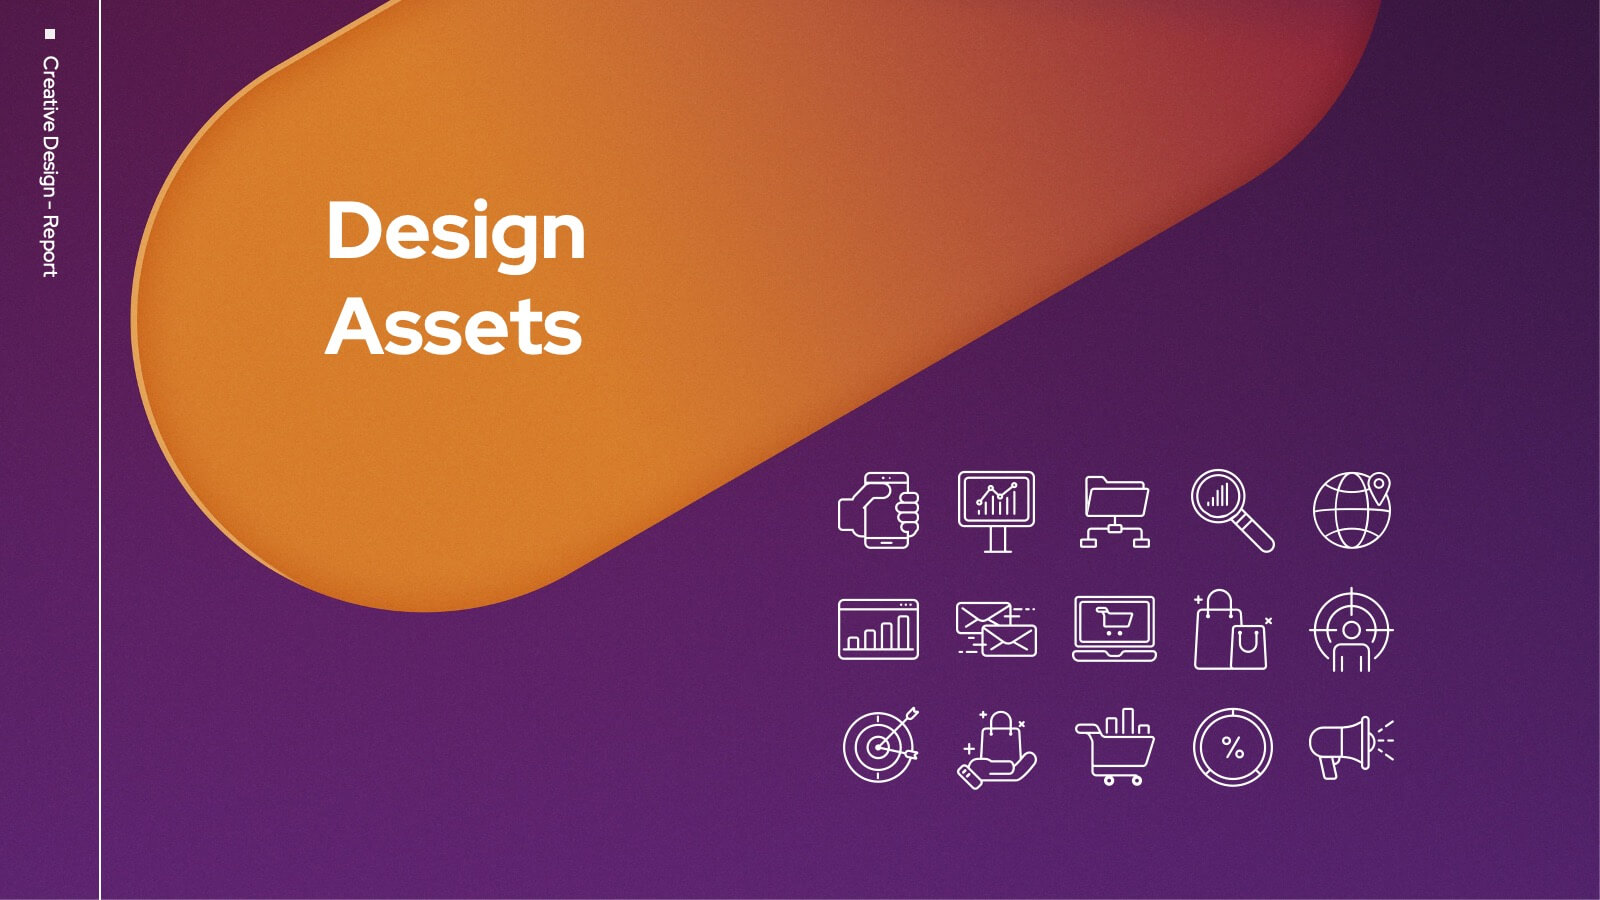
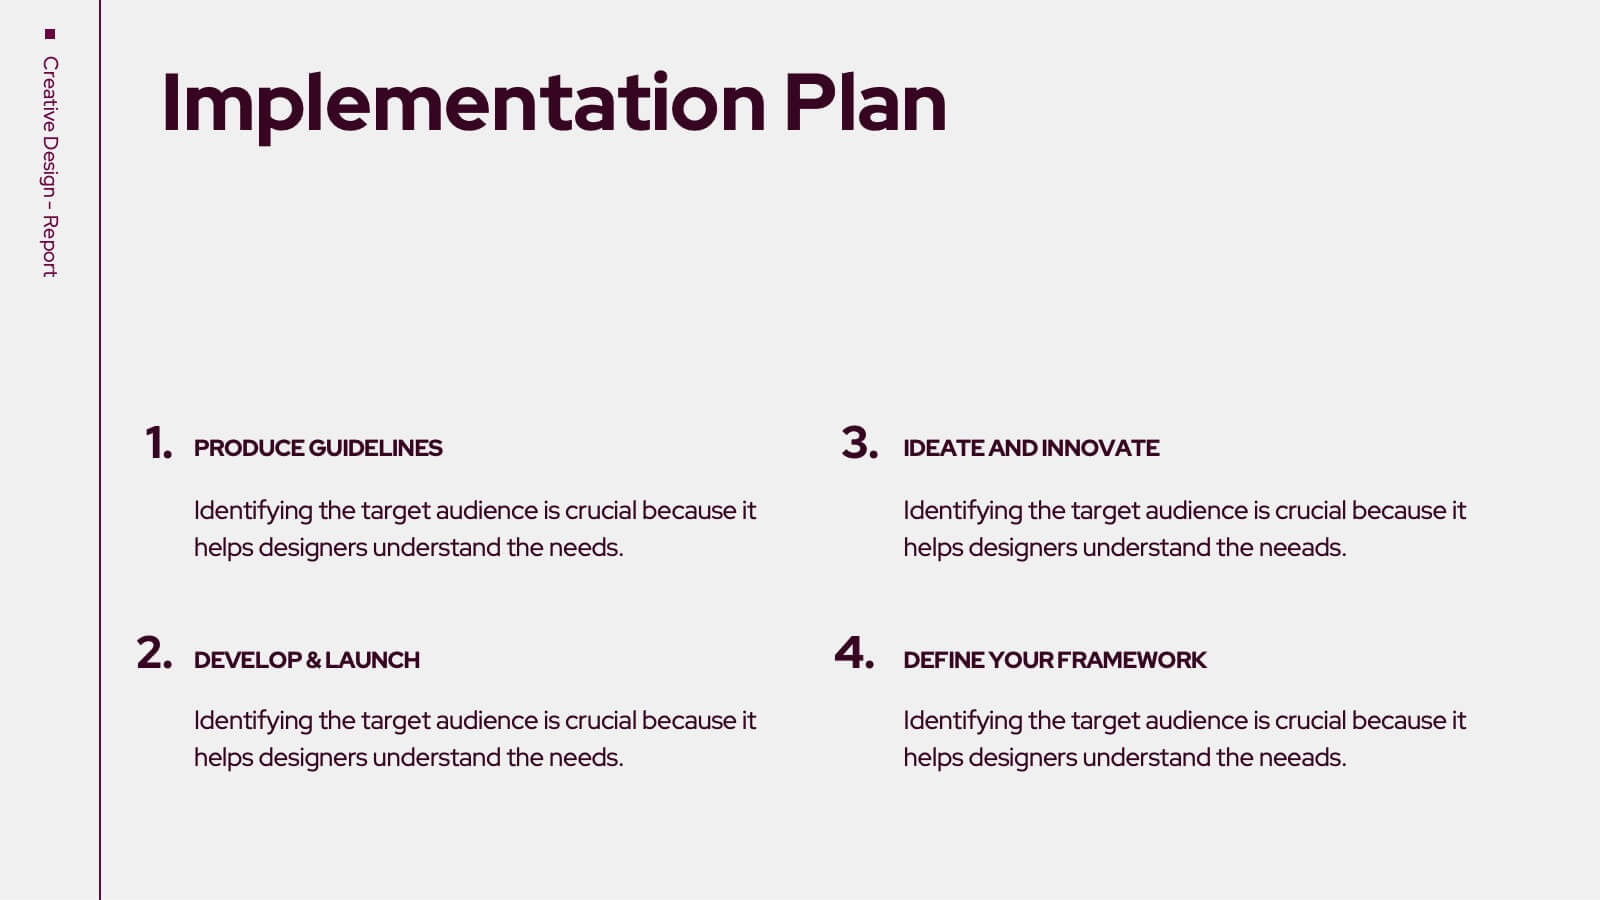
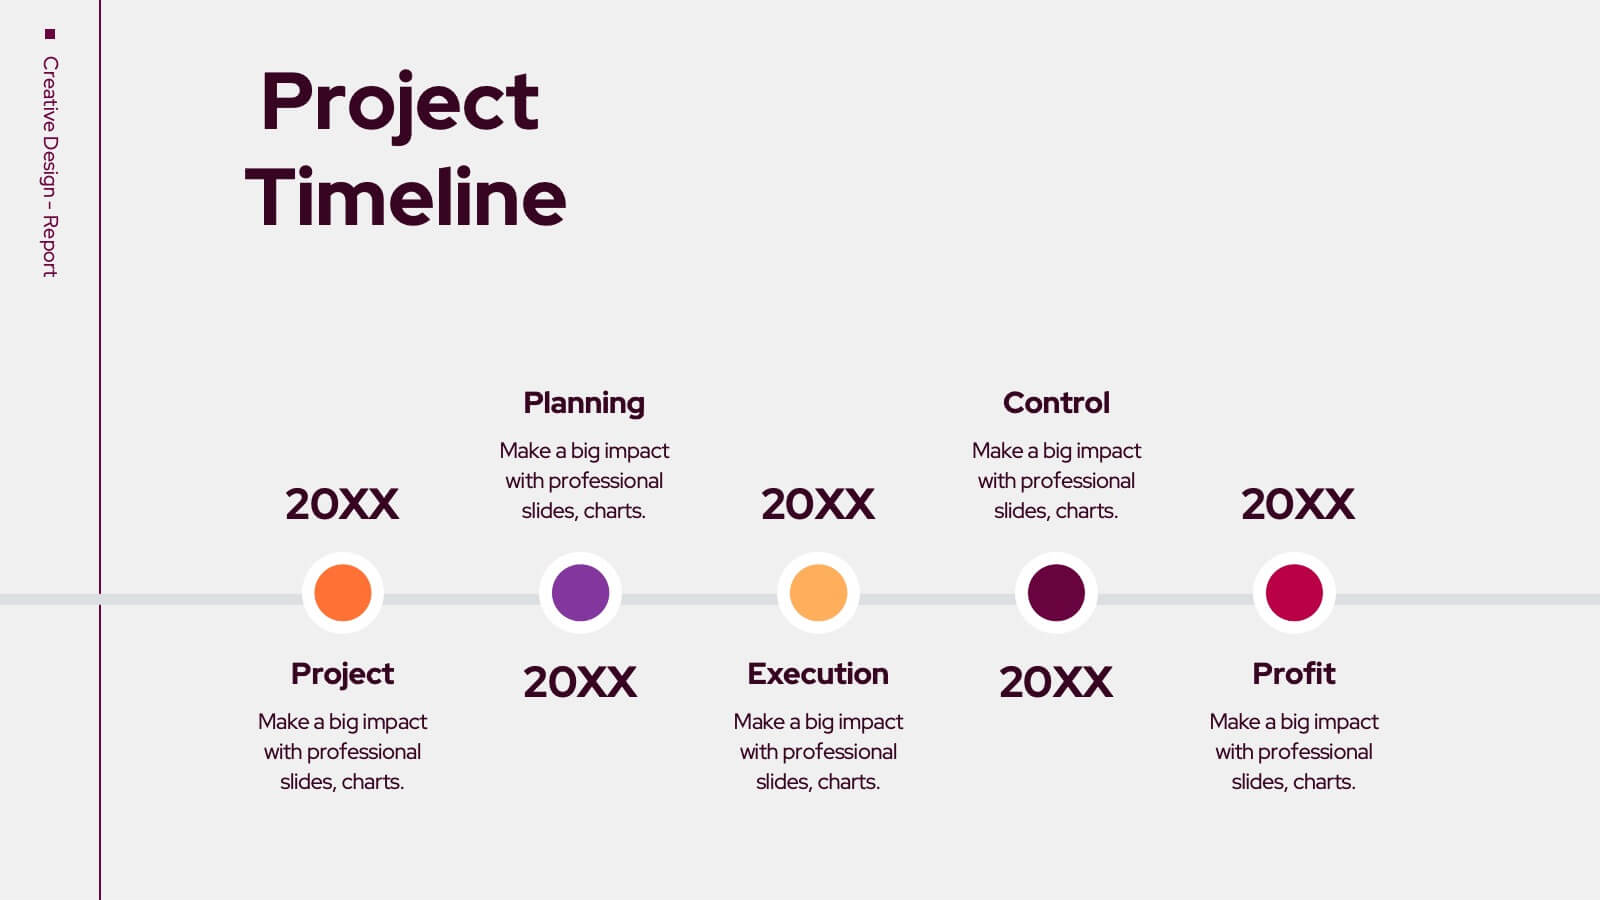
Trojan Creative Design Report Presentation
Unleash your creativity with this striking Trojan-inspired presentation template! Ideal for showcasing your design projects, this presentation enables you to highlight key concepts, inspirations, and visual elements effectively. Its engaging layout ensures your ideas shine through, captivating your audience. Compatible with PowerPoint, Keynote, and Google Slides for seamless presentations.


7 slides
Business People Networking Infographic
Networking is the lifeblood of any thriving business. Our business people networking infographic, designed in a pristine white backdrop with striking orange highlights and sophisticated black nuances, encapsulates the essence of professional connections and collaborations. It provides a visual representation of how relationships can foster growth, open opportunities, and catalyze success. Tailored for business leaders, conference organizers, and networking event planners, this template offers a compelling narrative of networking's power. Fully optimized, it's compatible with leading presentation platforms: PowerPoint, Keynote, and Google Slides.


4 slides
Stock Market Insights and Trends Presentation
Visualize complex financial data with ease using the Stock Market Insights and Trends presentation template. This layout features a bold line chart with labeled milestones to highlight key shifts in performance, market patterns, or strategic indicators. Ideal for investment reports, financial briefings, and economic updates. Perfect for analysts, finance professionals, and business strategists. Fully editable and compatible with PowerPoint, Keynote, and Google Slides.


10 slides
Human Resources Process Diagram
The "Human Resources Process Diagram" presentation template is designed to streamline the visualization of the HR process from analysis to evaluation. This template allows for a detailed display of the stages involved in HR processes, such as analyzing, designing, developing, implementing, and evaluating, making it ideal for training sessions, strategic HR presentations, and management meetings. The circular flow of the diagram emphasizes the continuous and interconnected nature of HR activities, facilitating better understanding and communication of complex processes. Each segment is color-coded for easy identification and reference, enhancing both the aesthetic appeal and the functionality of the presentation.


4 slides
Financial Budget Forecasting Presentation
Predict and manage your financial future with our 'Financial Budget Forecasting' template, perfect for visualizing quarterly budget allocations and expectations. This versatile tool aids in creating clear, concise, and visually engaging financial presentations, and is compatible with PowerPoint, Keynote, and Google Slides, making it a must-have for finance professionals and budget planners.


5 slides
Eco-Friendly Business Strategy Slides Presentation
Inspire sustainable growth with a clean, modern presentation built for eco-conscious businesses. Perfect for outlining green initiatives, corporate responsibility goals, or environmental strategies, it helps you communicate ideas with clarity and impact. Fully editable and compatible with PowerPoint, Keynote, and Google Slides for a seamless, professional presentation experience.