


Features
- 26 Unique slides
- Fully editable and easy to edit in Microsoft Powerpoint, Keynote and Google Slides
- 16:9 widescreen layout
- Clean and professional designs
- Export to JPG, PDF or send by email


Do you have any questions?
Recommend


29 slides
Shadowglow Brand Guidelines Proposal Presentation
Present a cohesive brand vision with this professional template, designed for crafting detailed and visually compelling brand guidelines. Highlight essential components like brand vision and mission, brand values, and identity elements, including color palettes, typography, and imagery. This template seamlessly incorporates customer personas, tone and voice guidelines, and brand touchpoints to define the essence of your brand's communication. Utilize slides for website, social media, and packaging strategies to establish consistency across all platforms. Customizable and compatible with PowerPoint, Google Slides, and Keynote, this design ensures clarity and professionalism, making it ideal for agencies or teams presenting comprehensive brand proposals.


4 slides
Cybersecurity Risk Protection Plan Presentation
Secure your message with a fingerprint-inspired layout that stands out. This Cybersecurity Risk Protection Plan template breaks down risk mitigation strategies into four clear points—ideal for tech, IT, and compliance presentations. Showcase protocols and data protection methods effectively. Works seamlessly with PowerPoint, Keynote, and Google Slides.


8 slides
Directional Diagram with Progress Arrows Presentation
Showcase milestones, track development, or visualize progress with the Directional Diagram with Progress Arrows Presentation. This modern layout features arrow-based steps, making it ideal for roadmaps, process stages, or timeline breakdowns. Customize labels, icons, and colors to suit your message. Fully editable in PowerPoint, Google Slides, and Canva.
21 slides
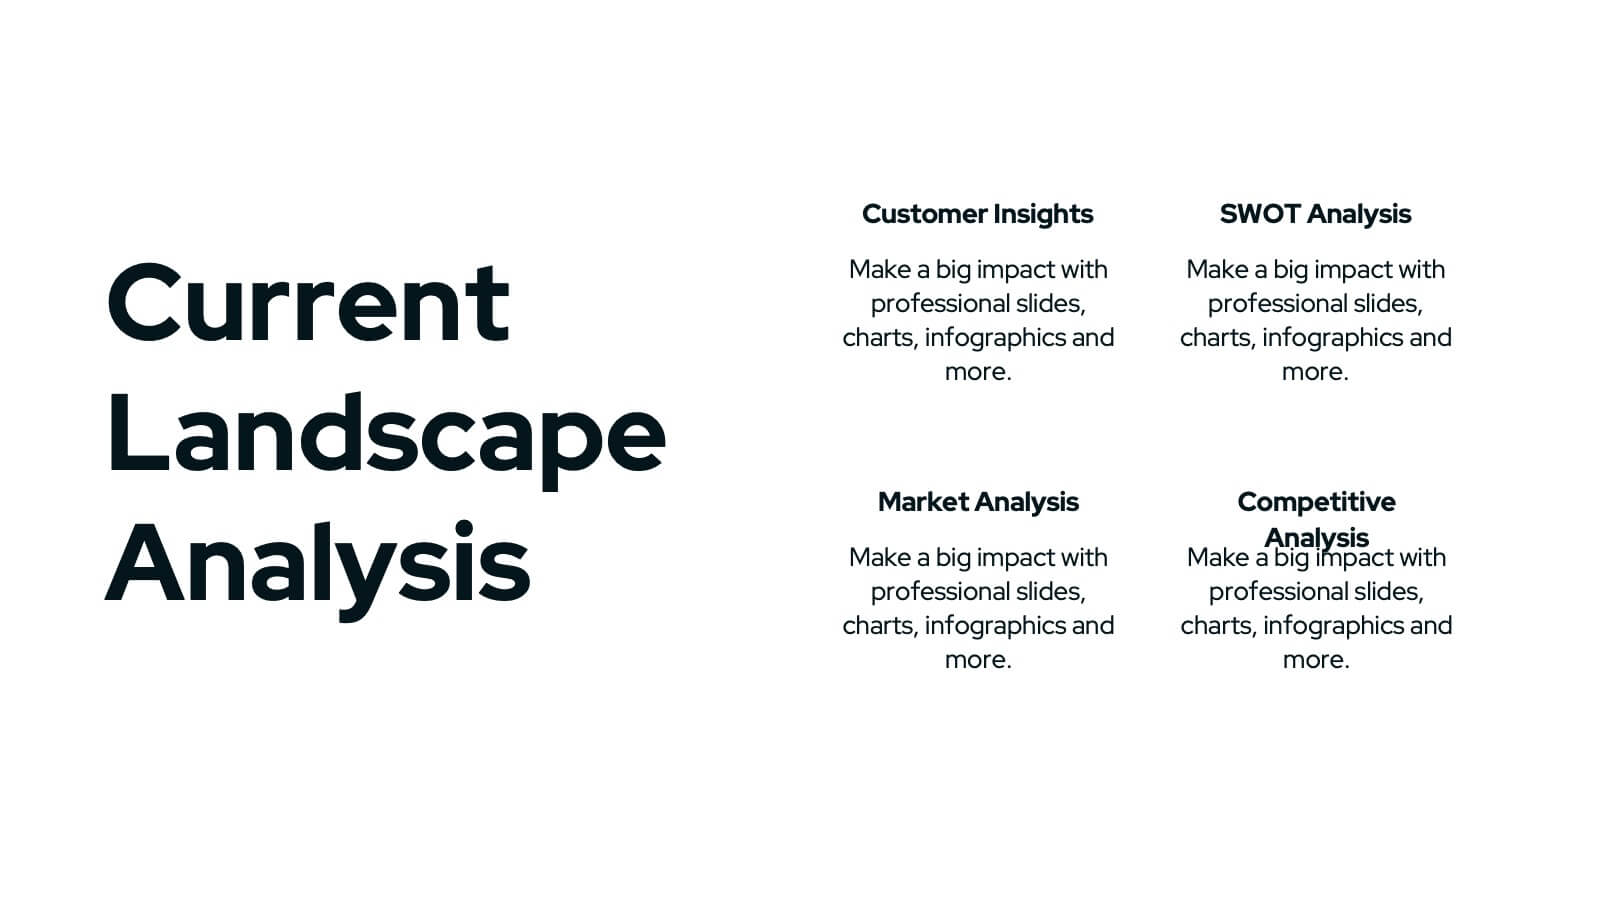
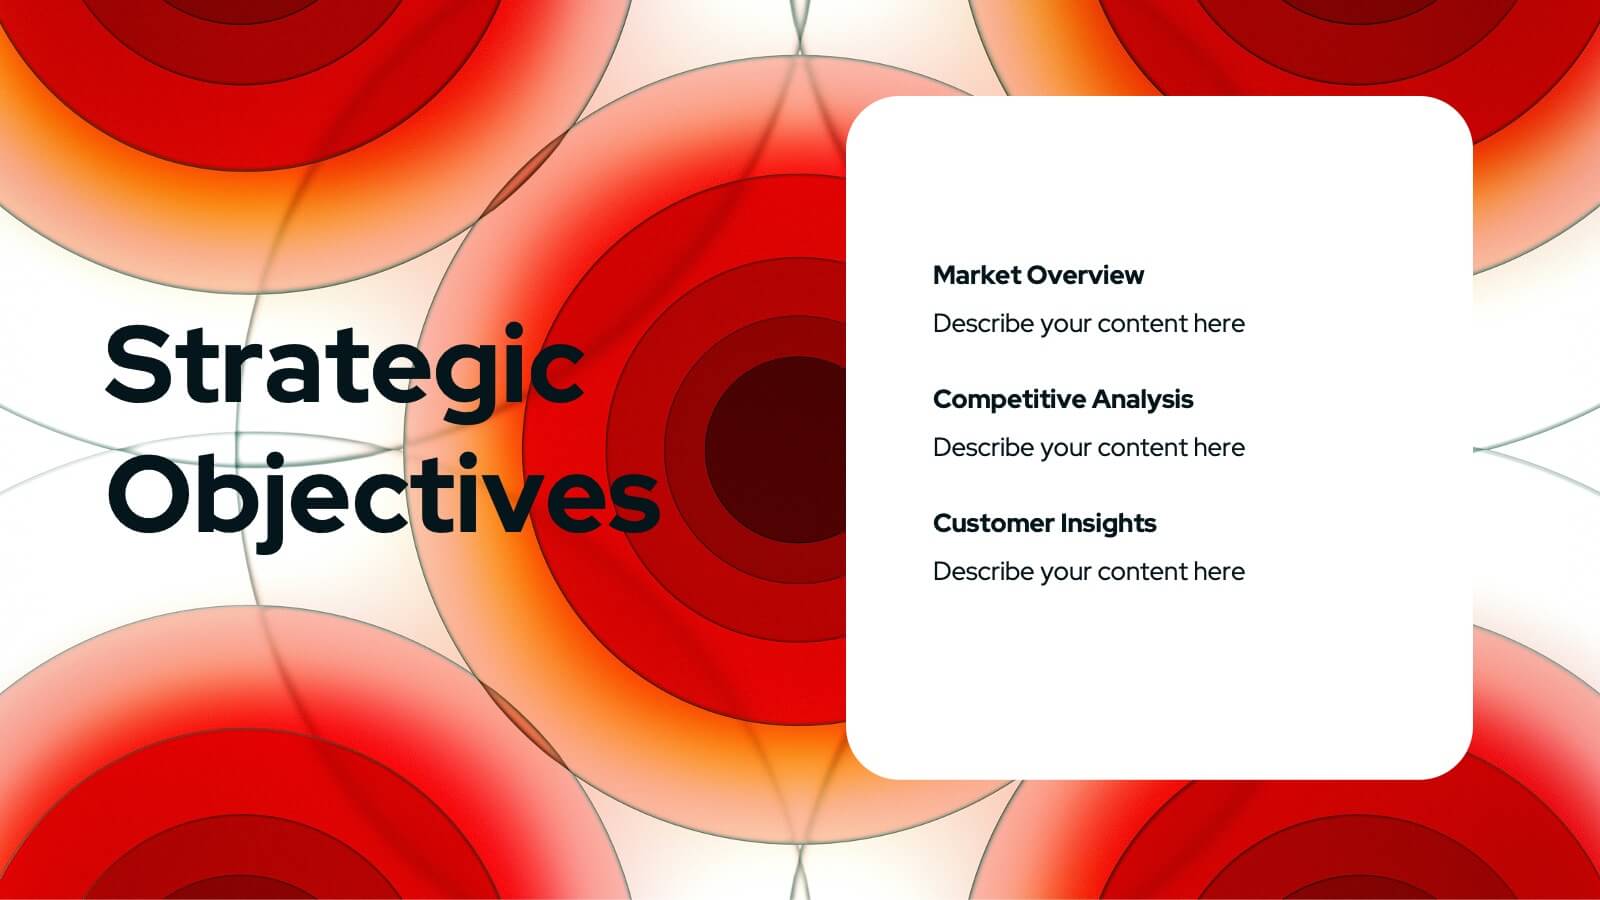
Wyrm Marketing Strategy Plan Presentation
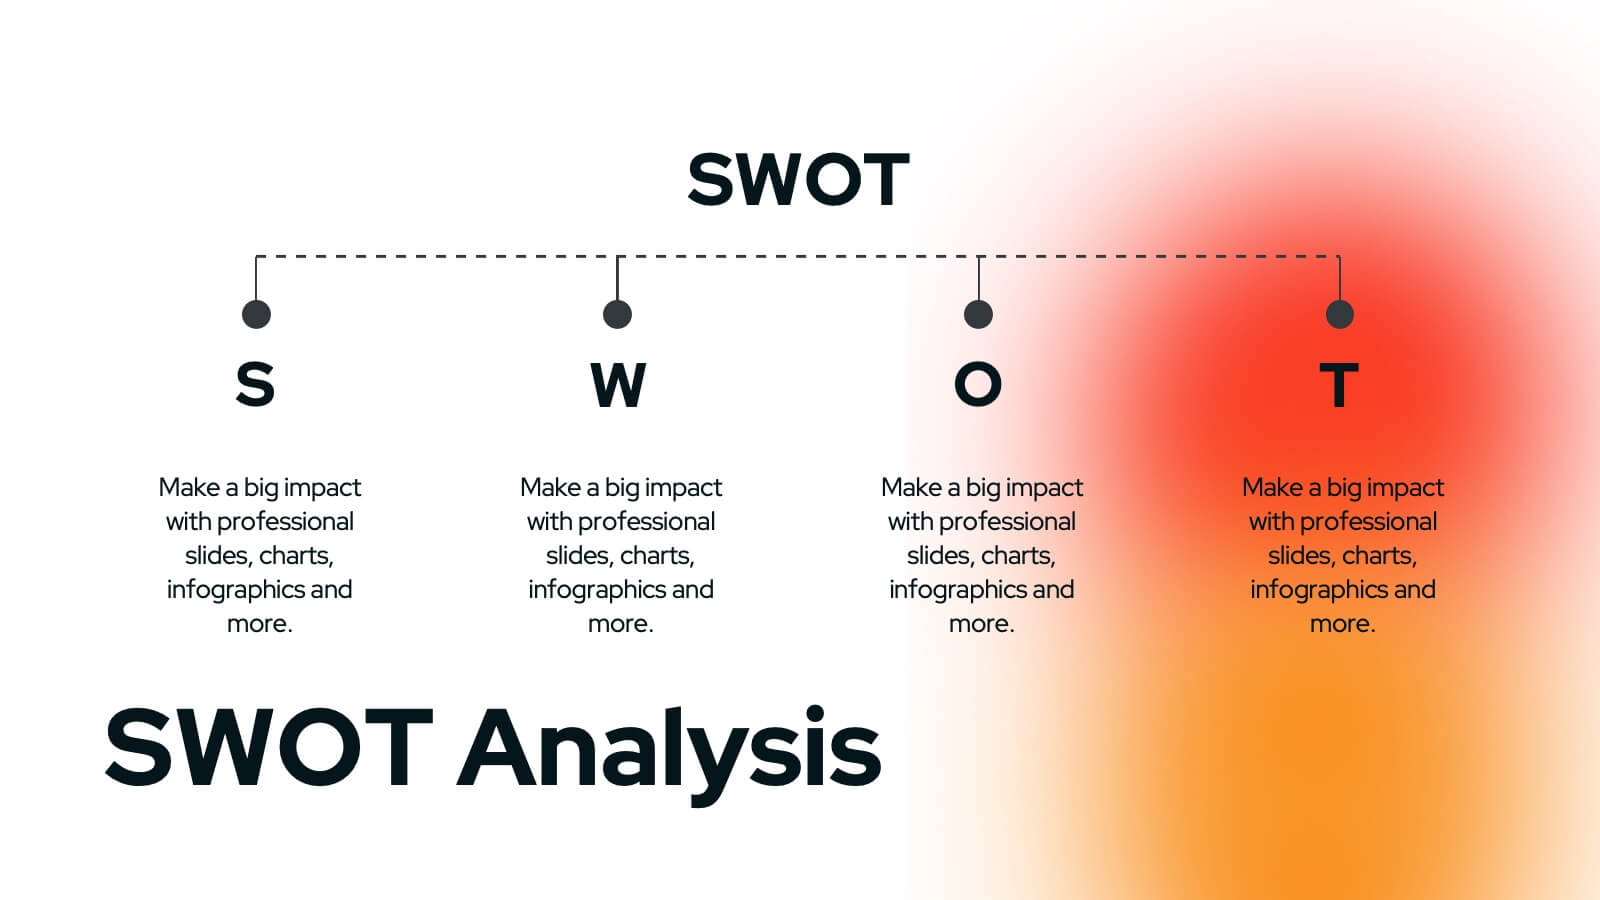
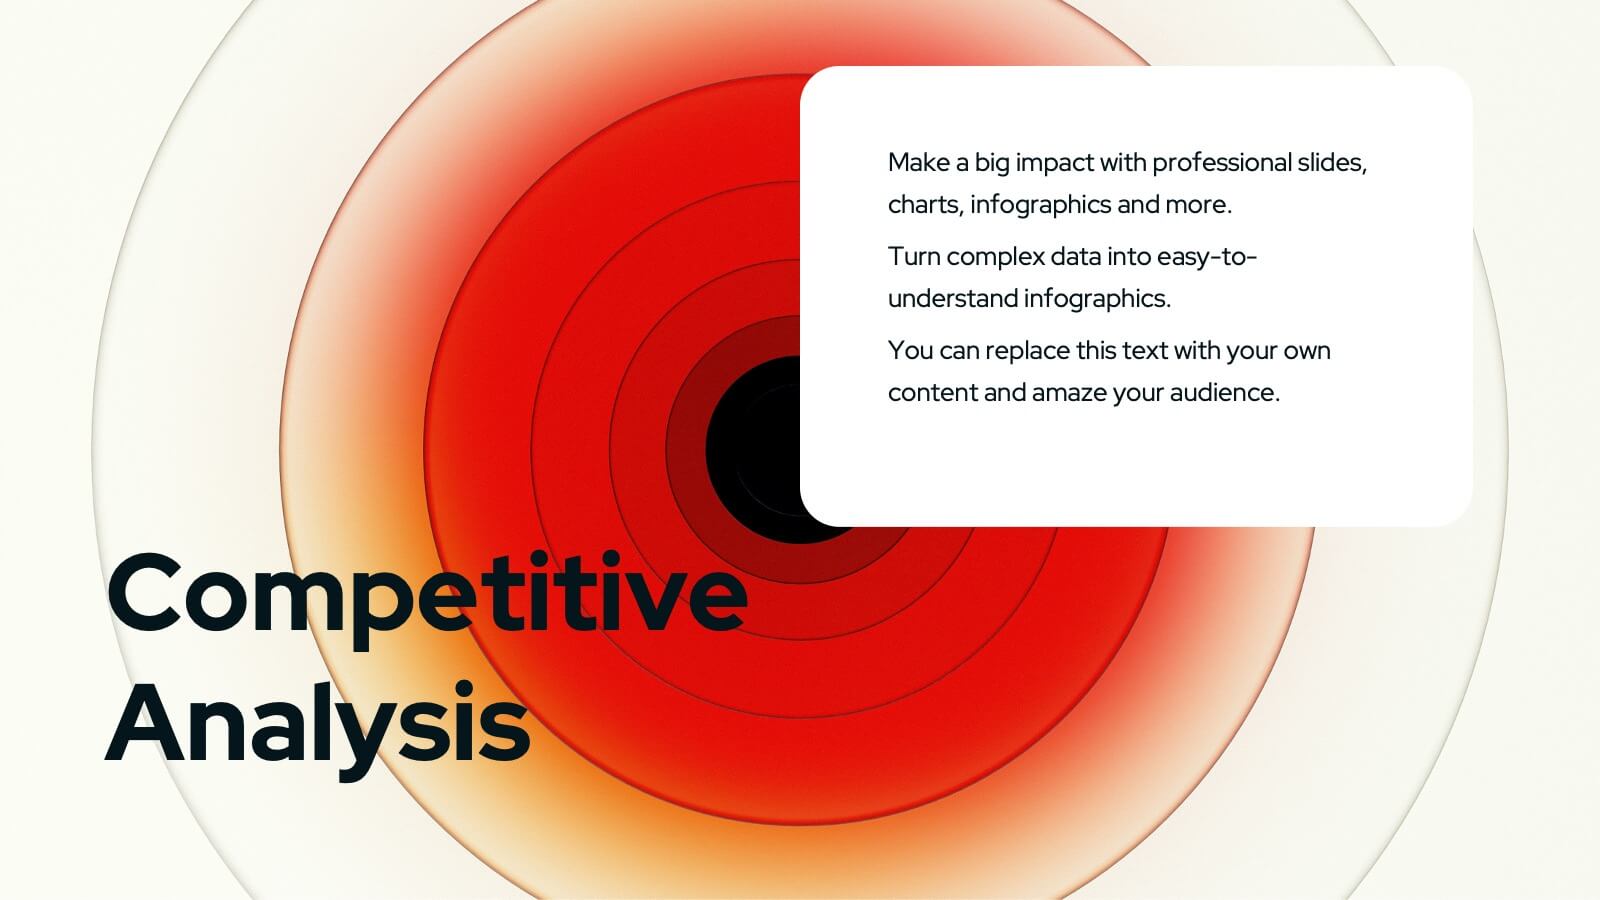
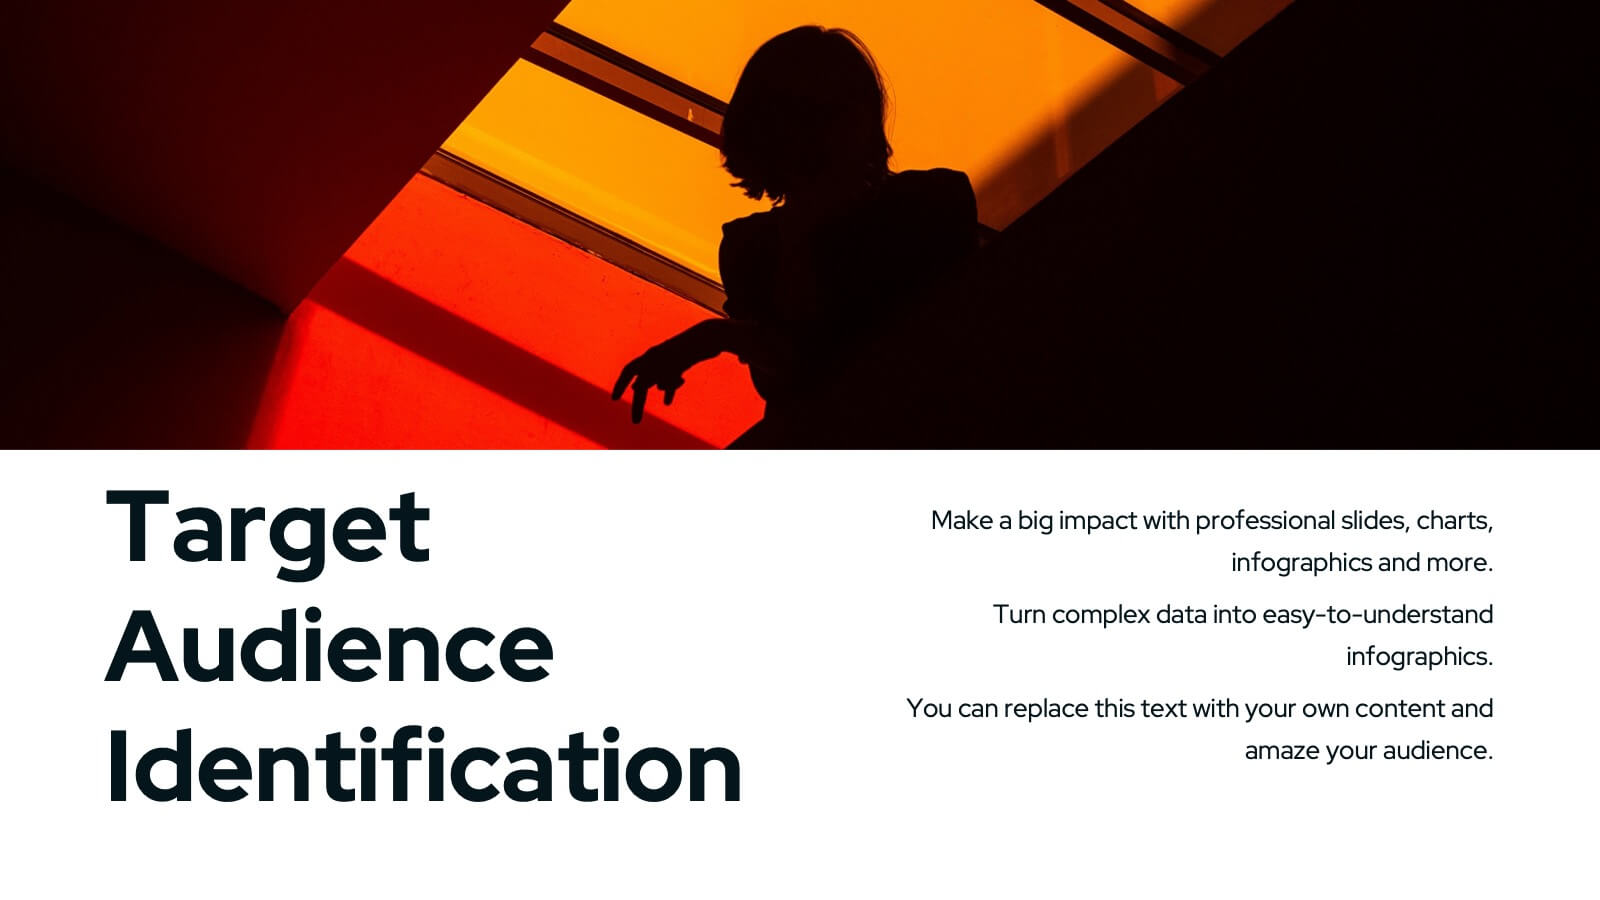
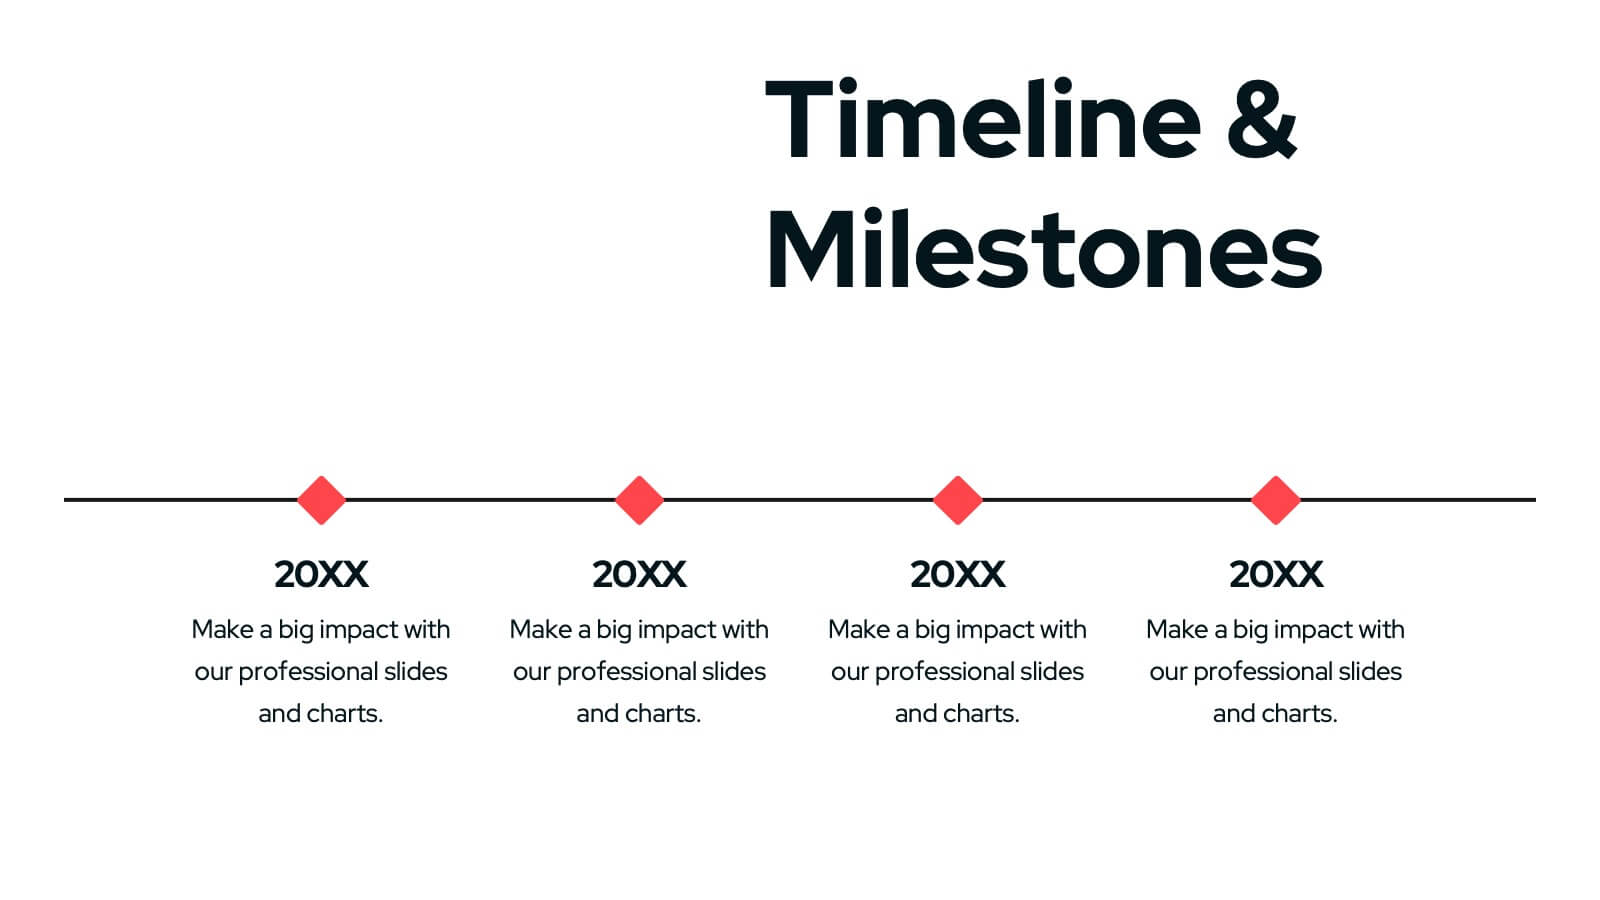
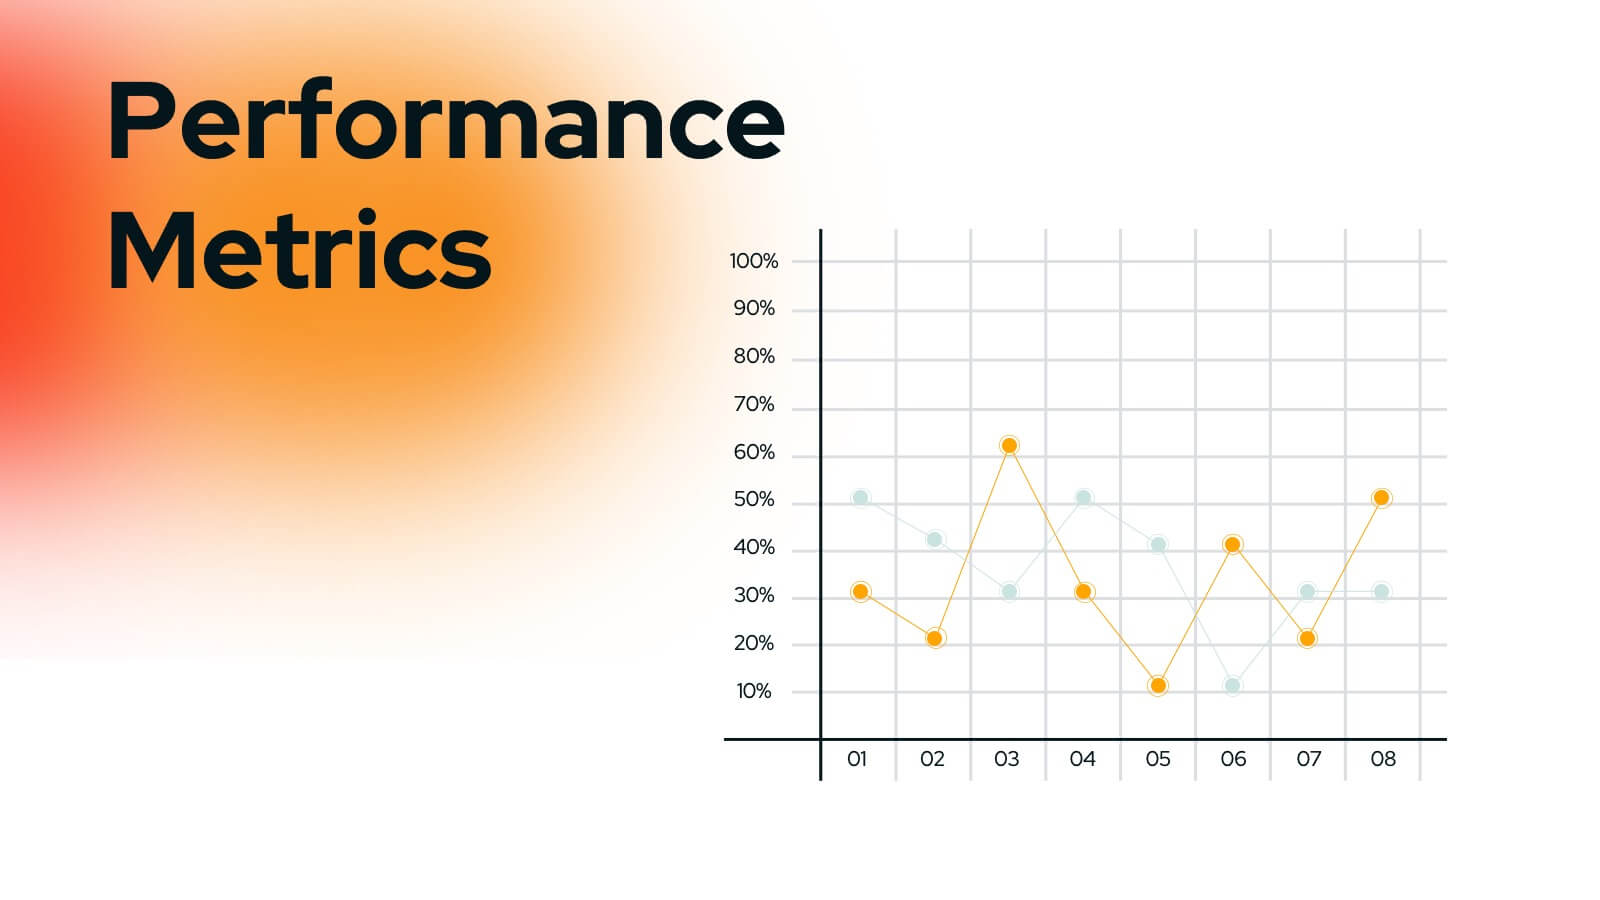
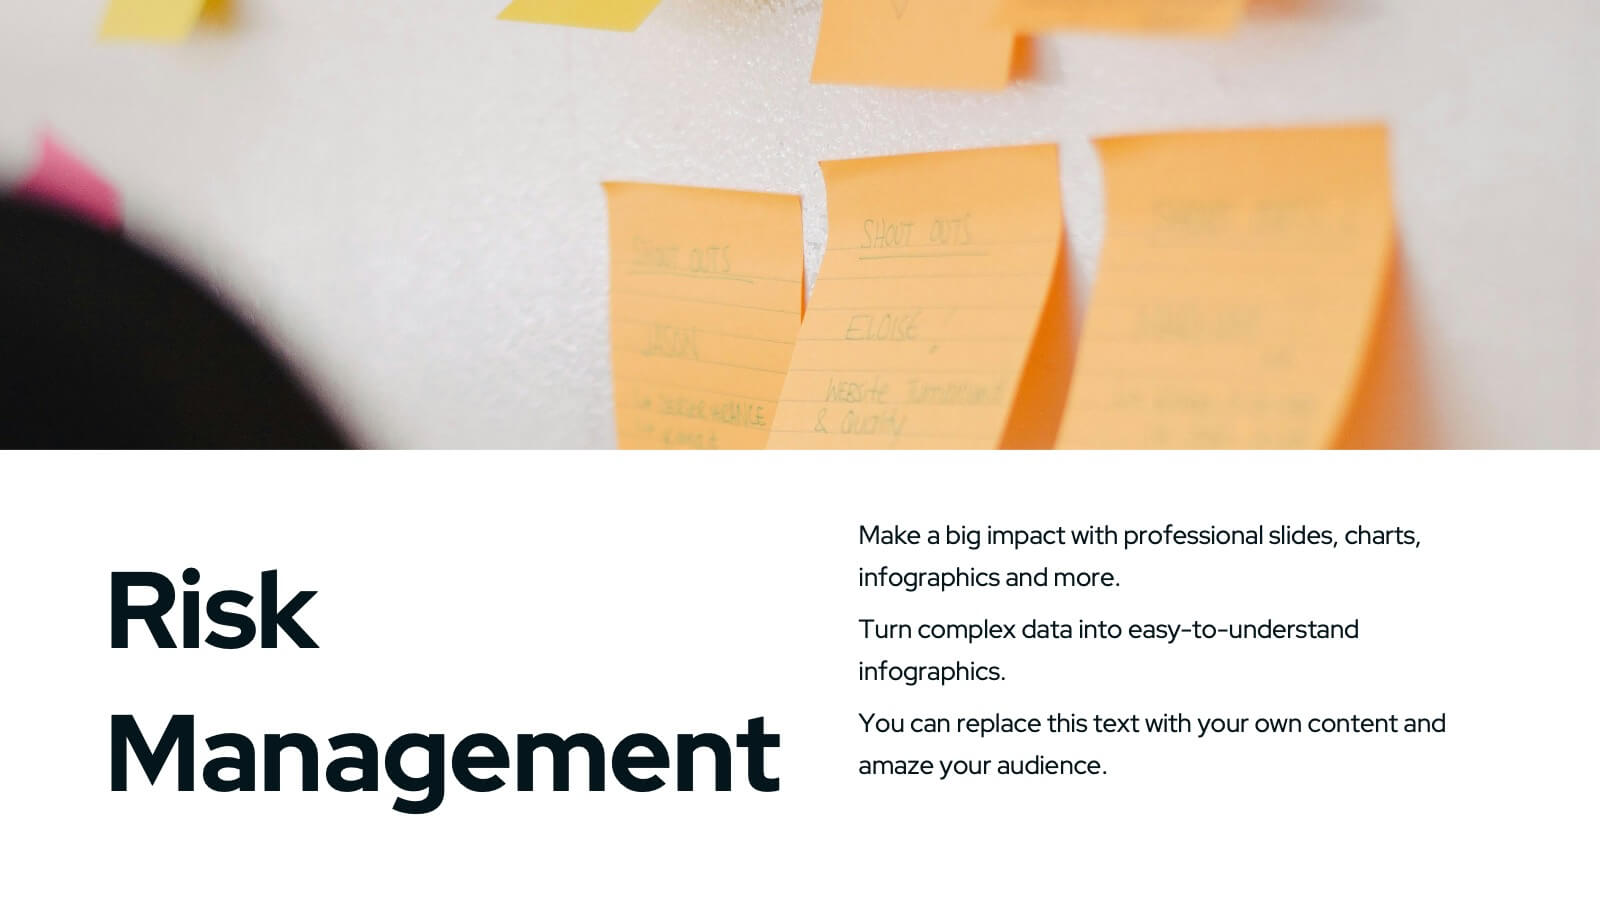
Unleash the power of your marketing strategy with this bold and dynamic presentation template! Perfect for covering everything from landscape analysis and target audience identification to performance metrics and risk management. This template helps guide your audience through key challenges, SWOT analysis, and strategic initiatives with clarity and impact. Compatible with PowerPoint, Keynote, and Google Slides for effortless and engaging presentations.


4 slides
Corporate Portfolio of Achievements Presentation
Present your professional milestones with this sleek, image-focused layout. Featuring a large photo placeholder and three clearly defined highlights, this slide is ideal for showcasing company achievements or project phases. Fully editable in PowerPoint, Keynote, and Google Slides—perfect for client updates, internal reviews, or corporate storytelling.


26 slides
Ioel Presentation Template
Here's the perfect kickstart to your business with a presentation template that you’ve been dreaming of! Ioel's crisp, bold font and a clean aesthetic that is engaging to any audience. This template will give your business a bolder and more professional image that you need. Ioel's bold blue background is eye-catching, making this template perfect for businesses seeking to make a great impression. This template will make it easy for you to create an attractive and professional-looking deck. Any business owner wishing to make an impression on their audience will want to use this presentation.


8 slides
Sustainable Operation & Ethical Practice Presentation
Illustrate your ethical initiatives and operational sustainability with this water drop flow diagram. Ideal for outlining four key actions or principles, it features a faucet visual and icon-based content drops. Fully customizable in PowerPoint, Keynote, and Google Slides—perfect for ESG reporting, CSR updates, and eco-conscious business presentations.


22 slides
Dakota Corporate Strategy Agenda Presentation
Maximize your strategic sessions with this dynamic corporate strategy agenda presentation template. This template is designed to streamline your business discussions, featuring sections for everything from speaker introductions to session overviews and networking breaks. It’s ideal for conferences, workshops, or any corporate gatherings where a clear, structured schedule is essential. Compatible with major platforms like PowerPoint, Google Slides, and Keynote, it ensures you can organize and execute your agenda efficiently, fostering effective communication and collaboration across your team.


10 slides
Hierarchy Tree Structure Slide Presentation
Bring your ideas to life with a dynamic visual flow that connects every stage of your business strategy. Perfect for mapping growth, processes, or team structures, this clean and modern layout keeps your data clear and engaging. Fully compatible with PowerPoint, Keynote, and Google Slides for effortless customization.


6 slides
2-Option Comparison Chart Presentation
Make your decision-making story pop with a clean, energetic layout that clearly contrasts two paths side by side. This presentation helps you compare options, outline pros and cons, and guide audiences toward confident choices with sharp visual structure. Fully compatible with PowerPoint, Keynote, and Google Slides.


4 slides
Startup Business Plan Executive Overview Presentation
Present your startup vision with this bold, rocket-themed executive overview template. Perfect for outlining growth strategies, milestones, and launch plans, it combines vibrant visuals with a clean layout. Fully editable in Canva, PowerPoint, and Google Slides, it’s ideal for inspiring investors and stakeholders with a clear, professional business roadmap.


26 slides
Forge Brand Strategy Report Presentation
The Brand Strategy Presentation Template is a sleek solution for showcasing brand identity. Highlight mission, values, audience personas, and future growth plans across 26 structured slides. Fully customizable for PowerPoint, Keynote, and Google Slides, it’s ideal for presenting brand insights to clients or stakeholders with professionalism and clarity.


5 slides
Feedback Collection Strategy Presentation
Engage your audience with a dynamic visual that simplifies how feedback is gathered and turned into meaningful action. This presentation helps illustrate communication loops, data flow, and process improvements with clarity and style. Fully editable and compatible with PowerPoint, Keynote, and Google Slides for seamless customization and professional delivery.


8 slides
Agriculture Business Model Presentation
Turn your ideas into growth with this vibrant and modern presentation design. Perfect for explaining market strategies, production cycles, or investment models in agriculture, it helps visualize key stages from concept to harvest. Fully customizable and compatible with PowerPoint, Keynote, and Google Slides for a seamless presentation experience.


4 slides
Business Growth and Strategy Plan Presentation
Showcase your company’s path forward with this Business Growth and Strategy Plan Presentation. Designed with a curved arrow layout, it visually maps out three key milestones or initiatives. Ideal for strategic roadmaps, planning sessions, or executive updates. Fully editable in Canva, PowerPoint, or Google Slides.


8 slides
Air Travel Safety and Operations Presentation
Capture your audience’s attention with this aviation window-inspired layout, designed to visualize safety protocols or operational steps in air travel. Featuring four distinct segments arranged like a view through a plane window, it’s ideal for airline safety briefings, operational workflows, or compliance overviews. Fully editable in PowerPoint, Keynote, and Google Slides.


5 slides
Agricultural Business Strategy
Showcase your farming goals and plans with this circular, step-based strategy slide. Perfect for presenting agricultural business models, market planning, or farm-to-market strategies. The layout uses clean icons and an engaging central farm illustration to enhance clarity. Fully editable in PowerPoint, Keynote, and Google Slides.