


Features
- 26 Unique slides
- Fully editable and easy to edit in Microsoft Powerpoint, Keynote and Google Slides
- 16:9 widescreen layout
- Clean and professional designs
- Export to JPG, PDF or send by email


Do you have any questions?
Recommend


26 slides
Abstract Technology Presentation
Artificial intelligence is helping to drive the future and make it better, it has the potential to transform how we live and work. This is a detailed presentation template for artificial intelligence technology, with an abstract design and chart slides that can be used to demonstrate how this technology works. This template will help you inform your audience about what artificial intelligence is. Easy to edit and customize, this template will allow you to create your own story around the concept of artificial intelligence, while still presenting your information in an organized format.


5 slides
Business Gaps and Solutions Assessment Presentation
Spot the gaps and climb to clarity with this smart pyramid-style assessment design. Perfect for identifying weaknesses and matching them with targeted solutions, this layout helps teams visualize challenges at every level of the business. Use it to guide strategy with confidence. Works great in PowerPoint, Keynote, and Google Slides.


26 slides
Simple Fitness Exercise Presentation
Energize your presentations with our dynamic template, designed for those looking to showcase health and wellness routines effectively. This template uses a vibrant color palette of black and orange, embodying energy and vitality, making it a perfect match for themes centered around active lifestyles and personal well-being. The layout is versatile, featuring a variety of slides tailored for demonstrating detailed instructional content, comparing benefits, and summarizing key health statistics with eye-catching infographics. Motivational quotes and impactful image slides are included to provide visual inspiration and engage the audience. Ideal for workshops, training seminars, or online courses, this template ensures your content is both informative and visually appealing. Fully compatible with PowerPoint, Keynote, and Google Slides, it facilitates a smooth and effective presentation experience across different platforms.


5 slides
Perspective of Economic Trends in Africa Map Presentation
Visualize key economic insights across Africa with this data-driven map layout. Use labeled progress bars and highlighted countries to present regional performance, sector growth, or market distribution. Fully editable in PowerPoint, Keynote, or Google Slides, this clean template is ideal for business reports, financial reviews, and investment-focused presentations.


5 slides
Teaching Framework Presentation
Bring your teaching steps to life with a clear, uplifting layout that turns educational progression into an easy-to-follow visual journey. This presentation helps you break down concepts, outline stages, and guide learners smoothly from one level to the next. Fully compatible with PowerPoint, Keynote, and Google Slides.


2 slides
Detailed Buyer Profile Analysis Layout Presentation
Showcase a clear snapshot of your customer insights with this Detailed Buyer Profile Analysis Layout. This modern slide helps you outline bios, goals, and key traits using labeled icons, progress bars, and a visual profile section. Ideal for marketing teams, persona development, and product targeting. Fully editable in PowerPoint, Keynote, and Google Slides.


5 slides
Work Schedule Overview Presentation
Keep your week perfectly organized with this clean and modern layout designed to simplify planning and scheduling. Ideal for presenting weekly goals, tasks, or project timelines, it helps teams stay aligned and productive. Fully customizable and compatible with PowerPoint, Keynote, and Google Slides for effortless professional presentations.


26 slides
Self-Care Tips for Busy Moms Presentation
Embrace the nurturing world of self-care with our beautifully designed presentation template tailored for busy moms! This engaging guide provides essential tips and strategies to help mothers prioritize their well-being amidst their hectic schedules. Featuring a range of stylish and soothing slides, this template covers key areas such as time management, stress relief techniques, and simple self-care routines. The design is infused with calming colors, elegant graphics, and intuitive layouts to keep your audience engaged and motivated. Infographics and charts make complex information easy to digest, while mockups offer practical previews of self-care activities. This template is fully customizable and versatile, fitting various presentation styles and needs. It is compatible with PowerPoint, Keynote, and Google Slides, ensuring seamless and professional presentations on any platform. Ideal for wellness coaches, parenting groups, or any busy mom looking to enhance her self-care practices.


26 slides
Thadd Presentation Template
Thadd presents your business in a professional light. The bold fonts and colors make for a clean, professional aesthetic that won't distract from your message. It features a strong horizontal identity that instantly communicates your brand. Charts, timelines and easy to edit text give this template an edge over the competition. It comes with easy to edit text and images, making changing content a breeze. It makes for a great business tool for companies who want to get their message across without wasting time on graphics and design. Invest in your future and download this template today.


6 slides
Branching Structure Tree Chart Presentation
Visualize ideas, processes, or team structures with the Branching Structure Tree Chart Presentation. This elegant tree diagram layout allows you to display six key points or stages branching out naturally from a central concept. Ideal for organizational charts, decision flows, or brainstorming visuals. Fully editable in PowerPoint, Keynote, and Google Slides.


6 slides
Real Estate and Building Development
Visualize the complete property development process with this modern, keyhole-inspired presentation design. Ideal for real estate developers, architects, and construction planners, this slide clearly outlines six project stages—from concept to completion—using bold icons and a radial layout. Editable in PowerPoint, Keynote, and Google Slides.


20 slides
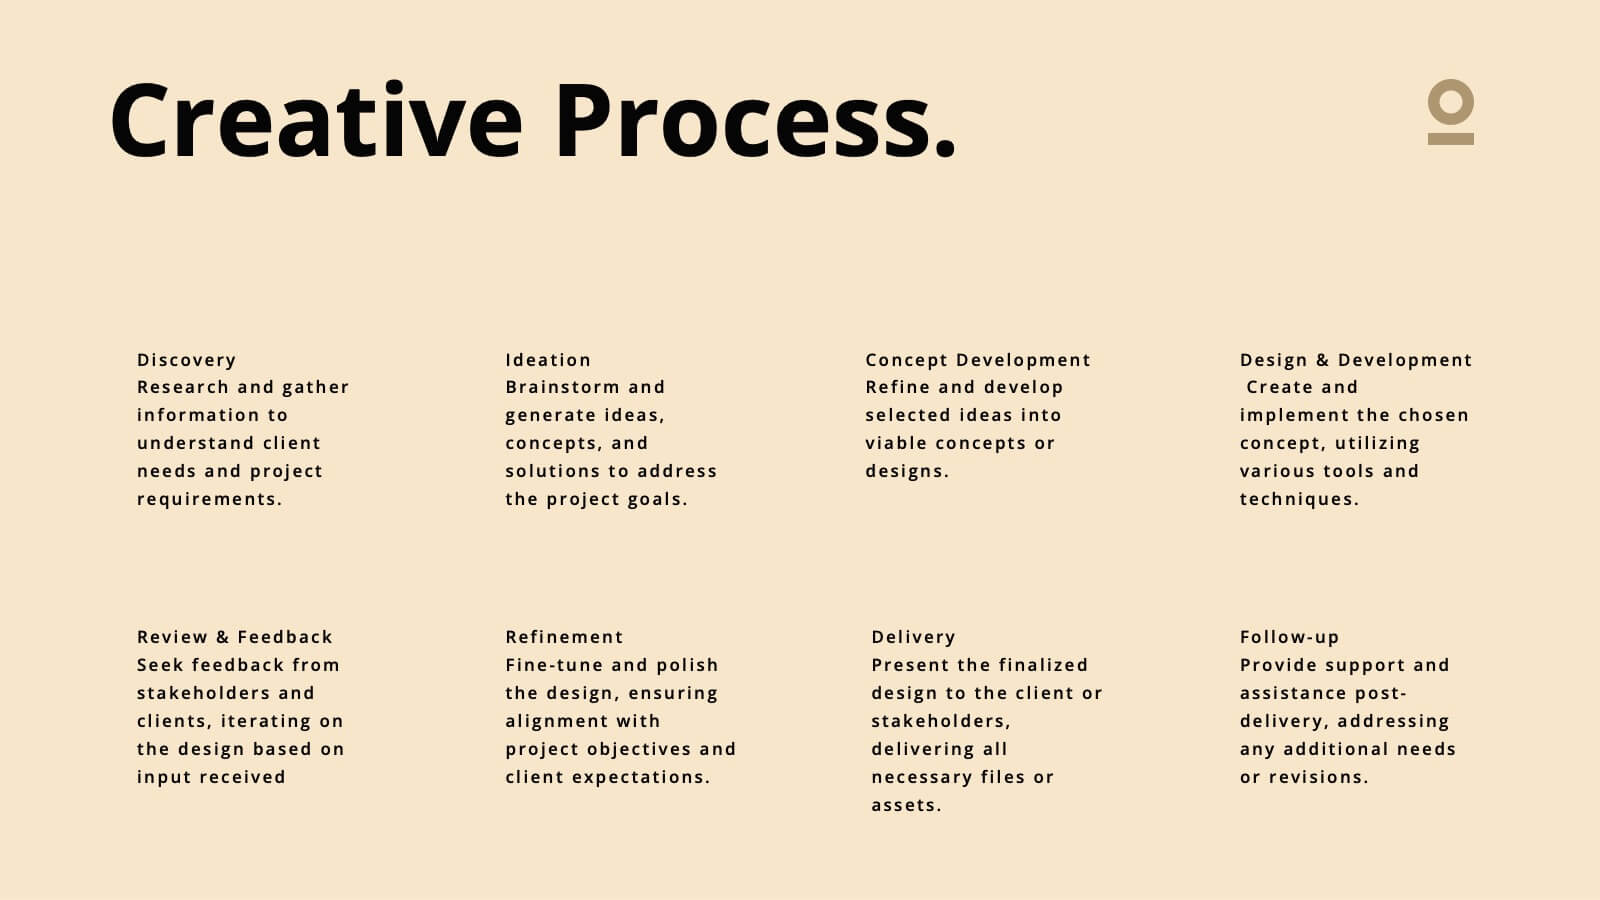
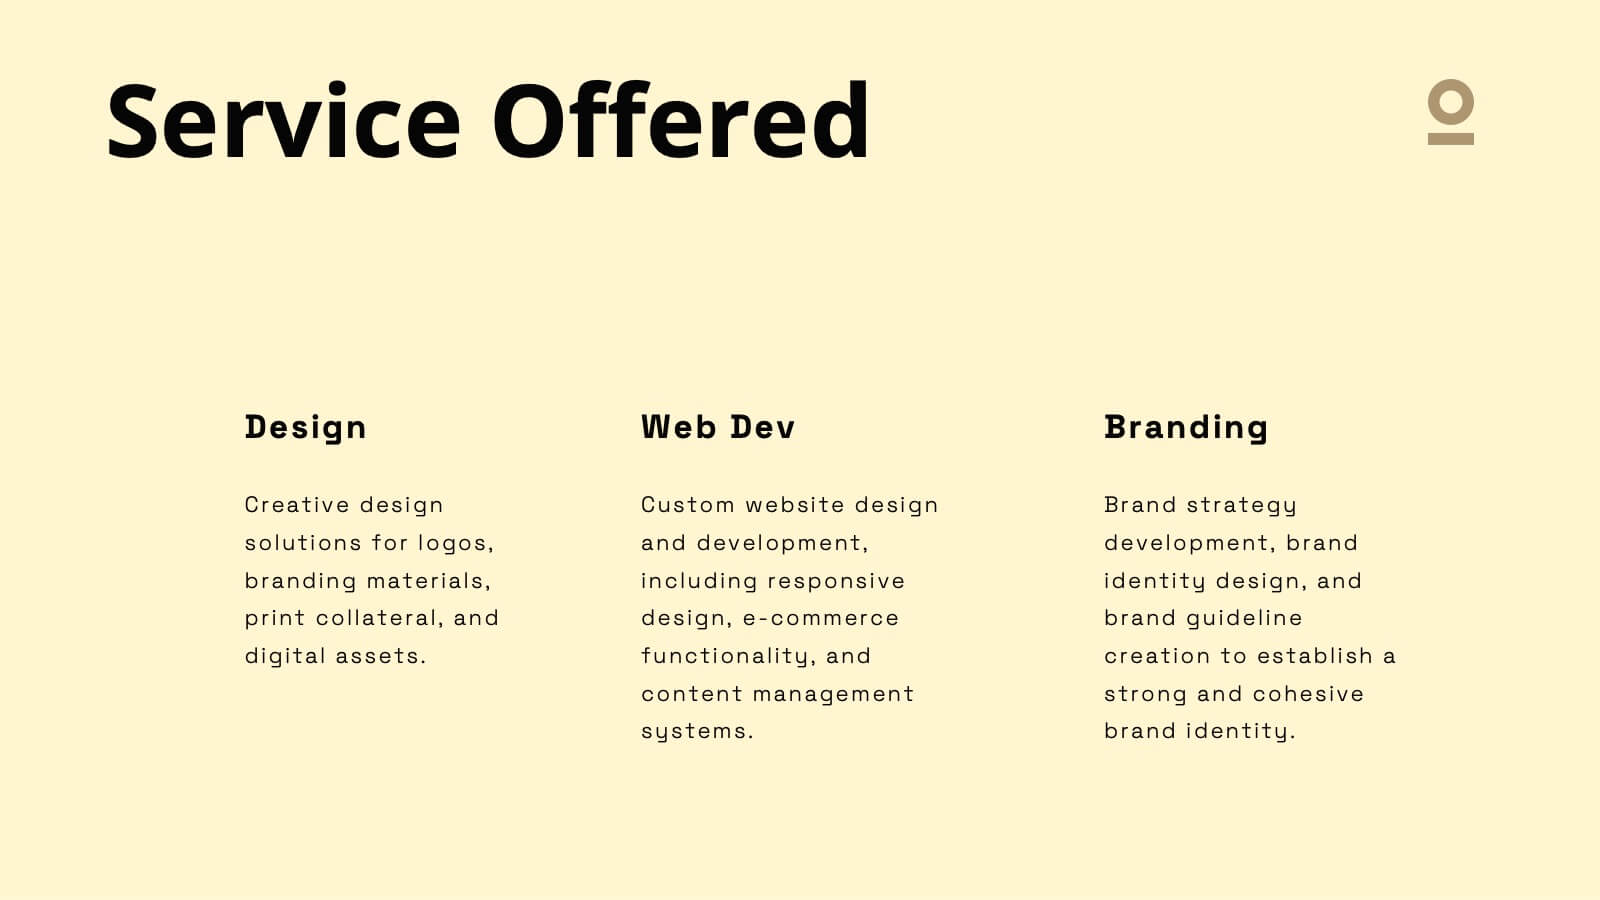
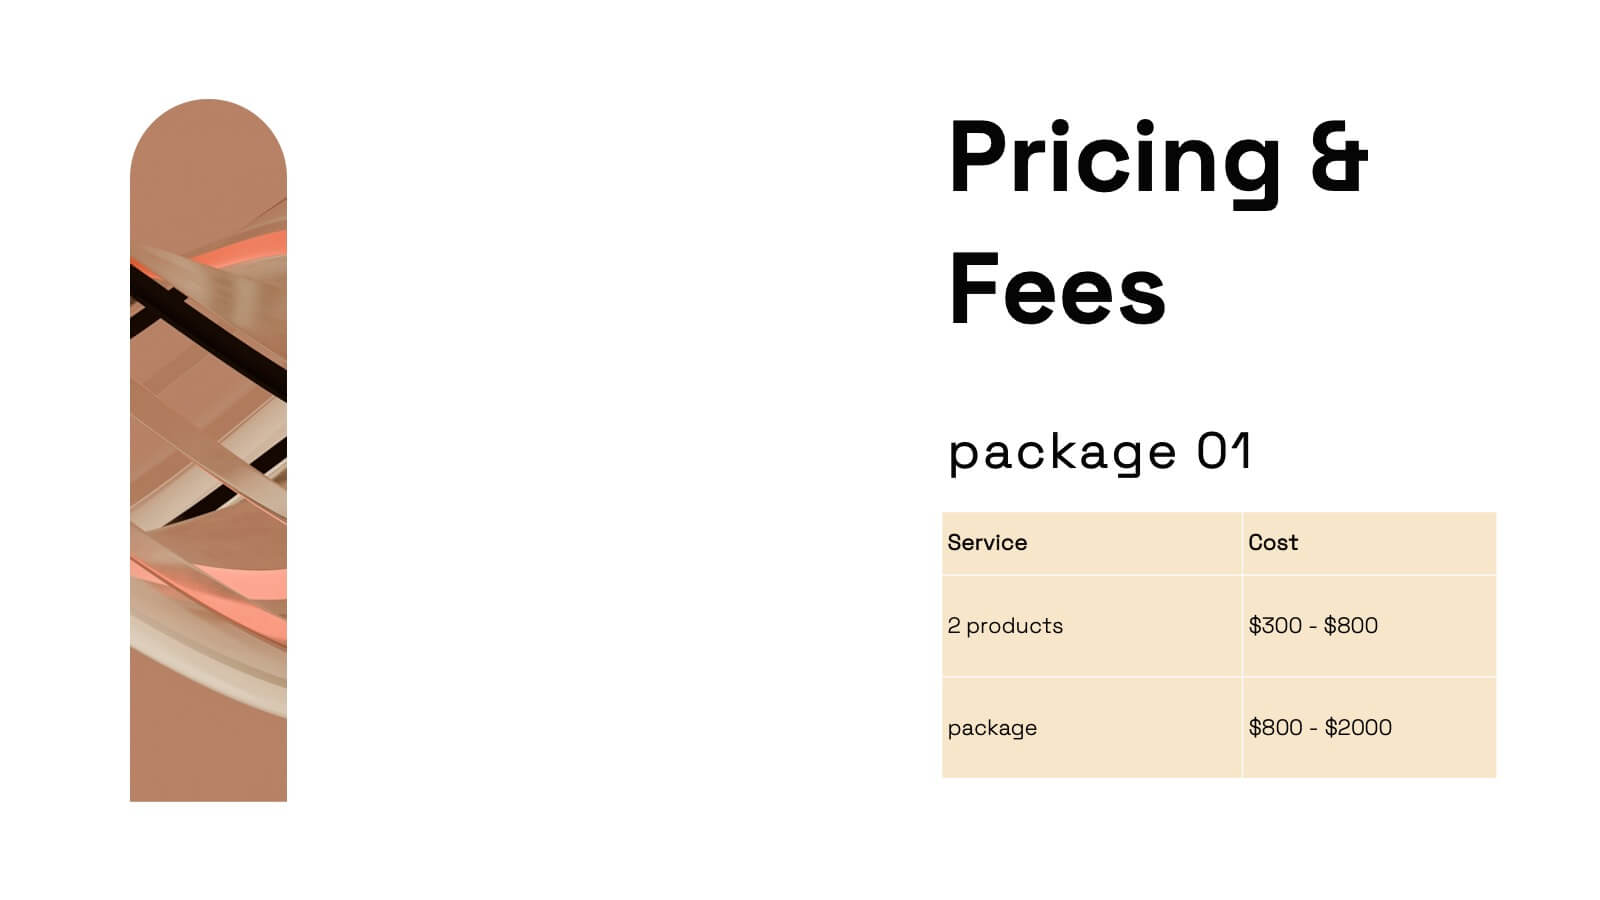
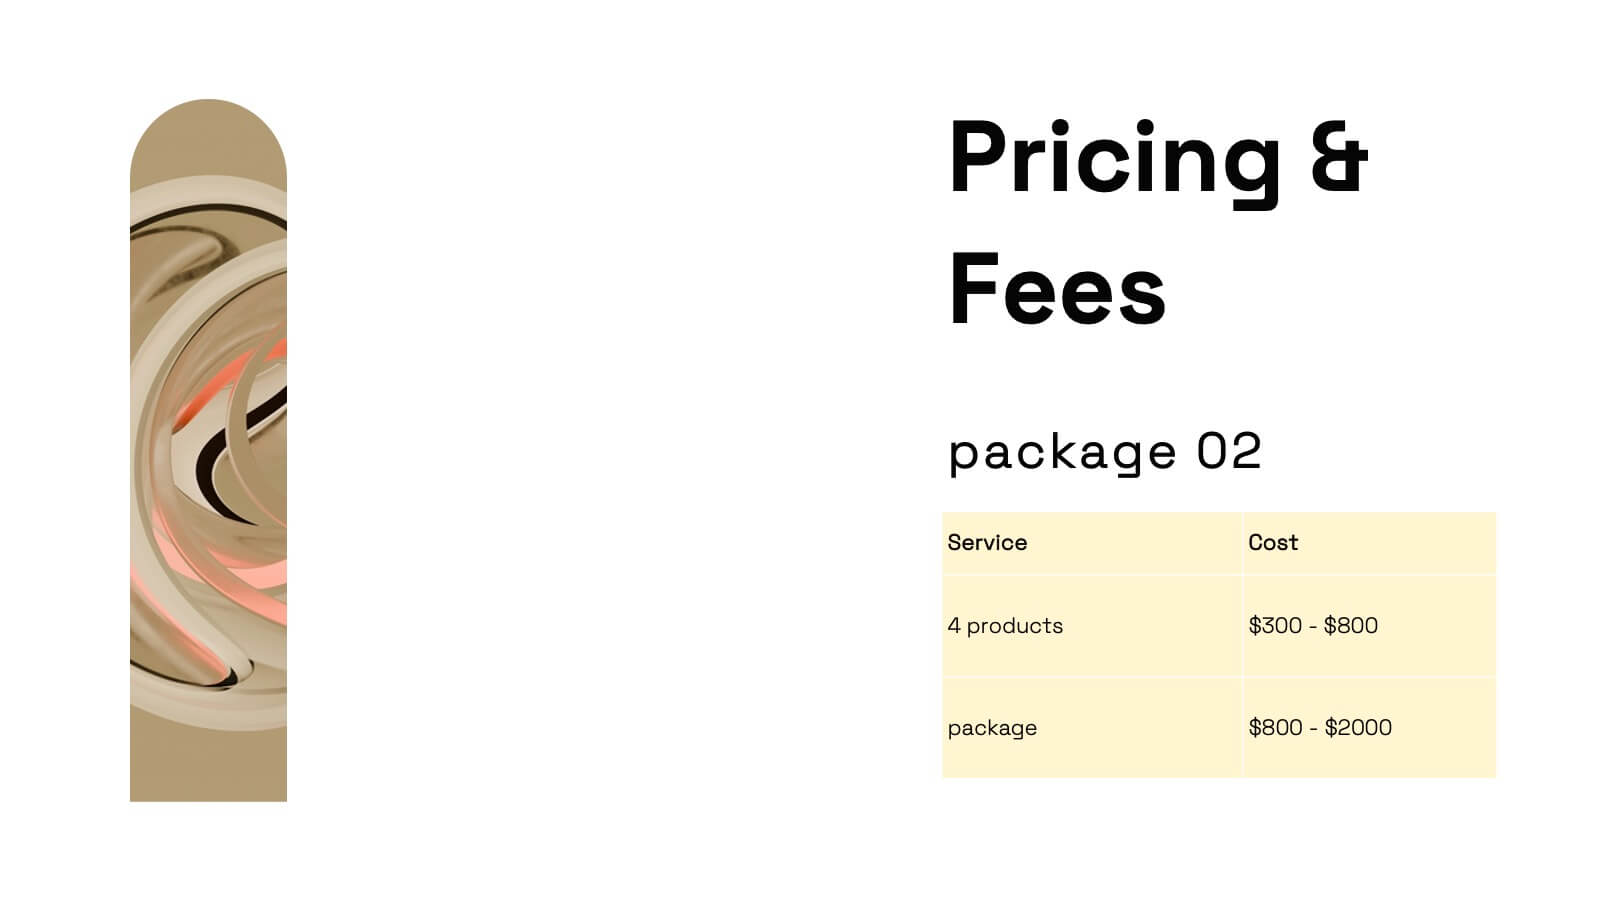
Creative Agency Presentation
Showcase your agency’s capabilities with the Magic Coat Creative Agency template. It features slides detailing team introductions, service overviews, case studies, and more. Ideal for creative agencies aiming to impress potential clients, this template supports PowerPoint, Keynote, and Google Slides, enhancing your presentation's professional appeal.


21 slides
Haze Professional Portfolio Showcase Presentation
Elevate your professional presence with this stunning haze-inspired presentation template! Ideal for showcasing your portfolio, it beautifully highlights your skills, projects, and achievements with a clean and sophisticated design. This template ensures your work stands out, captivating potential clients and employers. Compatible with PowerPoint, Keynote, and Google Slides.


21 slides
Kinetic Startup Funding Proposal Presentation
Get ready to impress potential investors with the Kinetic Startup Funding Proposal template! This dynamic and modern template is designed to help you present your startup's vision, mission, and growth potential in the most compelling way possible. From introducing your team and services to highlighting your unique value proposition and business model, every slide is crafted to showcase your startup's strengths. The template includes sections for market analysis, customer needs, and pain points, ensuring your presentation is data-driven and focused on solving real problems. With slides dedicated to your marketing strategy, sales channels, and financial overview, you can provide a comprehensive plan for success. The sleek design, combined with easy-to-edit slides, allows you to customize the presentation to reflect your startup's brand identity. Whether you're pitching to angel investors or venture capitalists, the Kinetic Startup Funding Proposal template will help you stand out and secure the funding you need. Compatible with PowerPoint, Keynote, and Google Slides, this template is your key to delivering a winning pitch.


5 slides
Team Collaboration Goals Presentation
Bring your teamwork vision to life with a clean, engaging layout that makes every goal feel clear and achievable. This presentation helps you outline priorities, align roles, and highlight shared milestones in a visually balanced format. Perfect for project kickoffs or planning sessions. Fully compatible with PowerPoint, Keynote, and Google Slides.


30 slides
Fusoria Brand Guidelines Proposal Presentation
Build a strong and cohesive brand identity with this sleek and professional brand guidelines proposal presentation. Covering essential topics like typography, color palettes, visual direction, and branding principles, this template helps you define and communicate your brand’s essence. Fully customizable and compatible with PowerPoint, Keynote, and Google Slides for a seamless presentation experience.


5 slides
Revenue Streams & Expense Management Layout Presentation
Visualize your income and costs with the Revenue Streams & Expense Management Layout Presentation. This slide layout uses a vertical arrow chart to display four data categories, ideal for comparing sources of income and related expenditures. Great for financial reports, budgeting reviews, and strategy discussions. Compatible with Canva, PowerPoint, Google Slides, and Keynote.