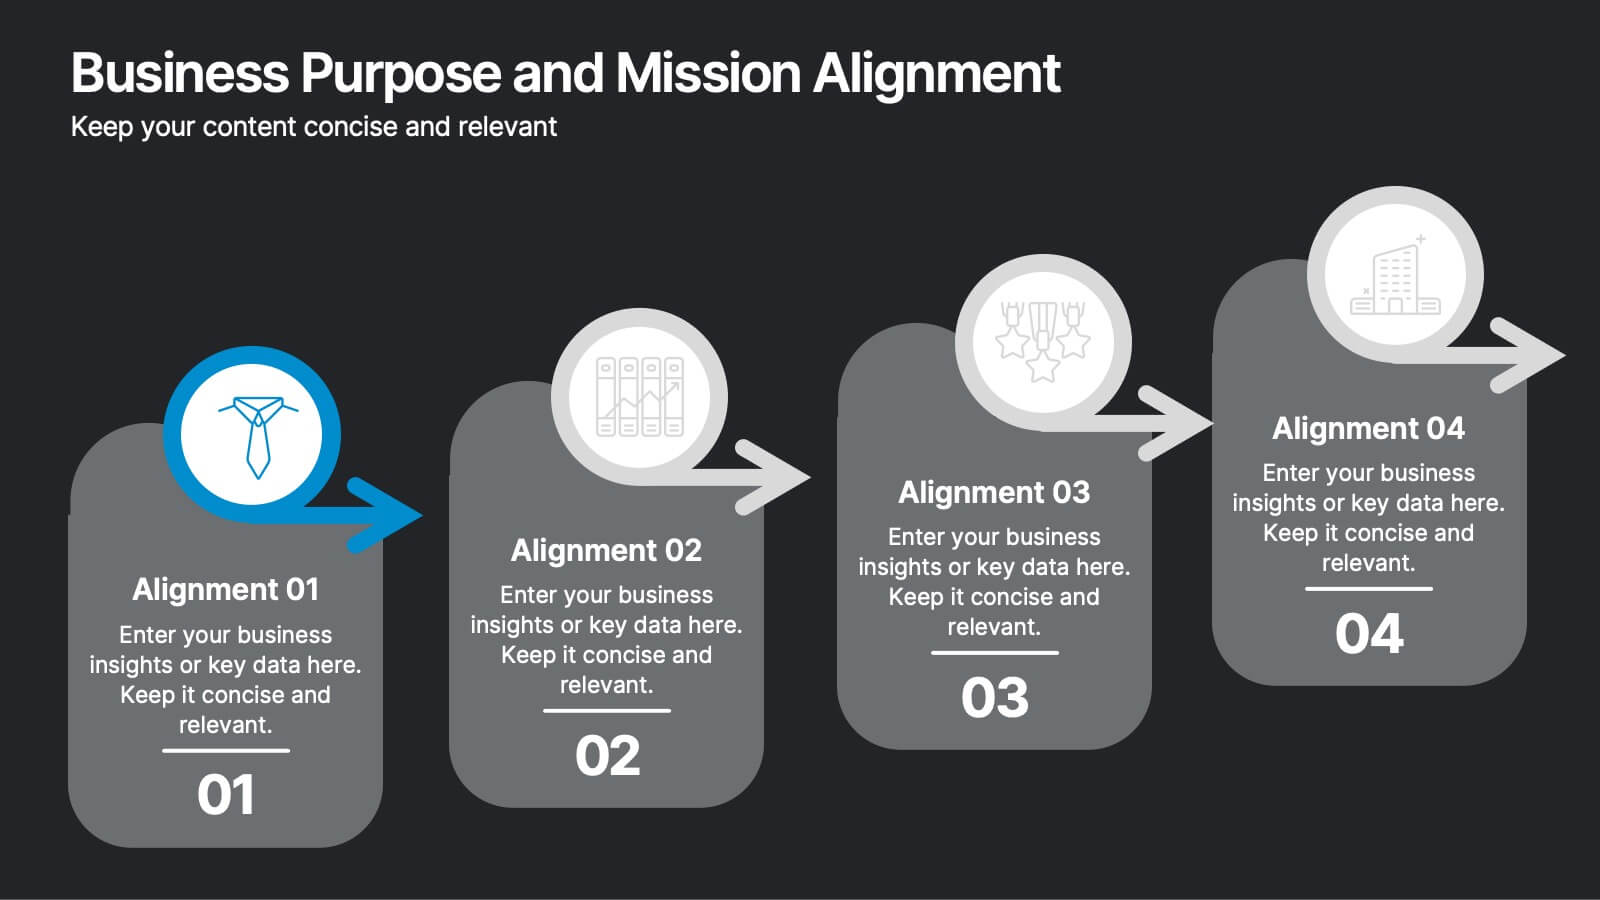
Business Purpose and Mission Alignment Presentation
PowerPoint Template and Google Slides Theme




Features
- 8 Unique slides
- Fully editable and easy to edit in Microsoft Powerpoint, Keynote and Google Slides
- 16:9 widescreen layout
- Clean and professional designs
- Export to JPG, PDF or send by email
- Remove from favorites
Powerpoint Template
1 MB
Google Slides Template
External link
Keynote Template
2 MB
Recommend
- Remove from favorites
Powerpoint Template
1 MB
Google Slides Template
External link
Keynote Template
2 MB
5 slides
Poaching Facts Infographics
Poaching refers to the illegal hunting, capturing, or killing of wildlife, typically for profit or personal gain. These compelling and informative infographic templates are designed to shed light on the issue of poaching and its impact on wildlife and ecosystems. They present key facts, statistics, and illustrations to raise awareness about the seriousness of poaching and the need for conservation efforts. By increasing awareness and understanding of the poaching crisis, these templates contribute to the collective efforts in protecting our precious wildlife and preserving the natural world.
- Remove from favorites
Powerpoint Template
1 MB
Google Slides Template
External link
Keynote Template
2 MB
6 slides
Digital Education and E-Learning Trends Presentation
Present modern educational insights with clarity using this well-structured slide focused on digital learning trends. Featuring an icon-based circular layout around a graduate figure and six editable titles, it's ideal for showcasing online learning strategies, tech tools, and training programs. Designed to keep your content concise and visually engaging, this layout is perfect for educators, institutions, and e-learning professionals. Fully customizable in PowerPoint, Keynote, and Google Slides.
- Remove from favorites
Powerpoint Template
1 MB
Google Slides Template
External link
Keynote Template
1 MB
7 slides
Demographic Infographic Presentation Template
Are you looking for a fun way to engage your audience? This PowerPoint presentation is a great tool for educating individuals on demographic status. This data visualization template is perfect for presentations and marketing materials, allowing you to quickly communicate key demographic details with the help of charts and tables. Use this template to create a visual presentation that highlights the demographic characteristics of your target audience. This template features a colorful design, which provides plenty of space for you to include key facts, figures and conclusions.
- Remove from favorites
Powerpoint Template
1 MB
Google Slides Template
External link
Keynote Template
1 MB
12 slides
Market Analysis PESTEL Presentation
The "Market Analysis PESTEL" presentation efficiently segments essential factors that affect market trends into six categories: Political, Economic, Social, Technological, Environmental, and Legal. Each category is visually represented with a distinct color, allowing easy identification and organization of related data. The layout provides clear placeholders for inserting detailed information, making it a practical tool for presenting comprehensive market analyses. This visual framework supports strategic decision-making by highlighting external factors that might impact business environments.
- Remove from favorites
Powerpoint Template
1 MB
Google Slides Template
External link
Keynote Template
1 MB
4 slides
Corporate Governance Structure Presentation
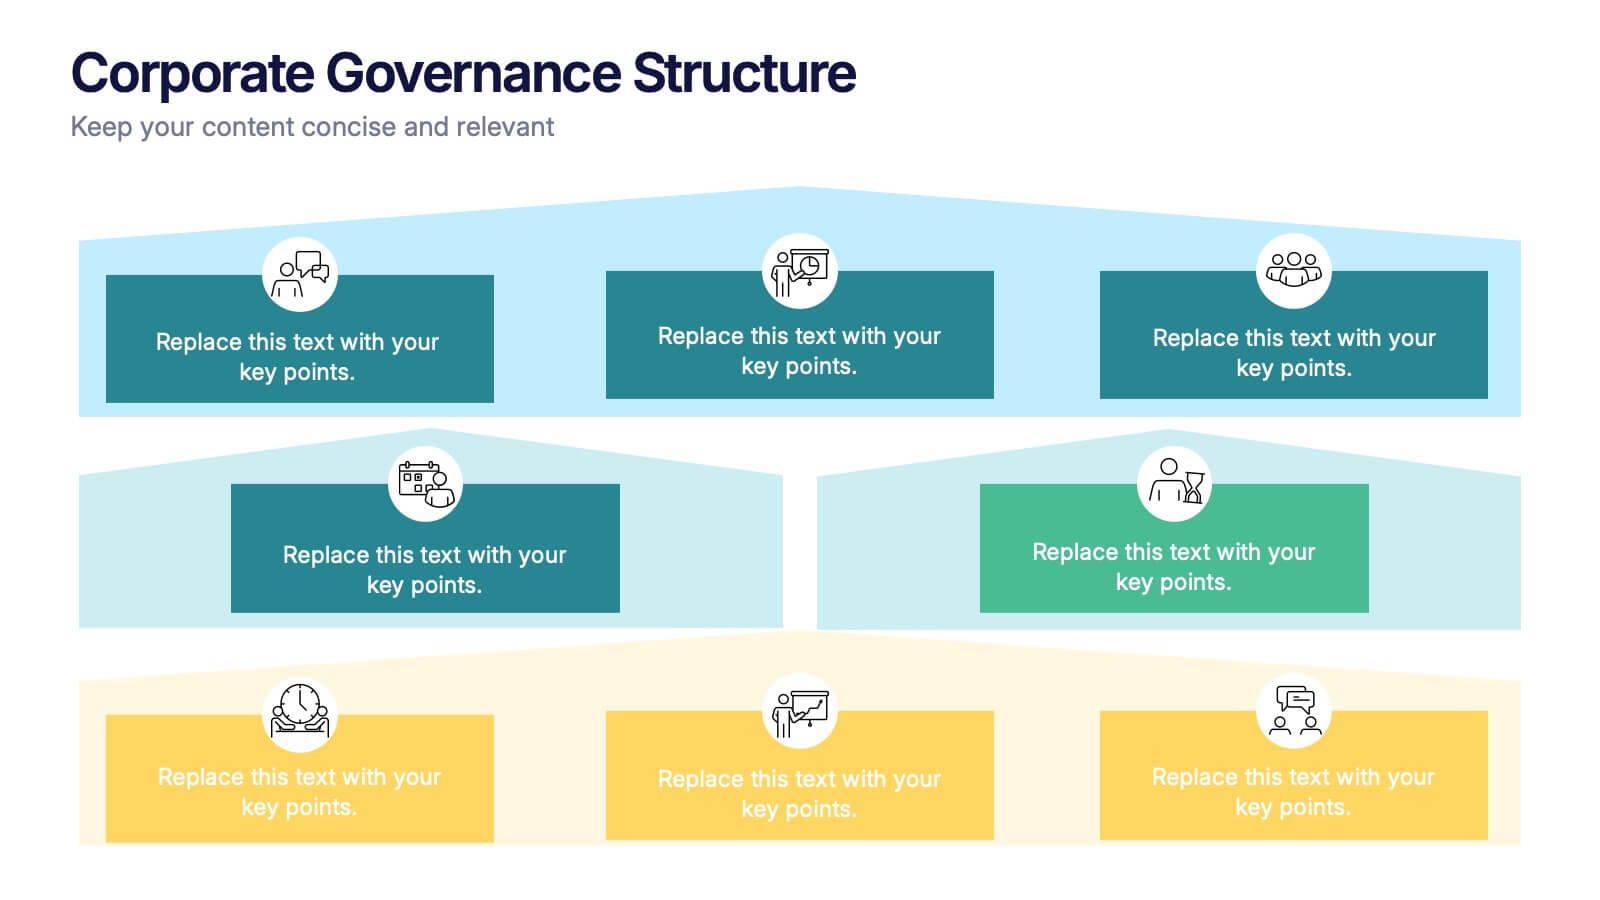
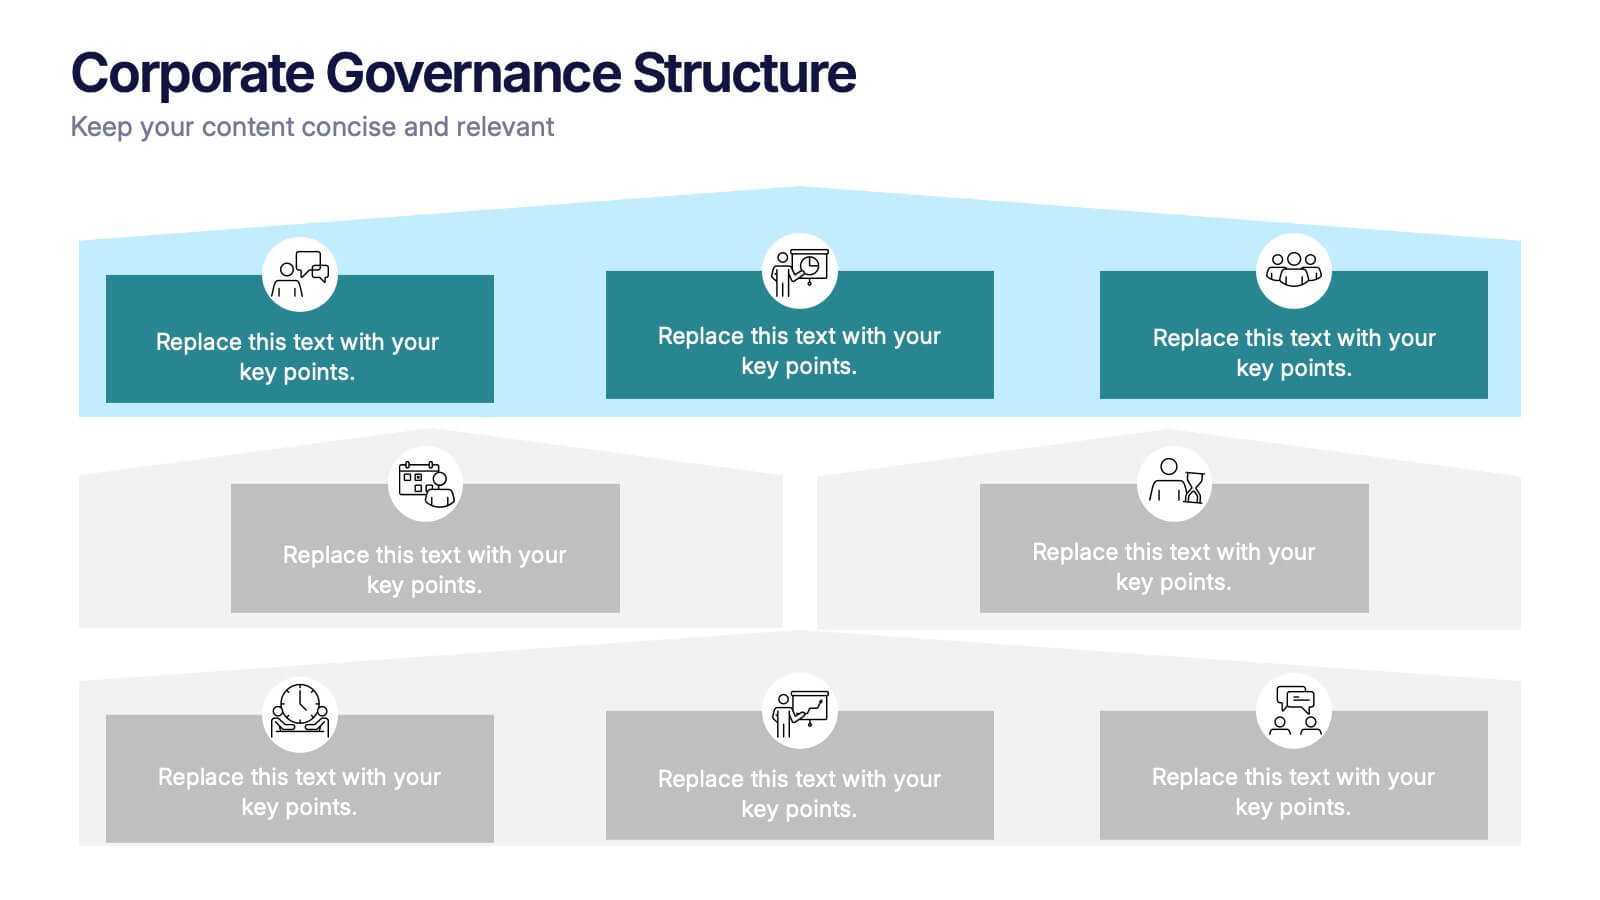
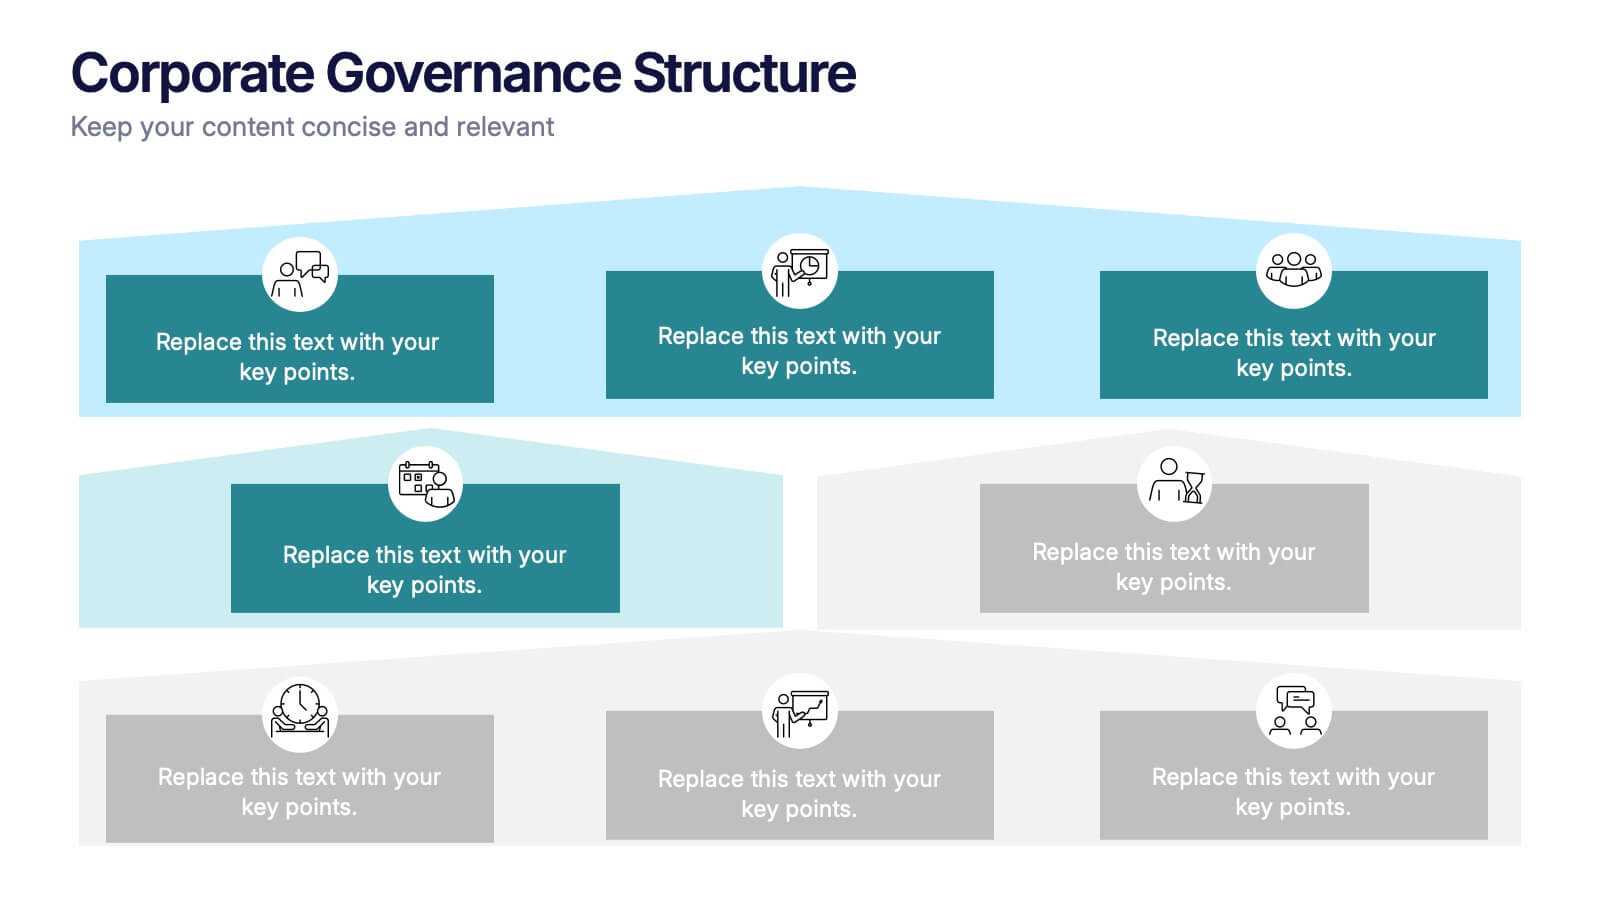
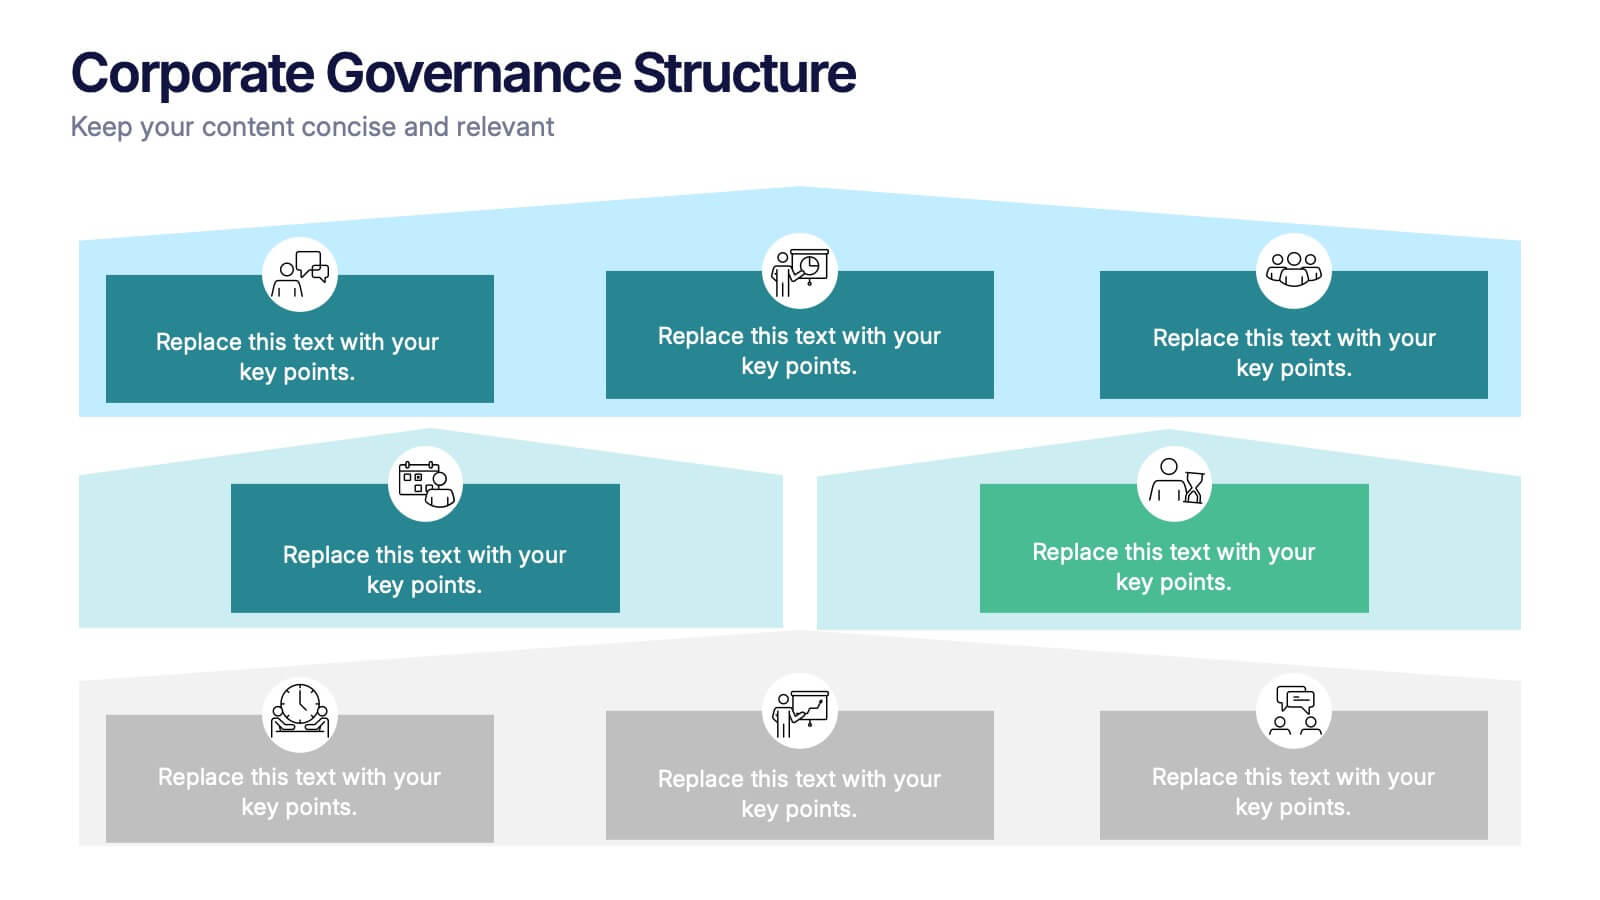
Build transparency and leadership clarity with this clean, layered presentation layout that visualizes company hierarchies and decision-making systems. Ideal for explaining organizational roles, responsibilities, and reporting flows, it simplifies complex structures into easy visuals. Fully editable and compatible with PowerPoint, Keynote, and Google Slides for professional, flexible use.
- Remove from favorites
Powerpoint Template
1 MB
Google Slides Template
External link
Keynote Template
2 MB
6 slides
Modern Agriculture Industry Trends
Highlight key data and insights with this visually engaging agriculture-themed slide. Designed with circular data visuals and crop illustrations, it's perfect for showcasing percentages, trends, or growth stats in modern farming, agri-tech, and sustainability initiatives. Fully editable in PowerPoint, Keynote, and Google Slides.
- Remove from favorites
Powerpoint Template
1 MB
Google Slides Template
External link
Keynote Template
1 MB
6 slides
Community Network Infographic
A community network is a localized, often root-driven, communication infrastructure that connects individuals, organizations, and institutions within a specific geographical area or community. This Infographic template visually represents the connections, relationships, and interactions within a community, often focusing on its members, resources, and activities. This template is a powerful way to showcase the dynamics and vitality of a community. This highlights the central theme or purpose of the community at the center of the infographic. This is fully customizable and compatible with Powerpoint, Keynote, and Google Slides.
- Remove from favorites
Powerpoint Template
1 MB
Google Slides Template
External link
Keynote Template
1 MB
7 slides
Milestones Infographic Presentation Template
Our milestones infographic template includes a professional background and imagery to create a high-quality presentation that’s sure to grab your audience’s attention. This template is full of visual and engaging elements that will draw your audience in. It's a great starting point to make your own presentation, or to use as a template for future presentations. All slides are fully editable in PowerPoint so you can add and change text and images as desired, It's very easy to edit and customize the shapes and colors. Use this high-resolution template to present your topic in a professional way!
- Remove from favorites
Powerpoint Template
1 MB
Google Slides Template
External link
Keynote Template
1 MB
8 slides
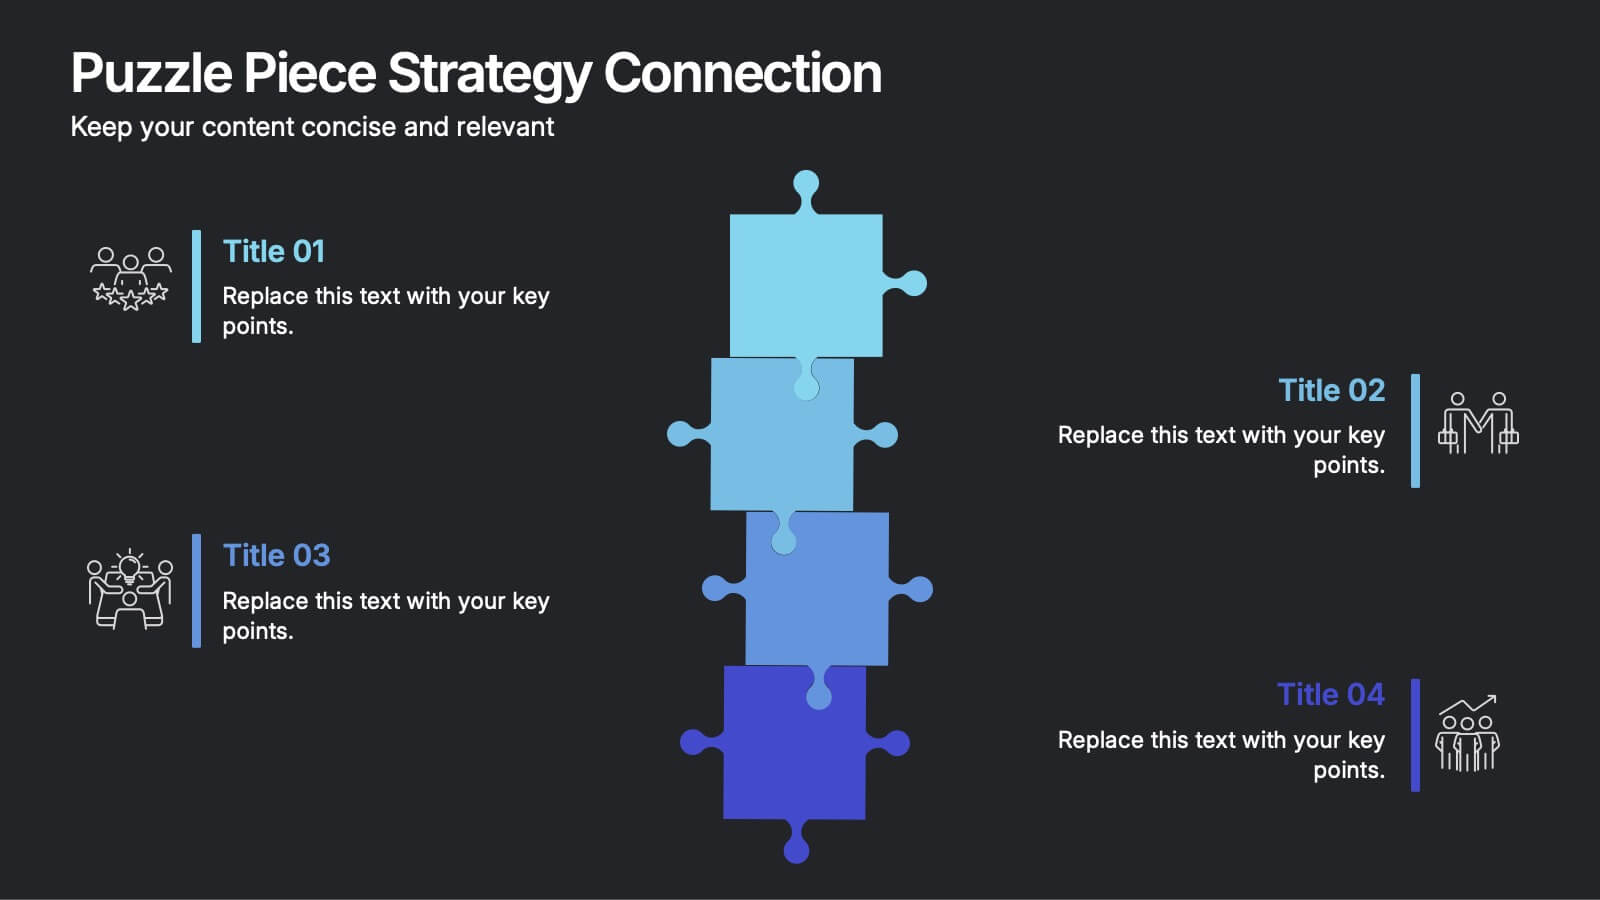
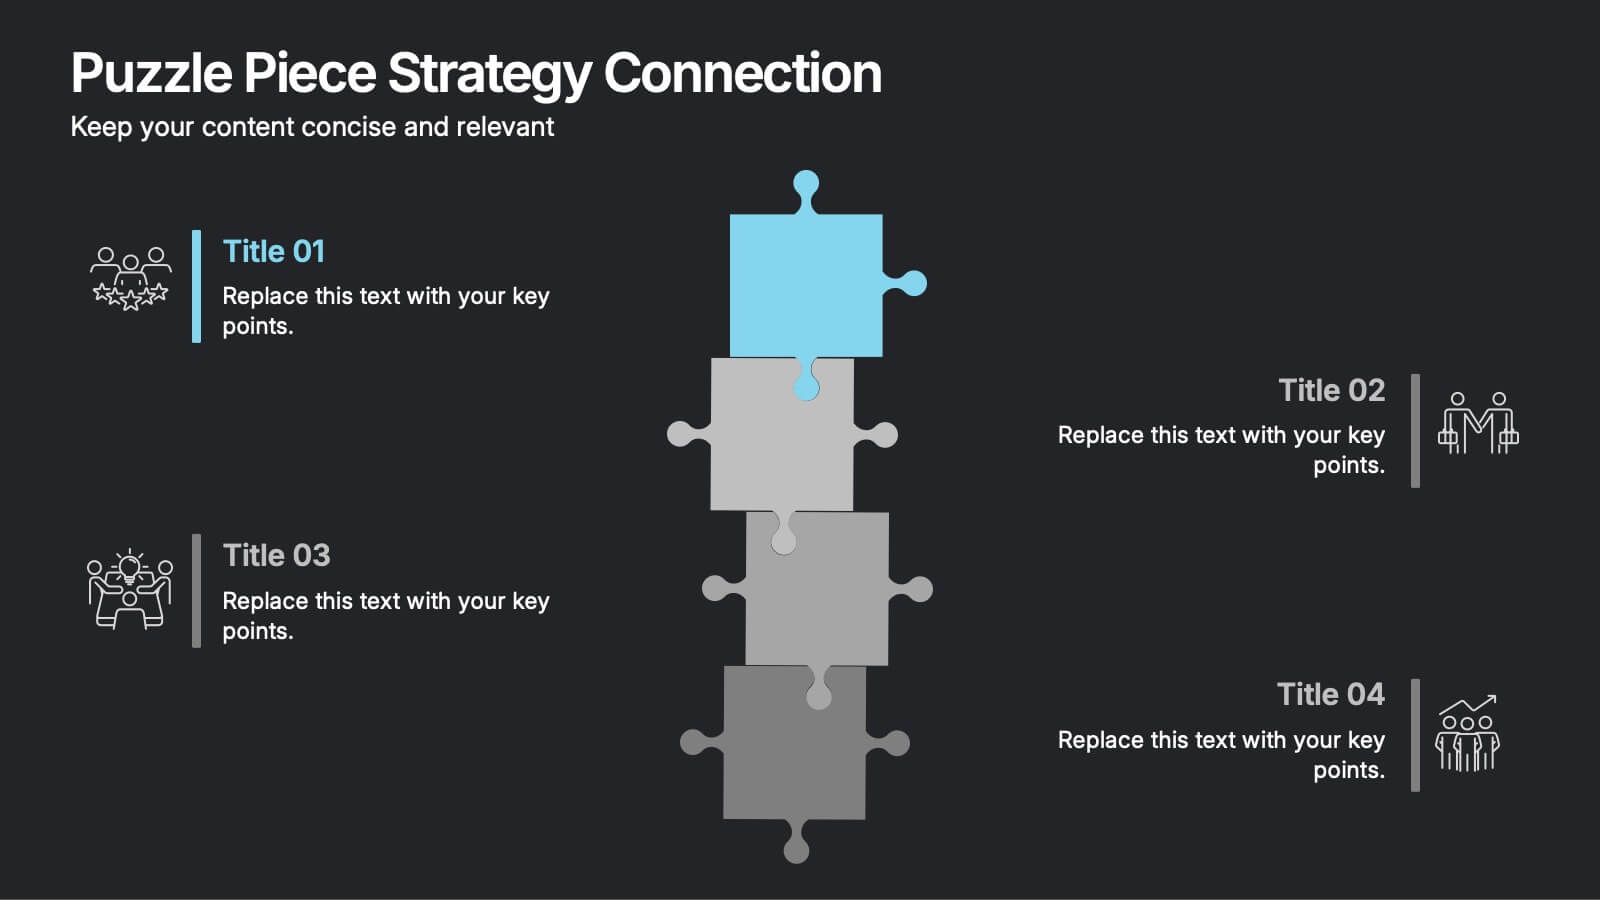
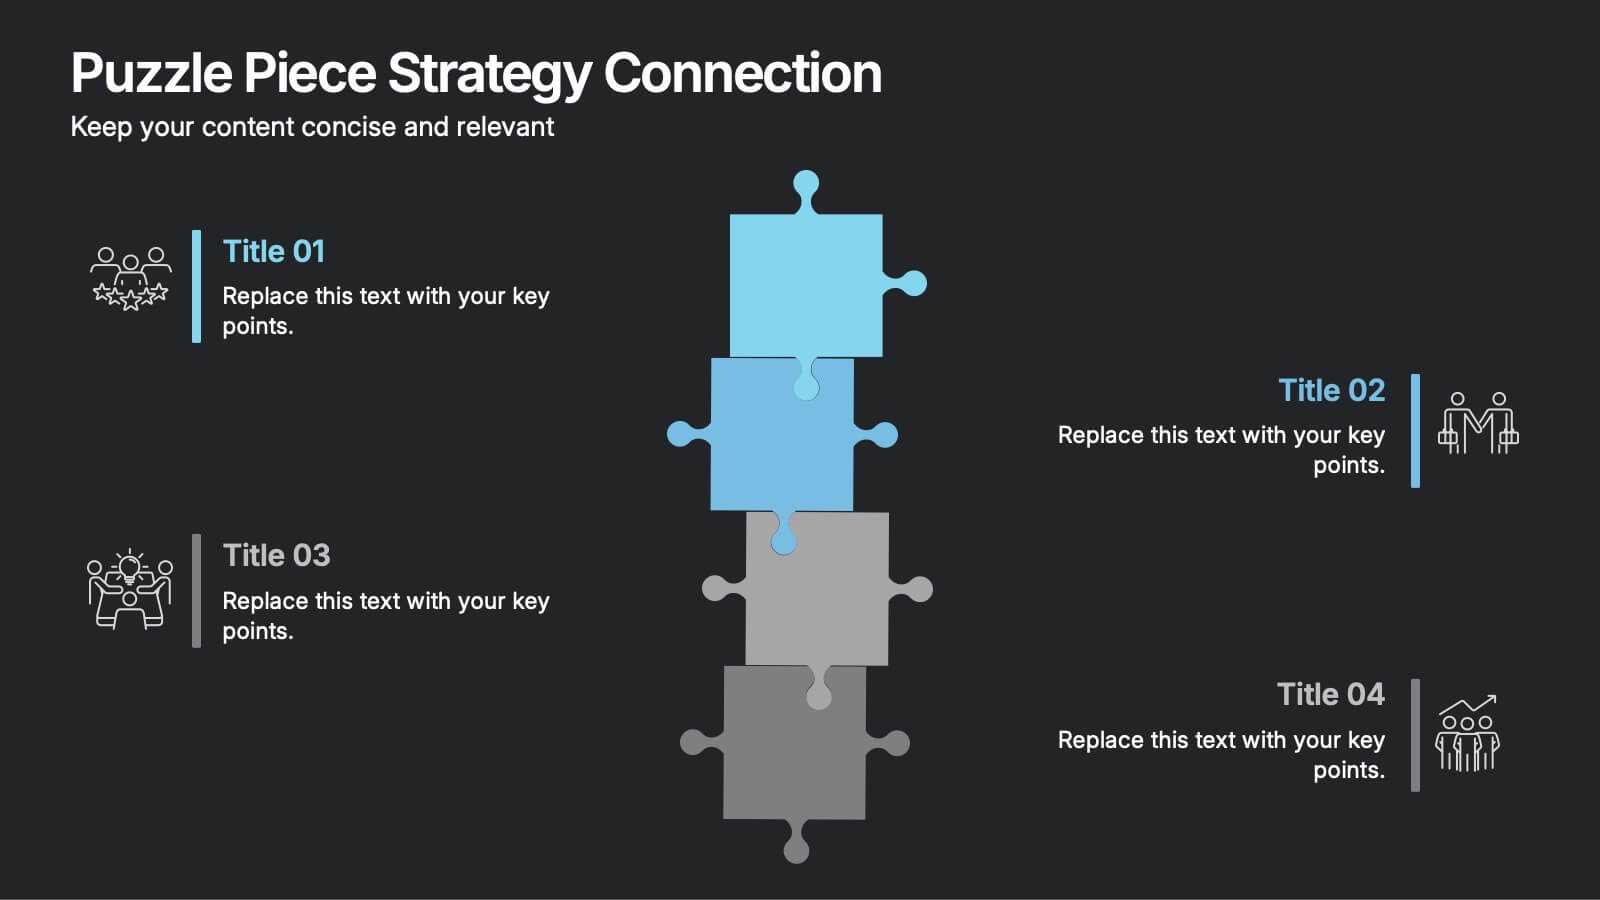
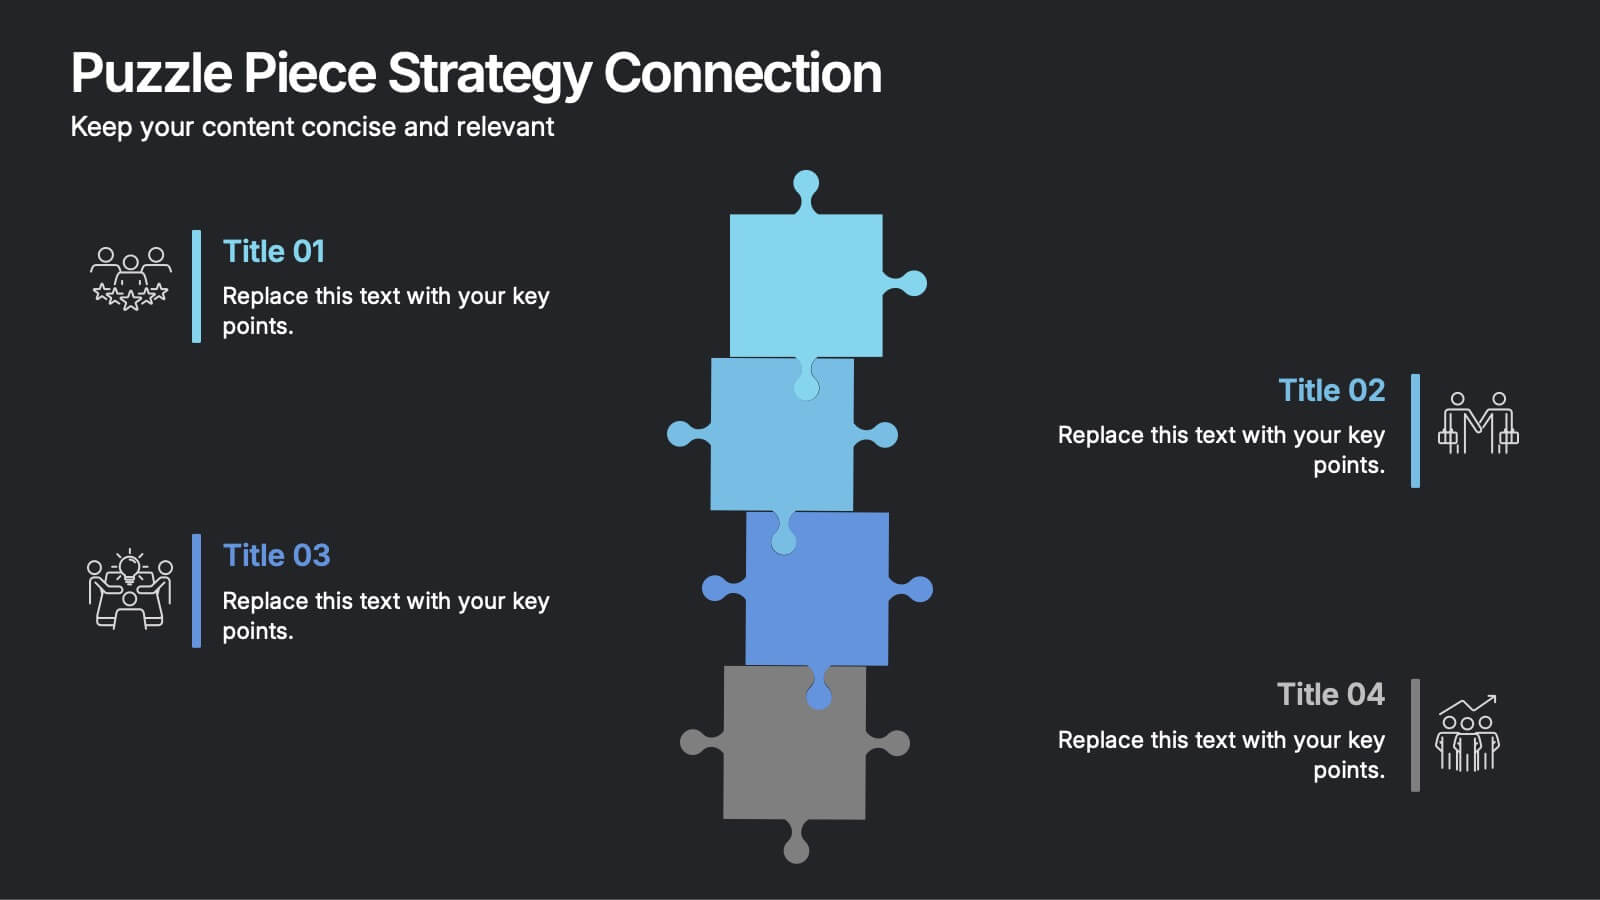
Puzzle Piece Strategy Connection Presentation
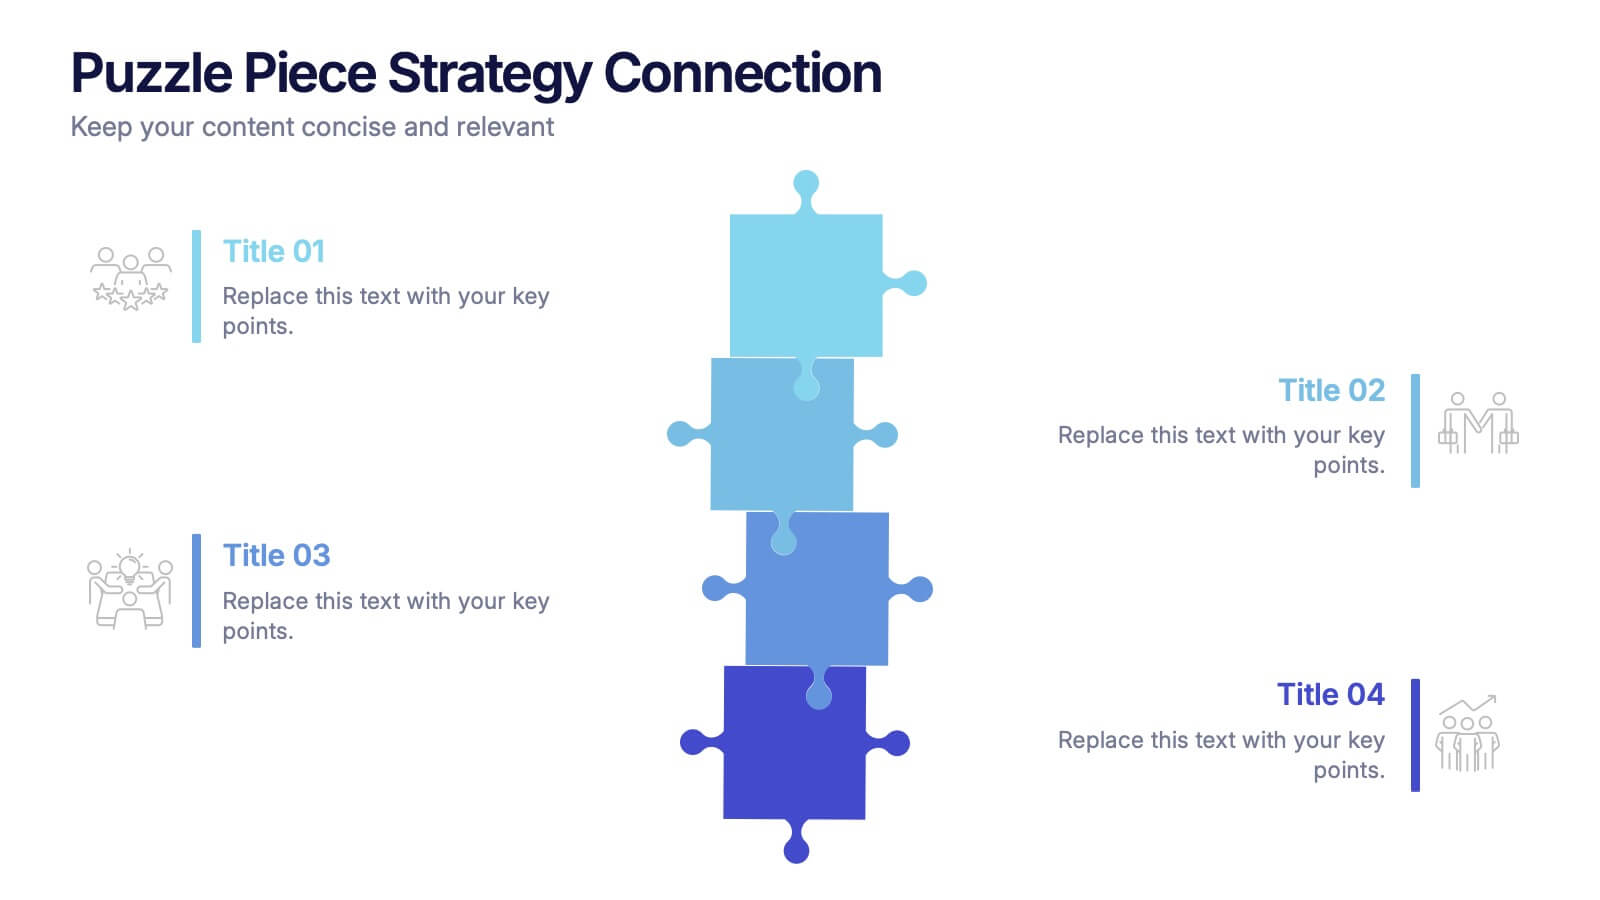
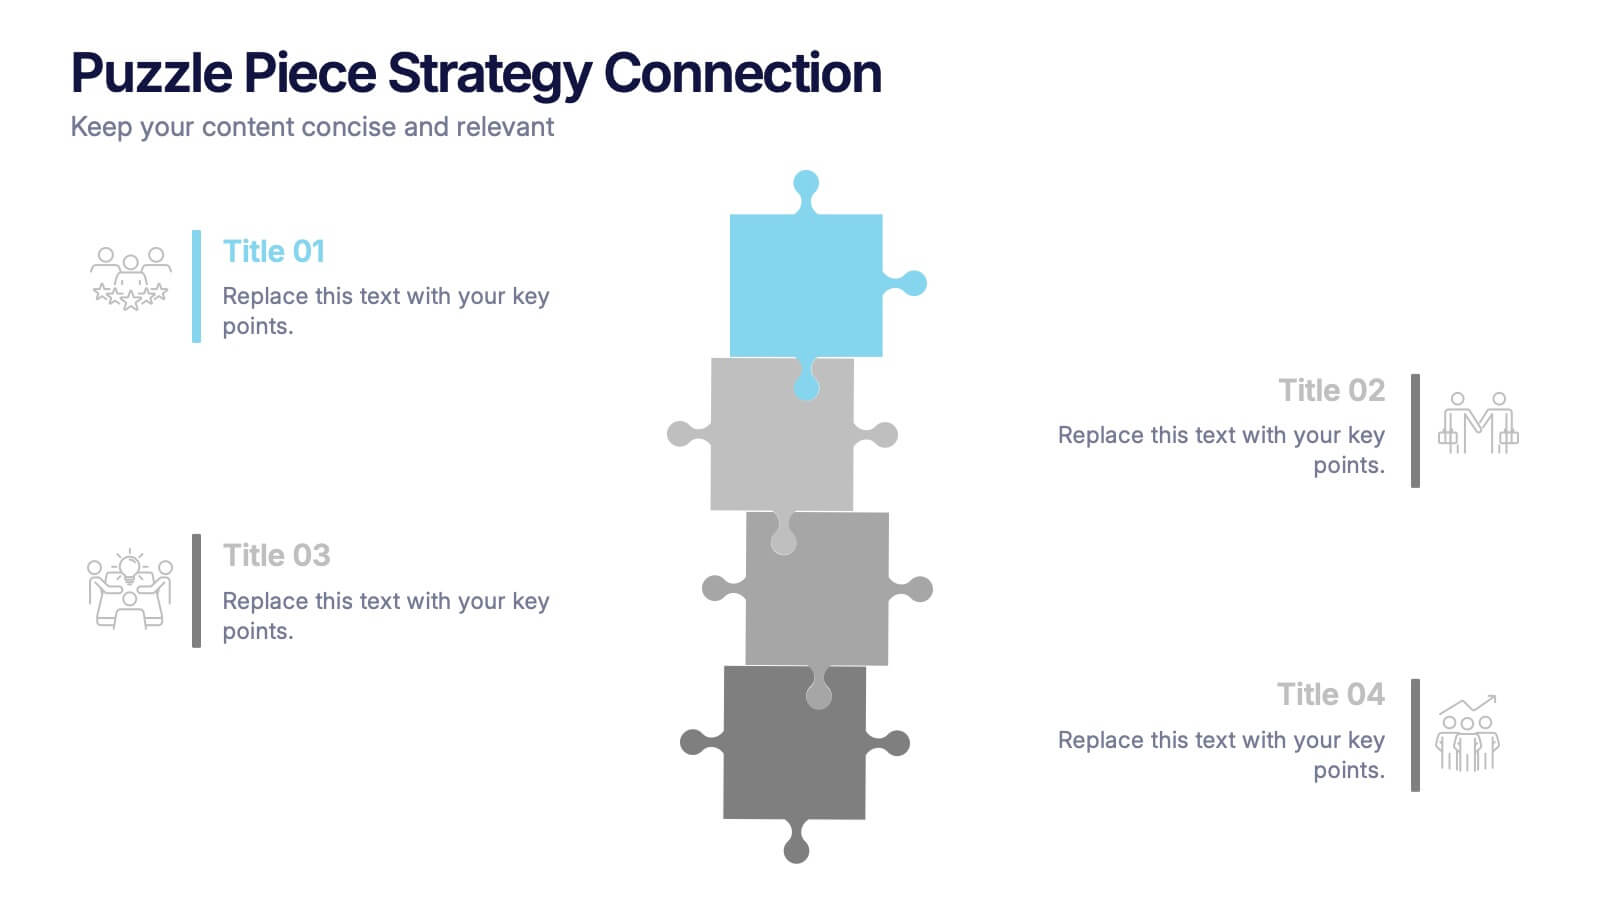
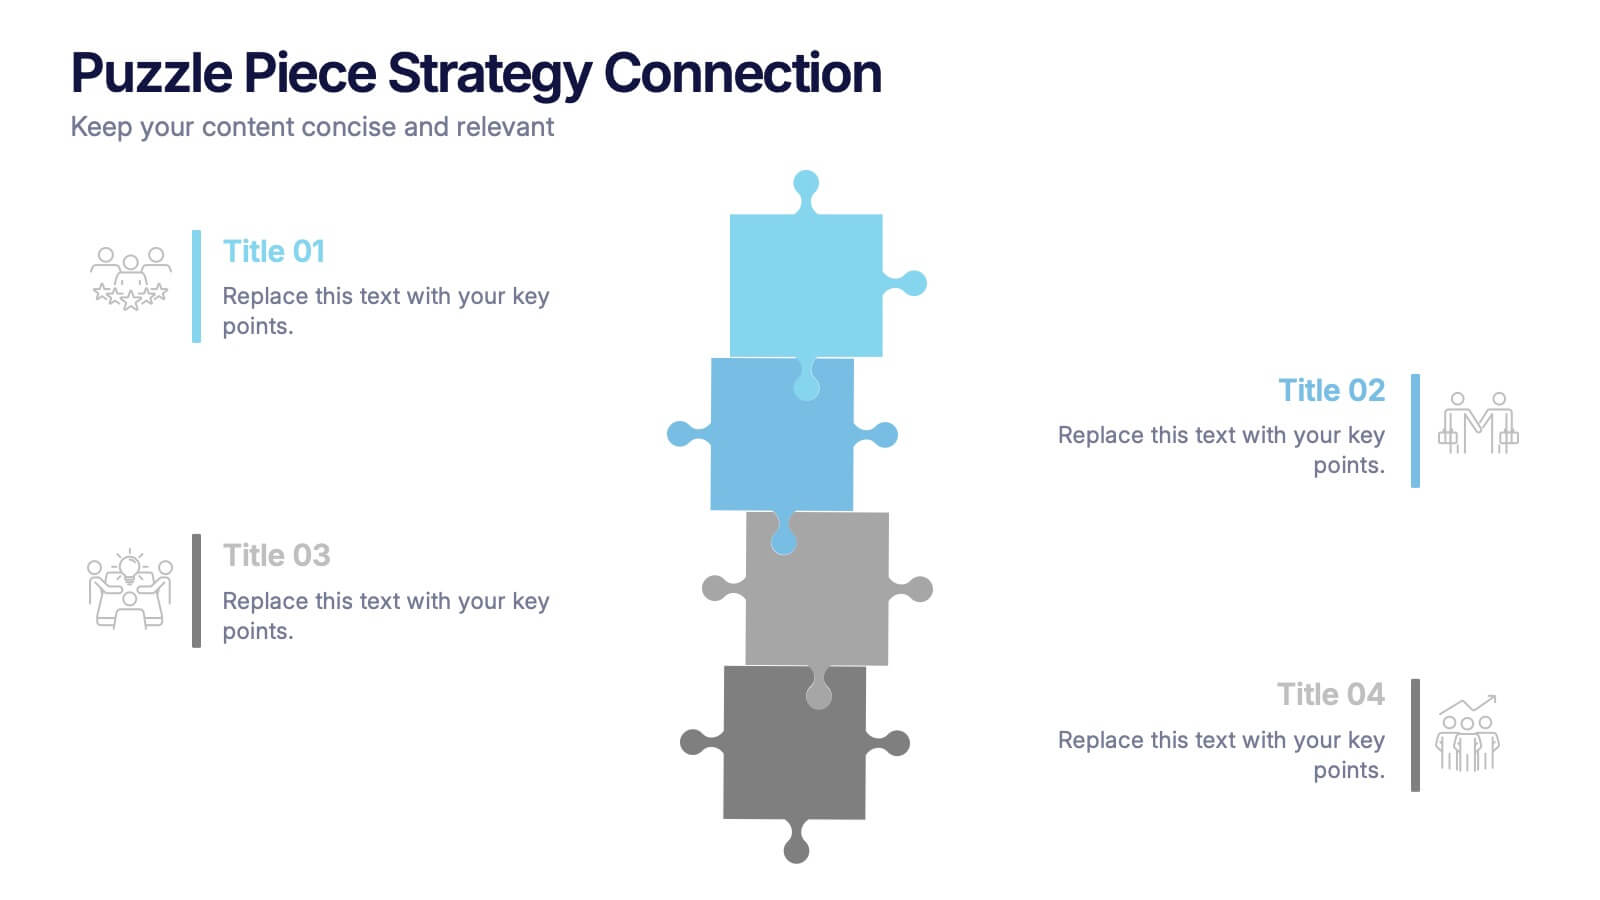
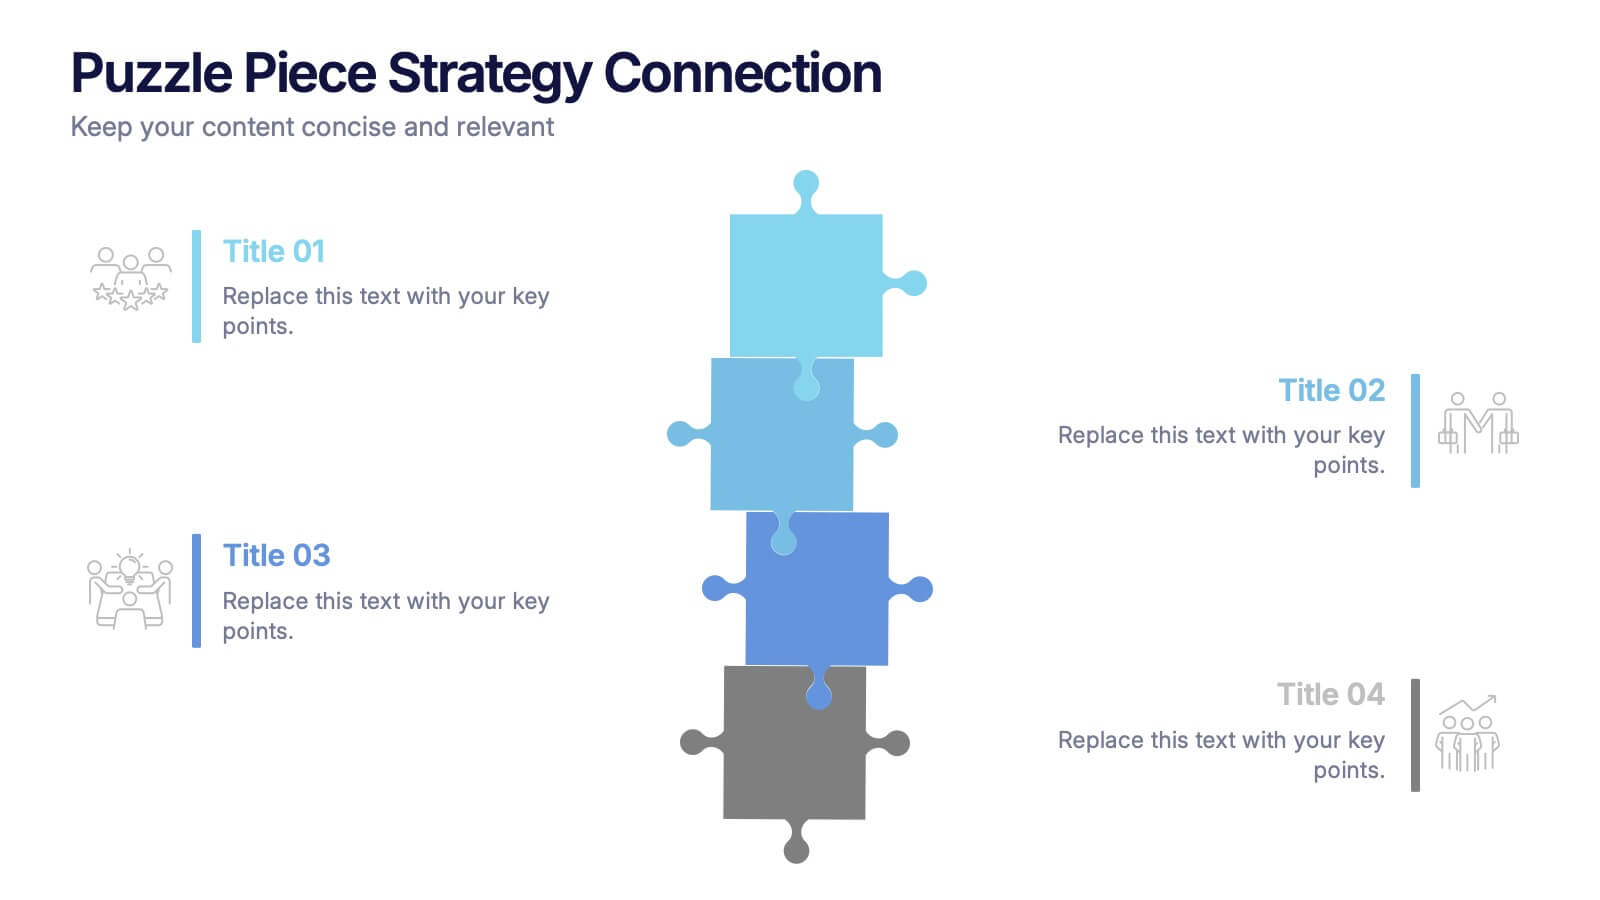
Align your ideas with clarity using the Puzzle Piece Strategy Connection Presentation. This vertical puzzle layout visually connects four key steps, making it perfect for illustrating strategy alignment, workflow processes, or integrated systems. Easily editable in PowerPoint, Canva, or Google Slides—ideal for team briefings or strategic roadmaps.
- Remove from favorites
Powerpoint Template
1 MB
Google Slides Template
External link
Keynote Template
1 MB
6 slides
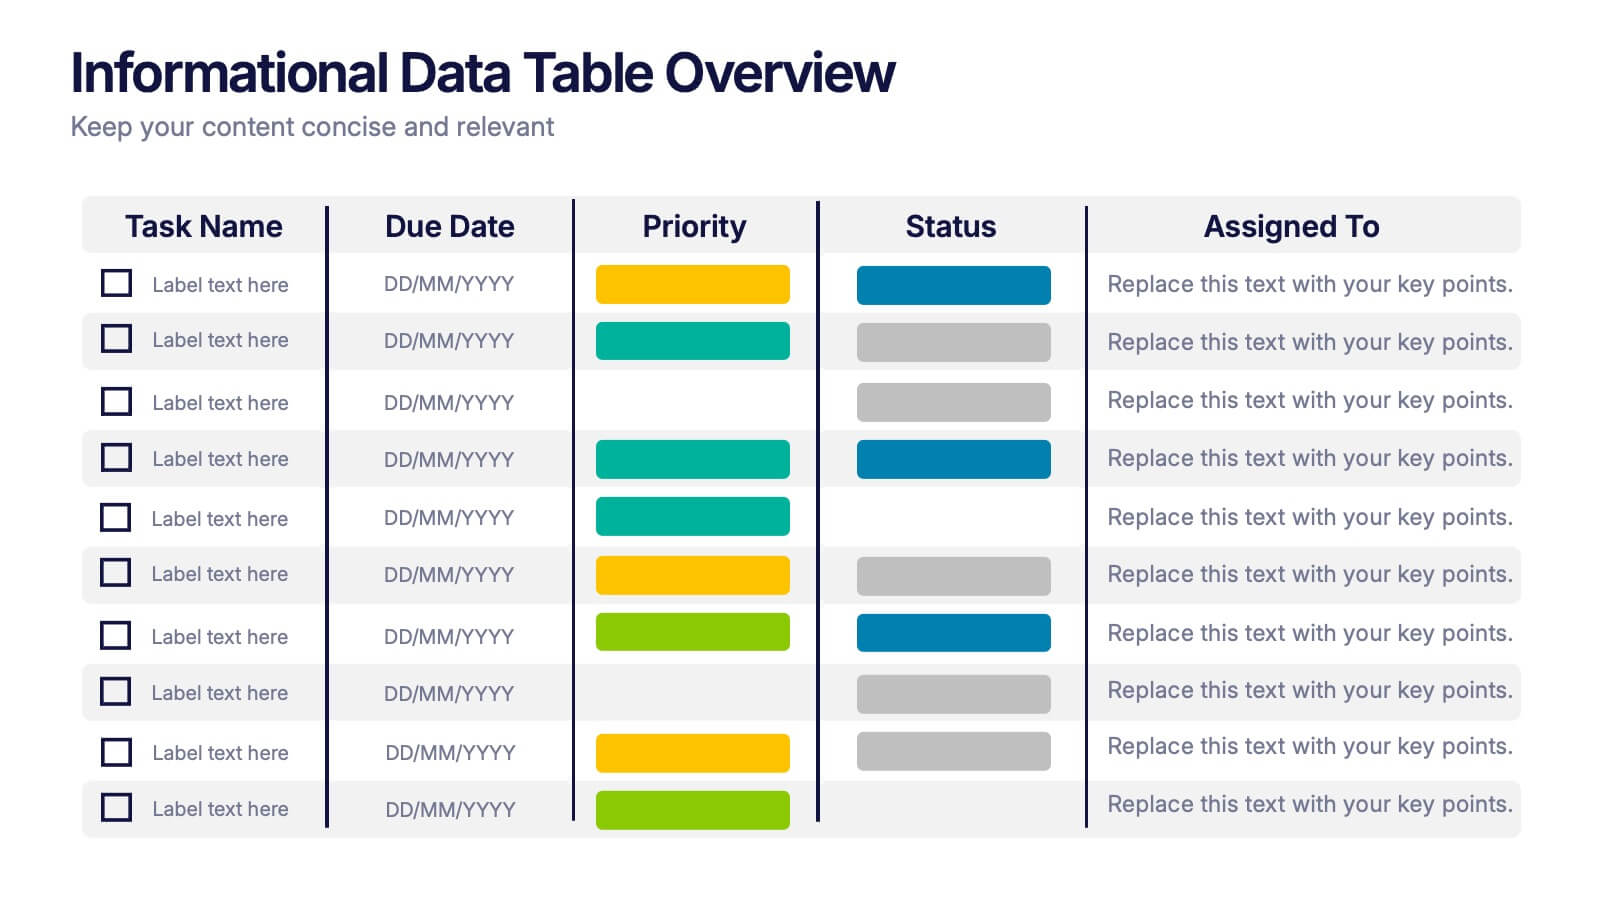
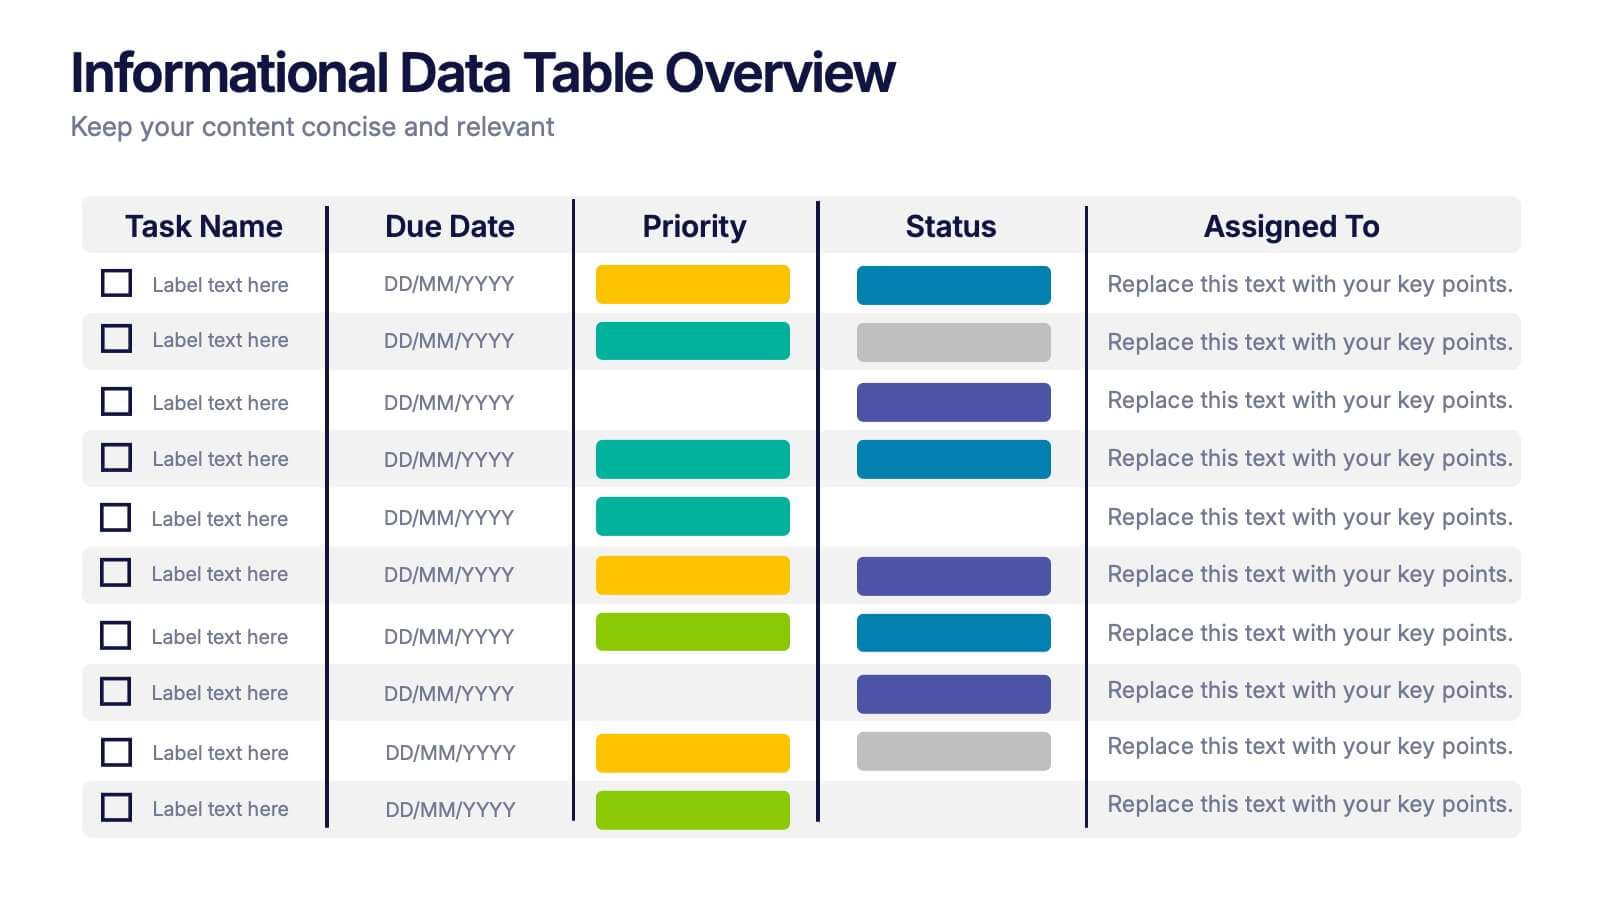
Informational Data Table Overview Presentation
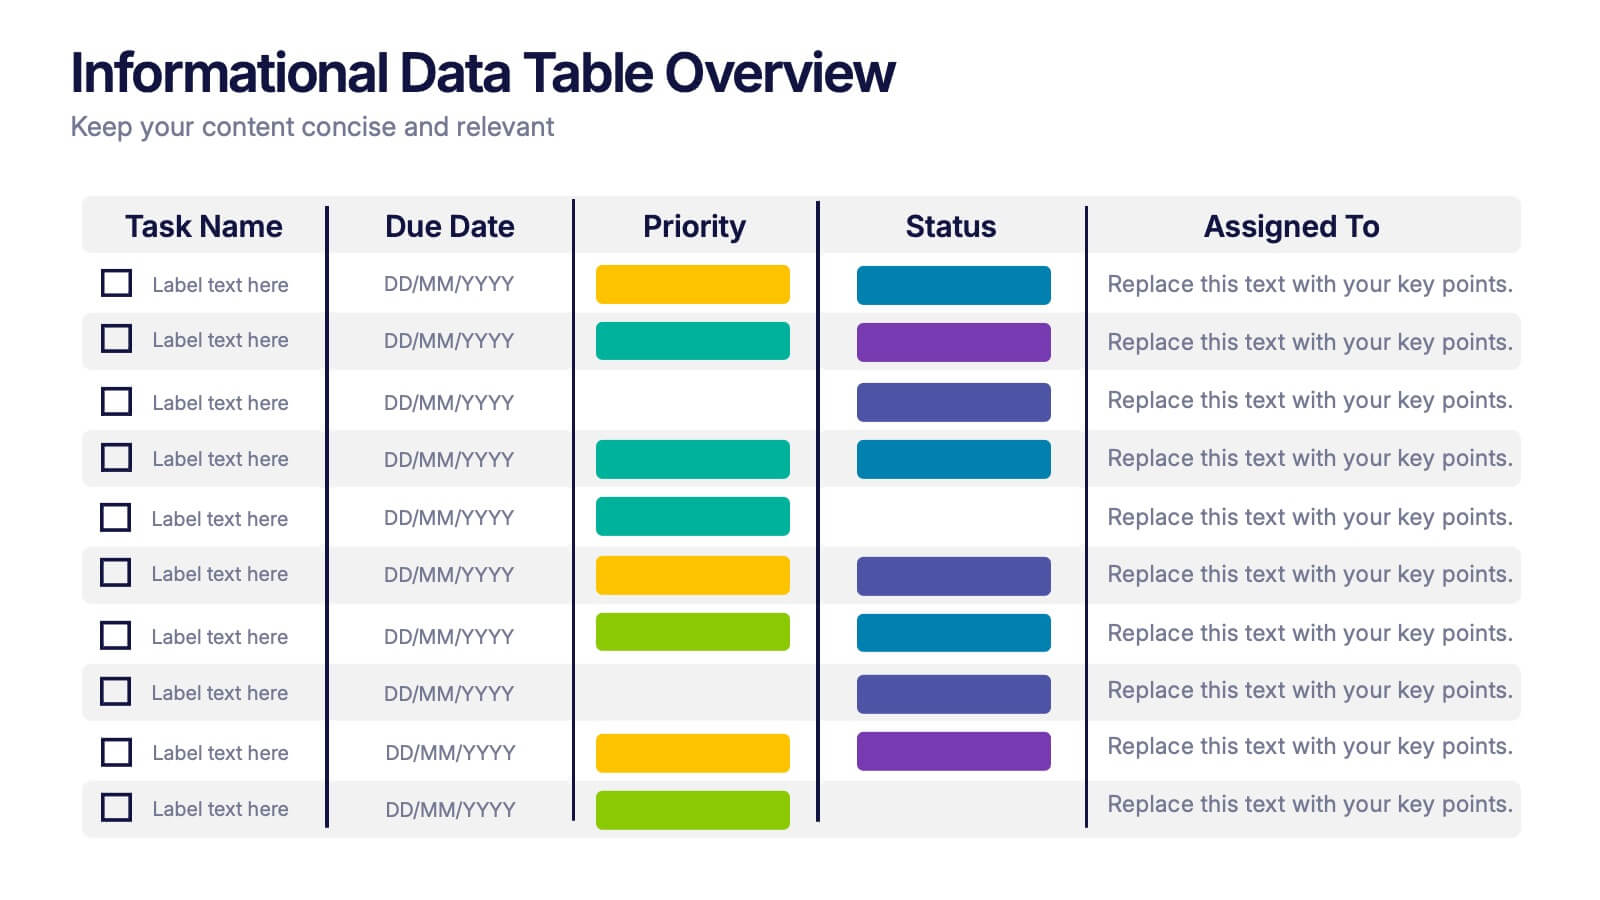
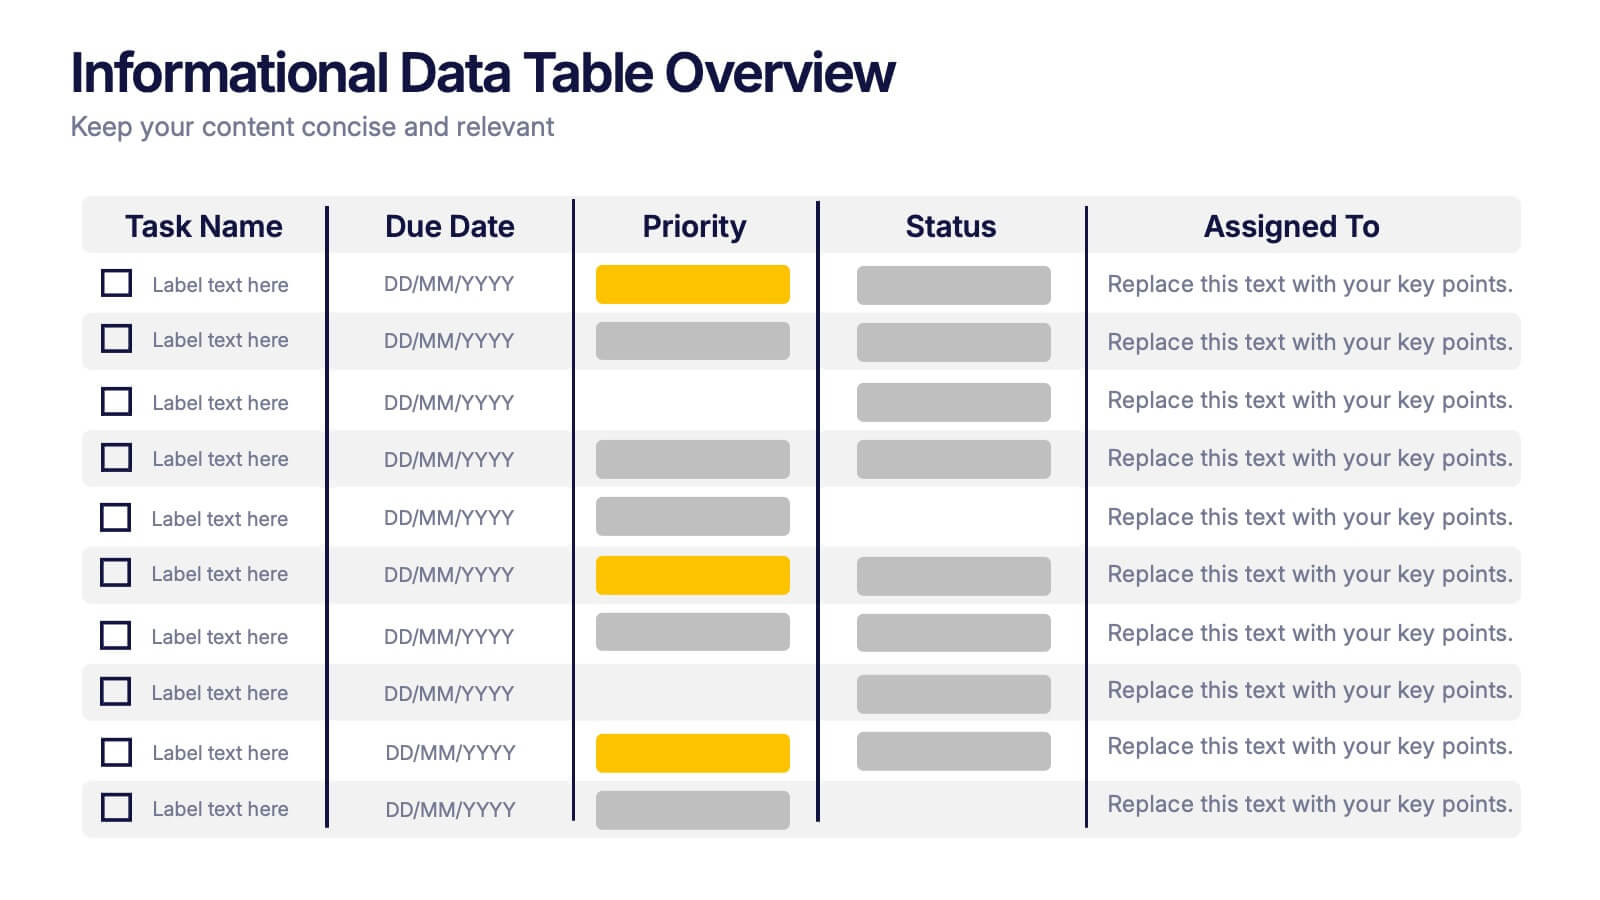
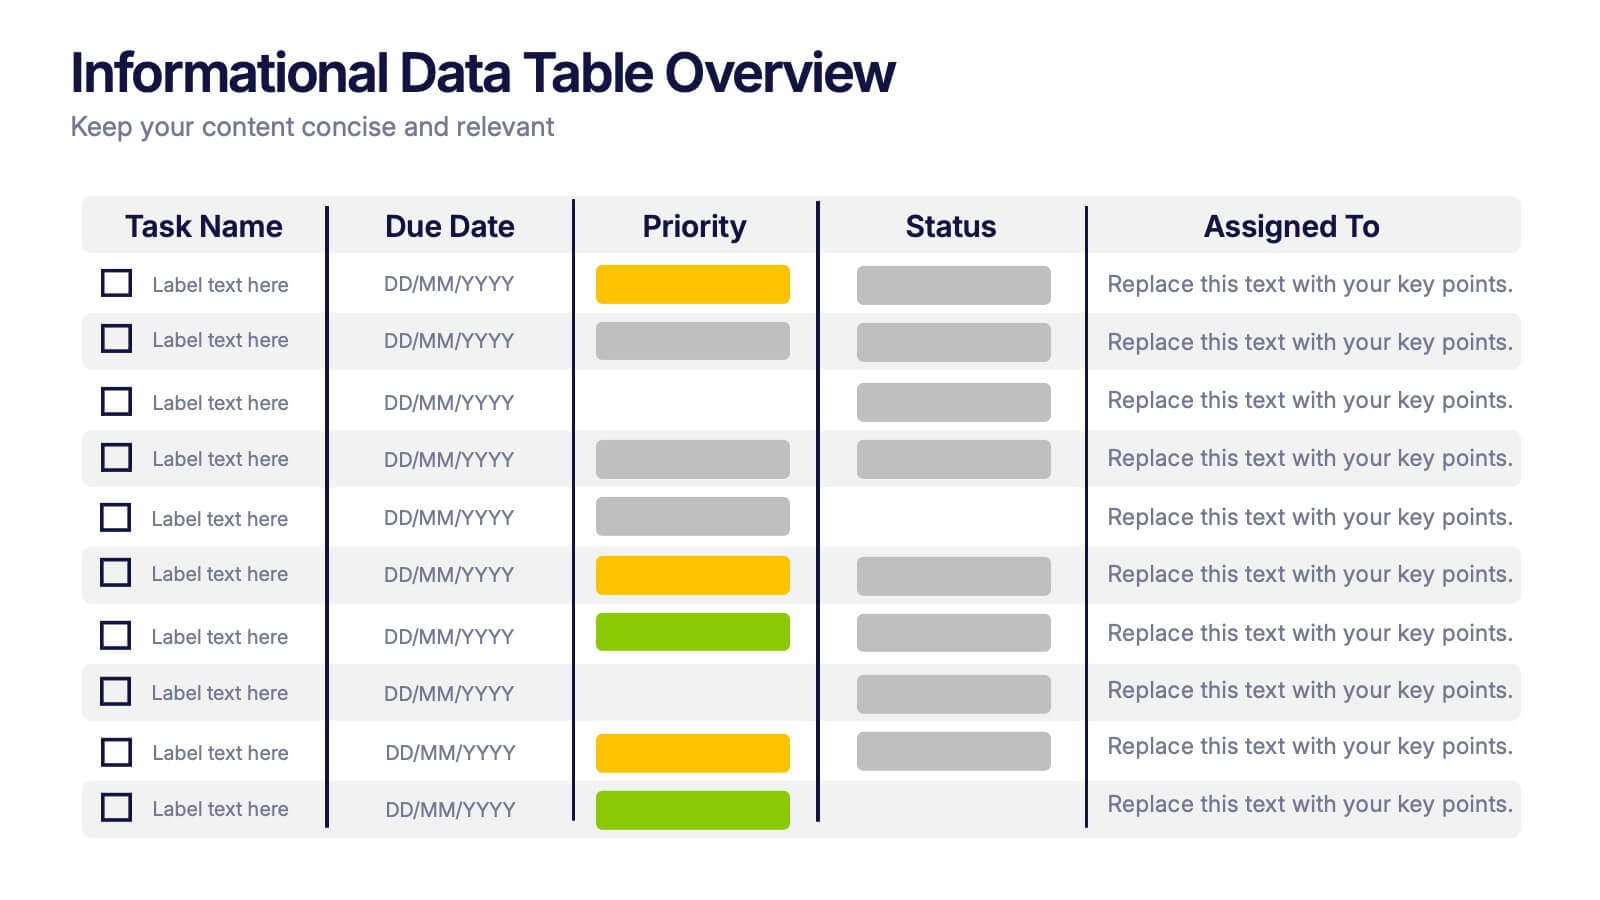
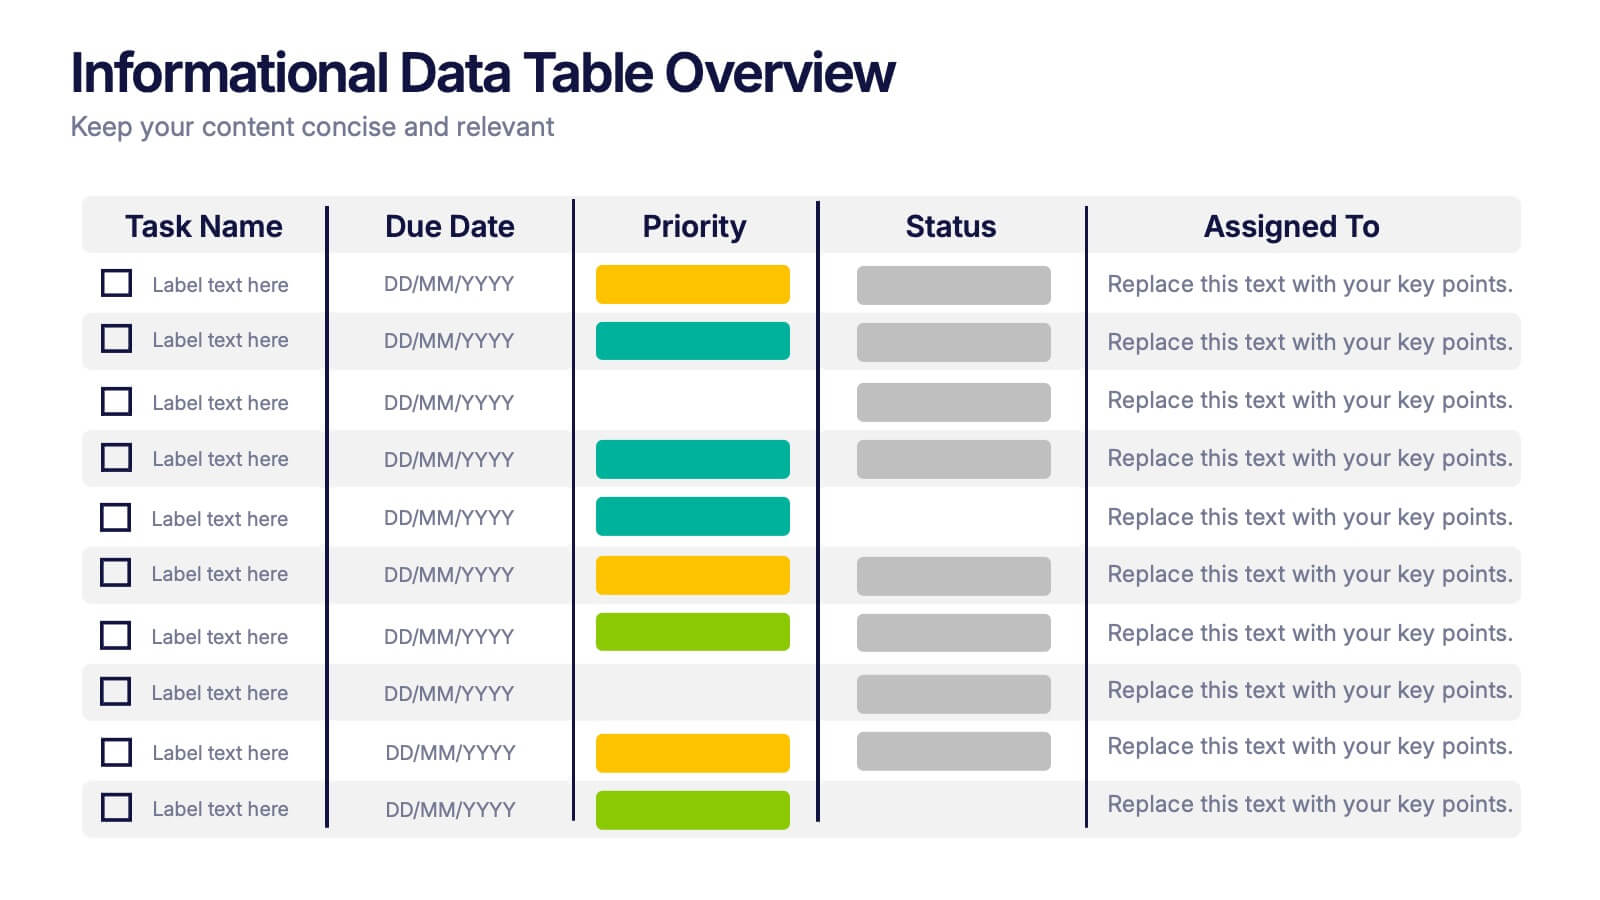
Present your tasks with clarity using this Informational Data Table Overview presentation. Perfect for team planning, status updates, or project management, this slide helps you organize tasks by name, due date, priority, and assignment. Visual indicators make it easy to track progress at a glance. Fully editable in PowerPoint, Canva, and Google Slides.
- Remove from favorites
Powerpoint Template
1 MB
Google Slides Template
External link
Keynote Template
1 MB
4 slides
Project Workflow Steps and Flowchart Presentation
Map out each phase of your project with clarity using the Project Workflow Steps and Flowchart Presentation. This detailed template offers a visual grid layout for illustrating task sequences, decision points, and team responsibilities. Ideal for project managers, analysts, and operations teams. Fully editable and compatible with PowerPoint, Keynote, and Google Slides.
- Remove from favorites
Powerpoint Template
2 MB
Google Slides Template
External link
Keynote Template
3 MB
8 slides
Asia Geographics and Business Analysis Map Presentation
Visualize regional insights with this Asia map template. Highlight business data, performance indicators, or strategic regions using callouts and color-coded zones. Perfect for market analysis, logistics, or geographic reporting. Fully customizable in PowerPoint, Keynote, or Google Slides to match your branding and presentation goals with clear, location-based storytelling.
- Remove from favorites
Powerpoint Template
1 MB
Google Slides Template
External link
Keynote Template
2 MB
7 slides
Customer Profile Infographics Presentation Template
A customer profile is a detailed description of your current customers. By researching their demographics, psychographic data, and behaviors you can build on this knowledge to target similar customers in your sales and marketing campaigns. Use this template to create a customer profile, this will help you better understand your ideal customer. This template will tell you everything about the people you want to bring onto your customer list. This template is designed to walk you through writing your ideal customer profile, so that you can start attracting the right customers for your business.
- Remove from favorites
Powerpoint Template
1 MB
Google Slides Template
External link
Keynote Template
1 MB
4 slides
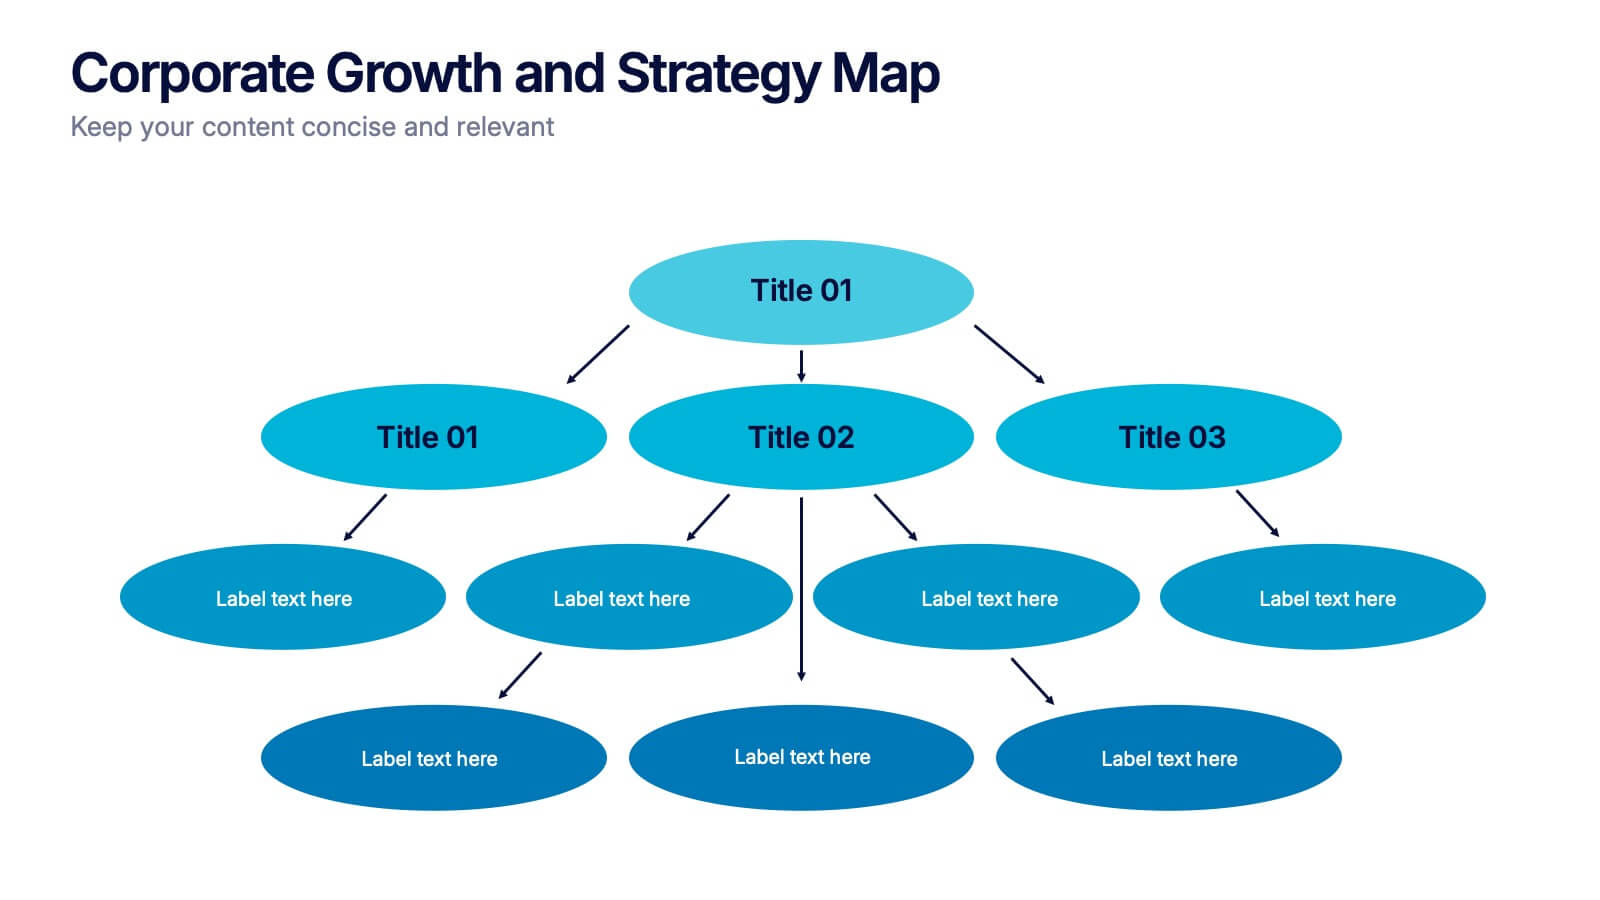
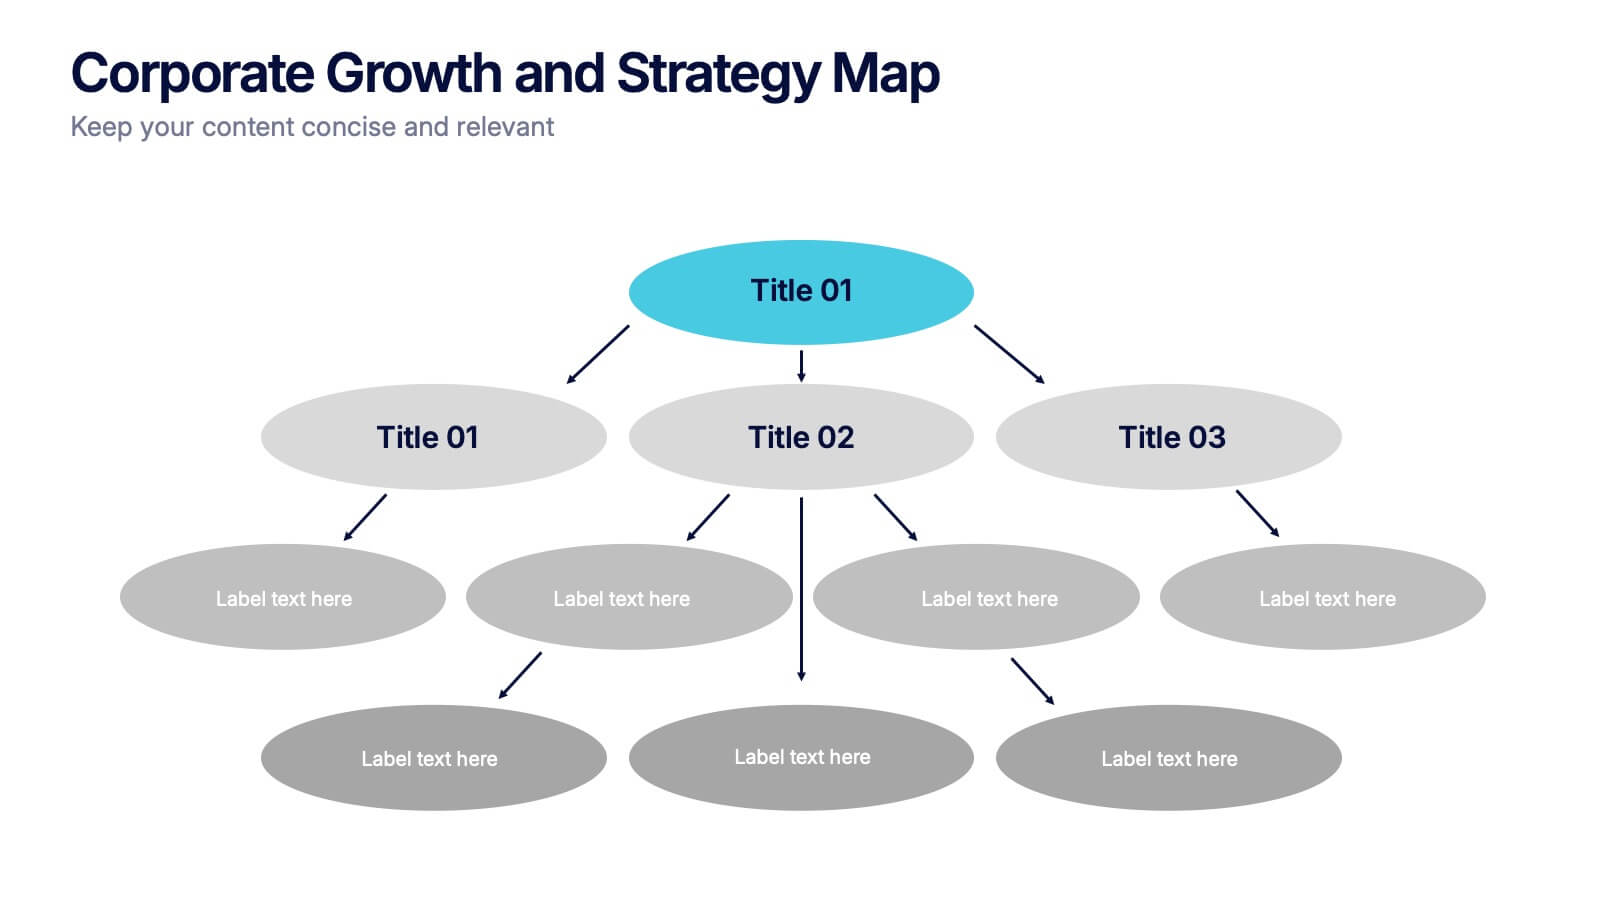
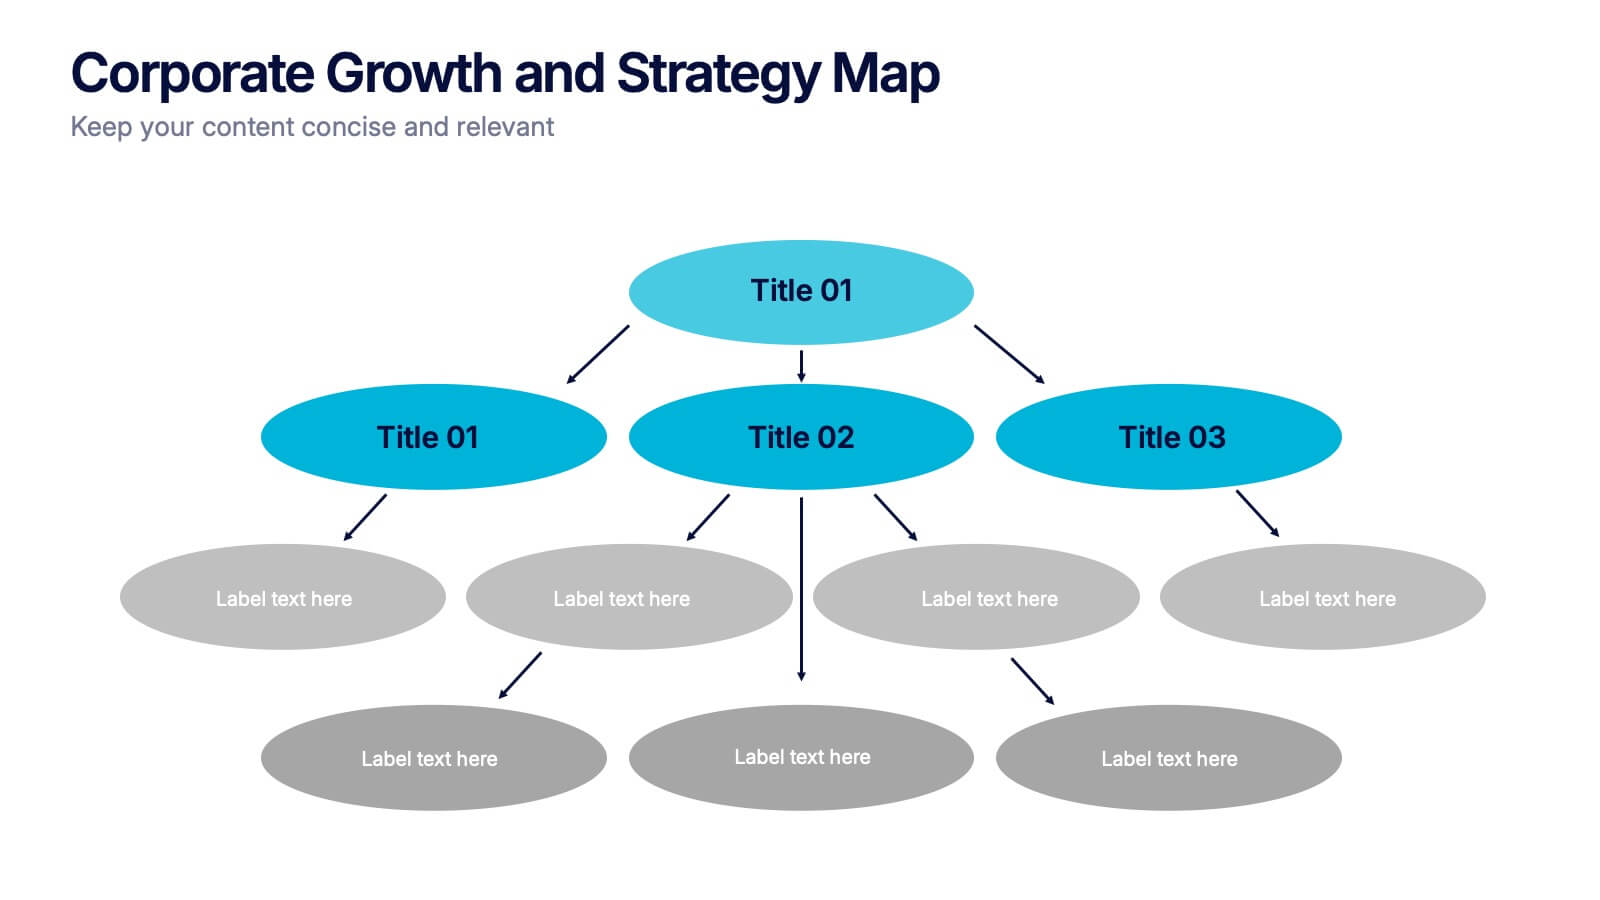
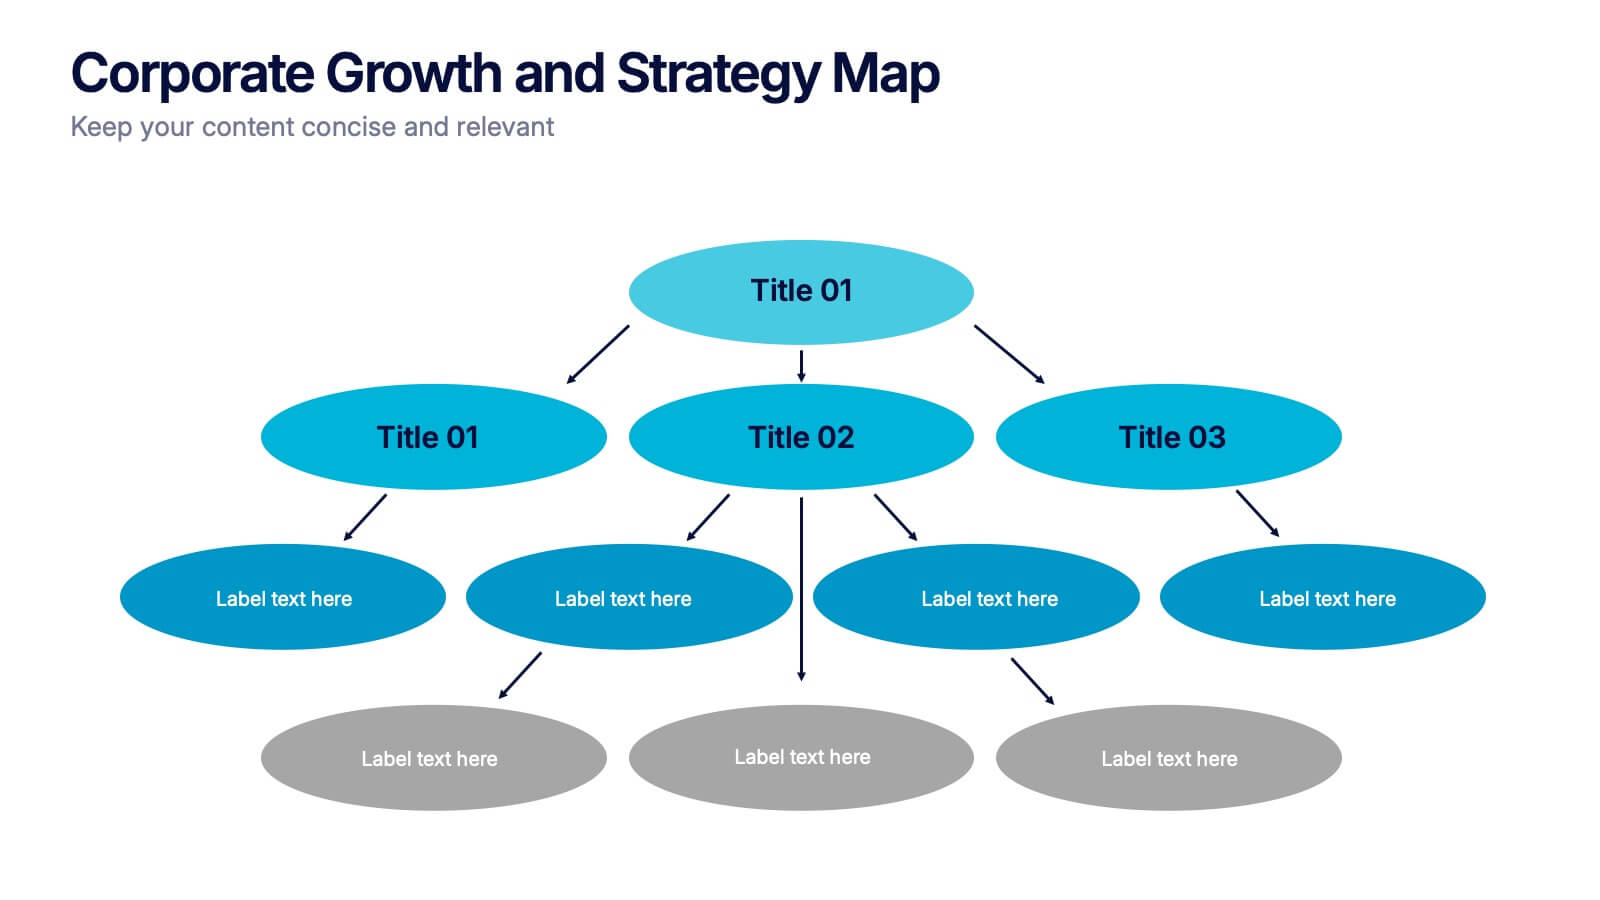
Corporate Growth and Strategy Map Presentation
Visualize your business development path with this layered strategy map. Ideal for showcasing organizational goals, strategic initiatives, and cascading growth stages. Each level is clearly structured for easy customization, making it perfect for leadership planning, corporate roadmaps, or strategic reviews in PowerPoint, Keynote, or Google Slides.
- Remove from favorites
Powerpoint Template
1 MB
Google Slides Template
External link
Keynote Template
2 MB
2 slides
Visual Resume and Project Gallery Presentation
Showcase your personality and creative work with the Visual Resume and Project Gallery Presentation. This vibrant layout blends a professional “About Me” section with a clean, image-focused gallery—ideal for designers, freelancers, or artists. Fully editable in Canva, PowerPoint, Keynote, and Google Slides for easy customization and seamless presentation.
- Remove from favorites
Powerpoint Template
1 MB
Google Slides Template
External link
Keynote Template
1 MB
5 slides
Water Problems Infographics
Water Problems refer to the various issues that arise due to the scarcity, pollution, or mismanagement of water resources. These vertical infographics are perfect for addressing various issues related to water management and conservation. They are effective tools for raising awareness about water-related issues and promoting sustainable water management practices. This template is completely customizable and includes various icons and images related to water such as water droplets, faucets, and ocean waves. The color scheme is predominantly blue, signifying the importance of water conservation and preservation.
- Remove from favorites
Powerpoint Template
11 MB
Google Slides Template
External link
Keynote Template
5 MB
21 slides
Goldenshadow Professional Portfolio Showcase Presentation
A refined portfolio presentation template crafted to highlight professional achievements and expertise. Showcase featured projects, collaborations, and client testimonials with a sleek, modern design. Includes sections for services offered, awards, pricing, and contact information. Fully customizable and compatible with PowerPoint, Keynote, and Google Slides for impactful portfolio presentations.


