


Features
- 6 Unique slides
- Fully editable and easy to edit in Microsoft Powerpoint, Keynote and Google Slides
- 16:9 widescreen layout
- Clean and professional designs
- Export to JPG, PDF or send by email


Do you have any questions?
Recommend


6 slides
Building High-Performing Teams Presentation
Unlock your team's full potential with this dynamic Building High-Performing Teams template. Featuring a sleek 3-part circular layout, it's perfect for showcasing leadership roles, collaboration pillars, or performance drivers. Use it for HR meetings, training sessions, or team development plans. Fully editable in PowerPoint, Keynote, and Google Slides.


25 slides
Draco Photography Portfolio Template Presentation
Showcase your photography portfolio with this dynamic template! Highlight your projects, style, client testimonials, and awards. Includes sections for pricing, services offered, and social media links. Ideal for photographers to create impactful presentations. Compatible with PowerPoint, Keynote, and Google Slides.


6 slides
Green Energy and Ecology Presentation
Ignite your audience’s curiosity with a clean, modern layout that brings eco-friendly ideas to life. This presentation helps you explain renewable energy concepts, sustainability benefits, and environmental impact in a clear, structured way that feels fresh and inspiring. Fully compatible with PowerPoint, Keynote, and Google Slides.


20 slides
Spark Sales Performance Report Presentation
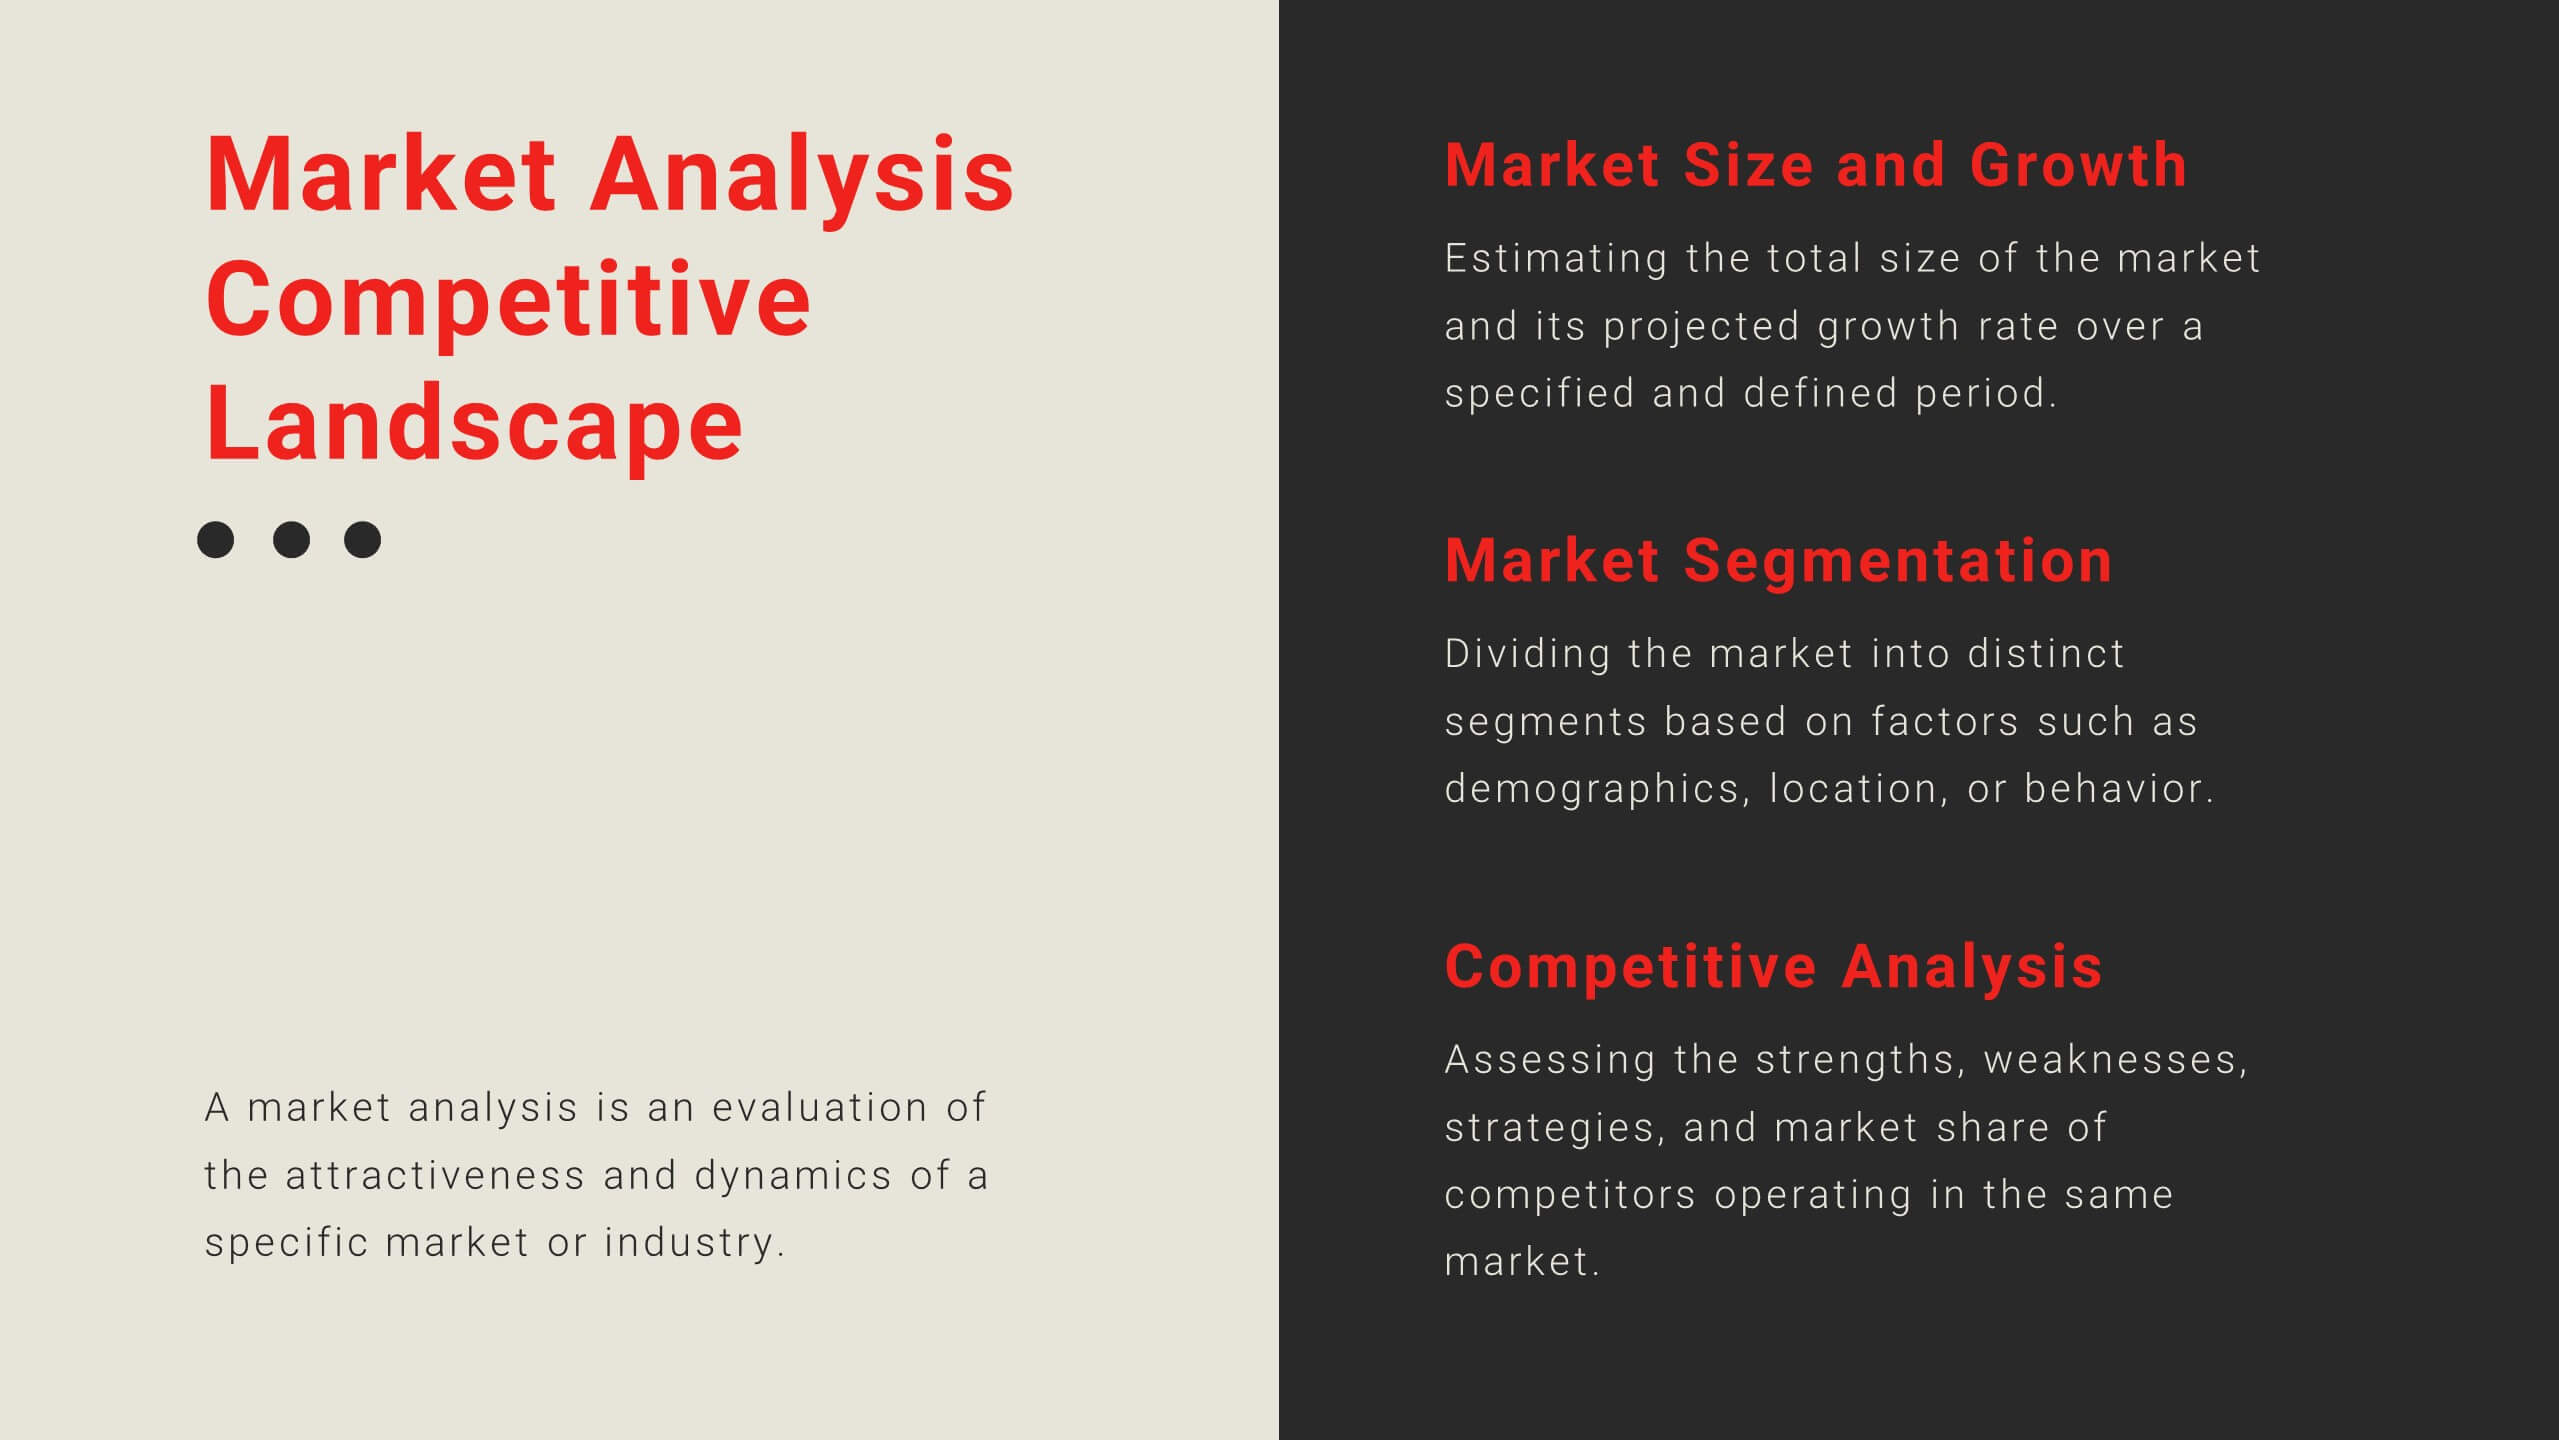
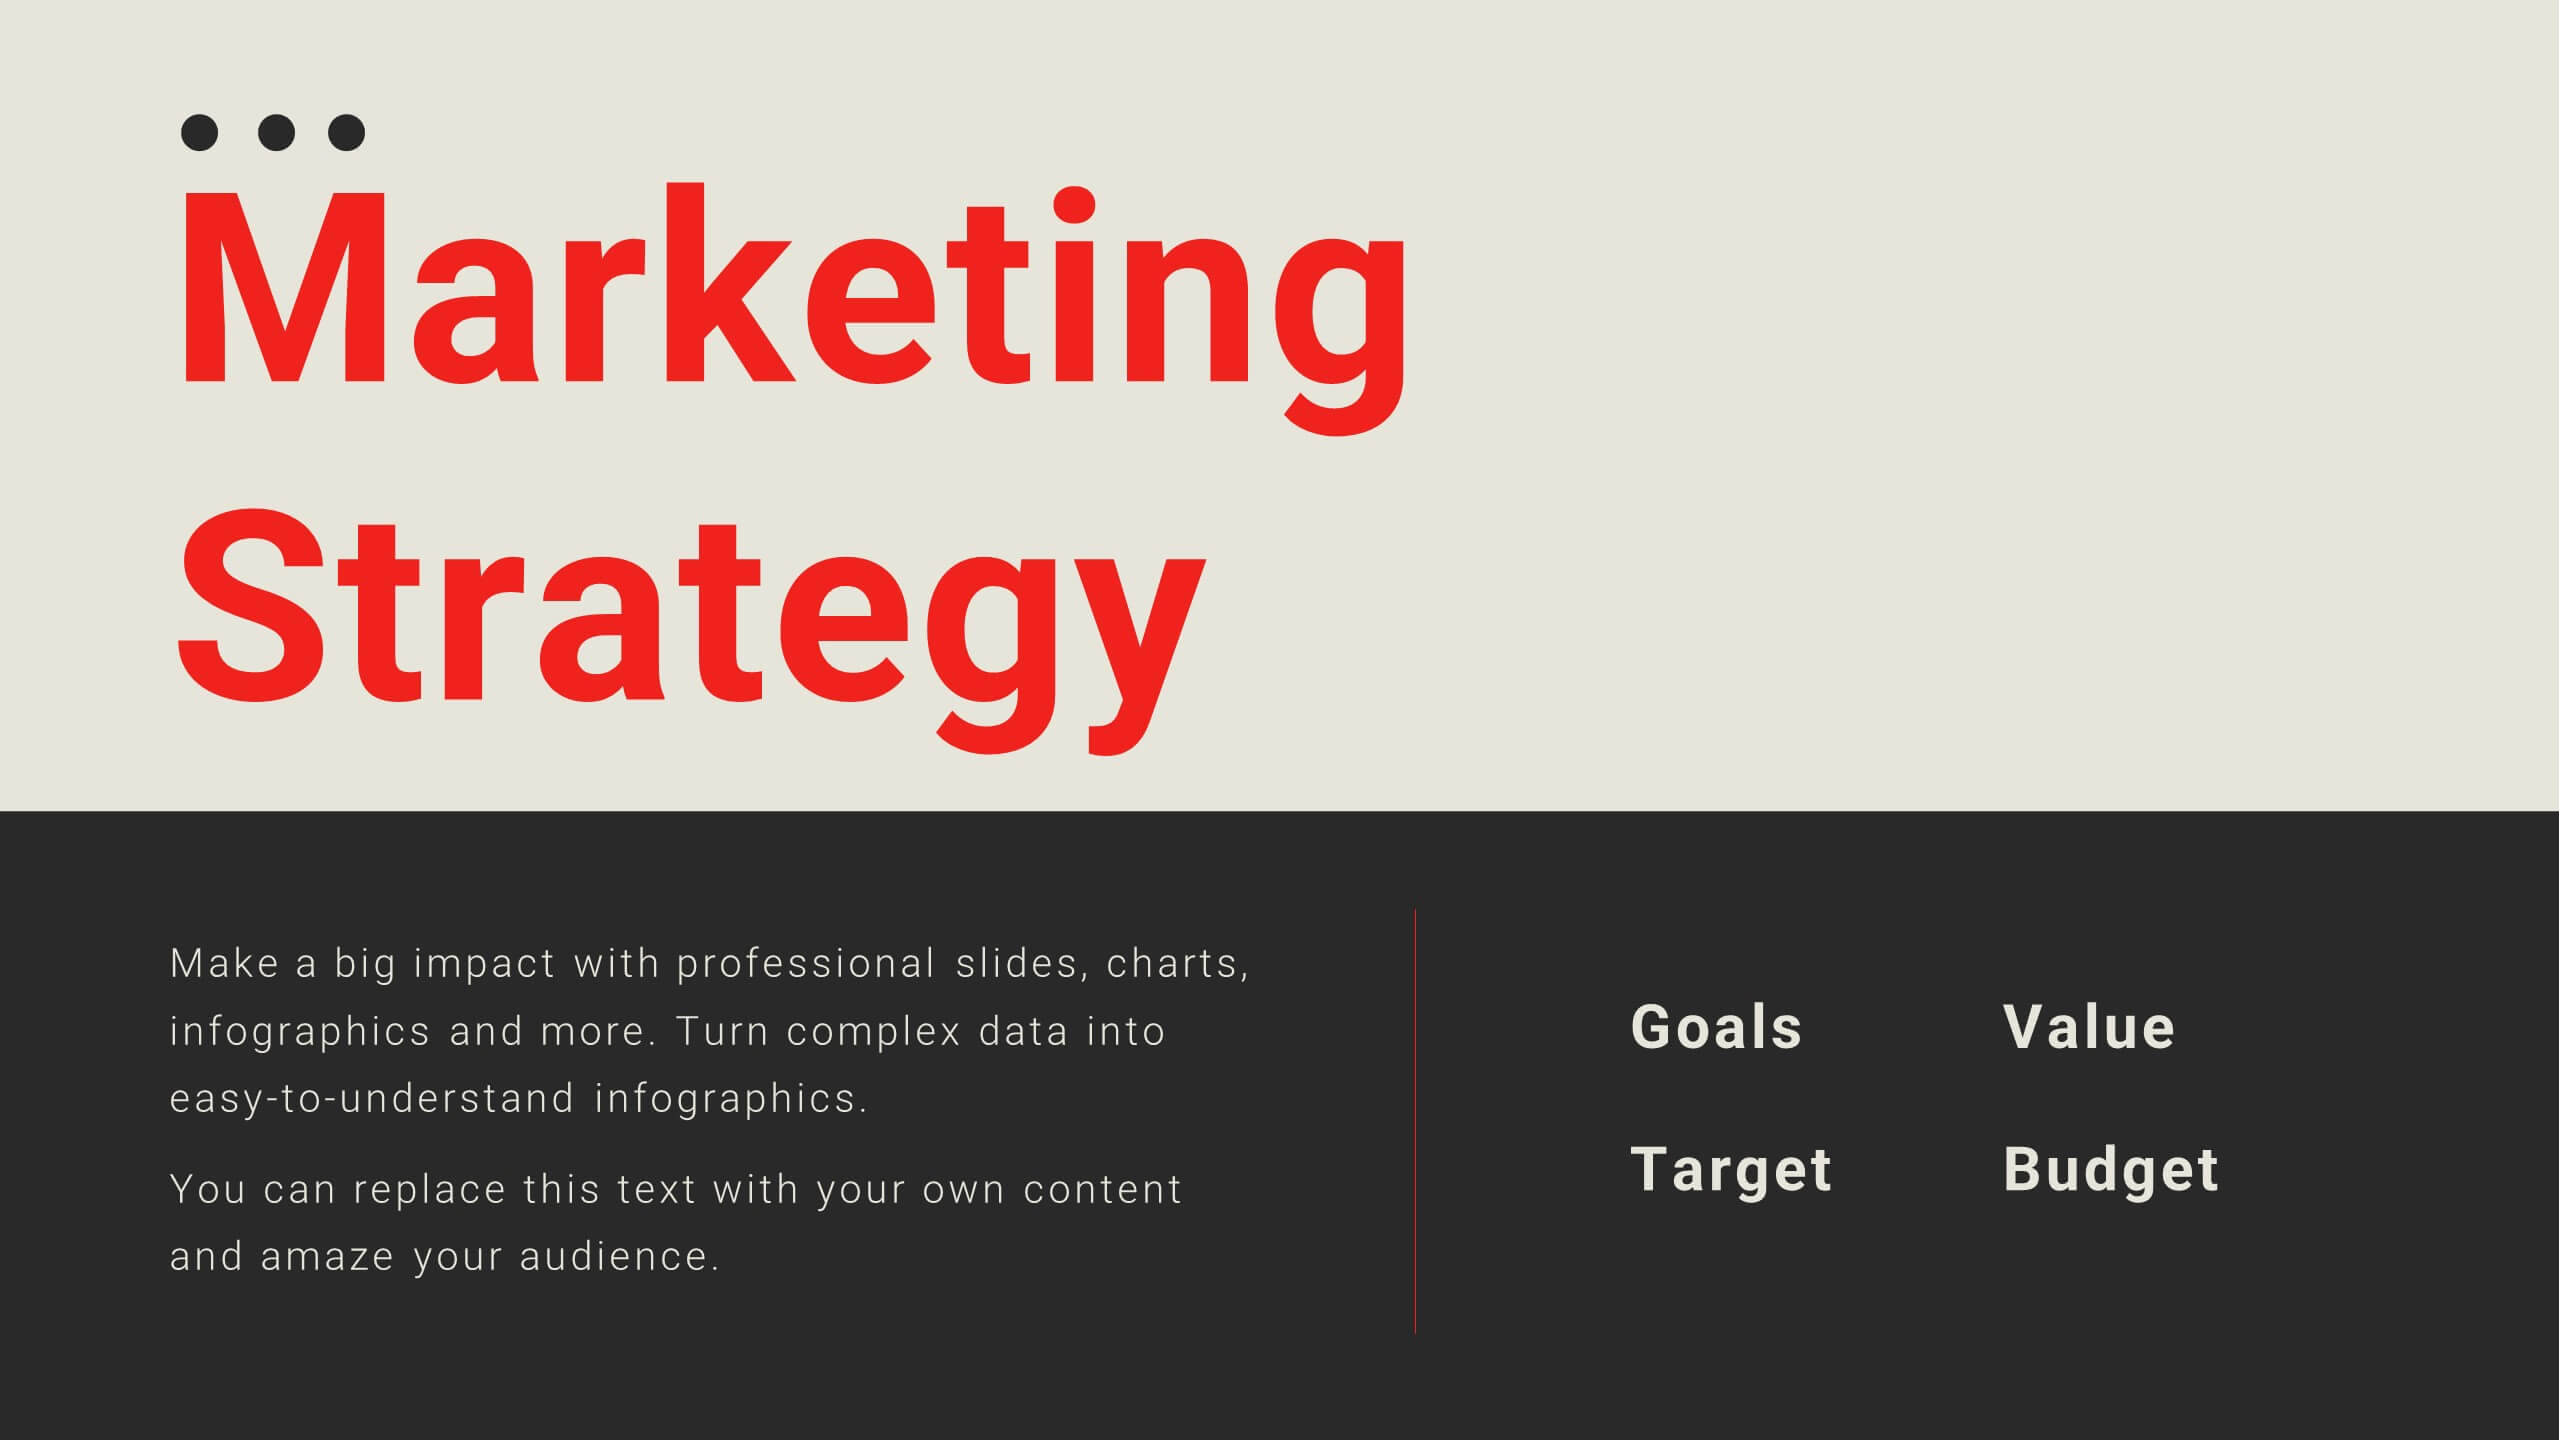
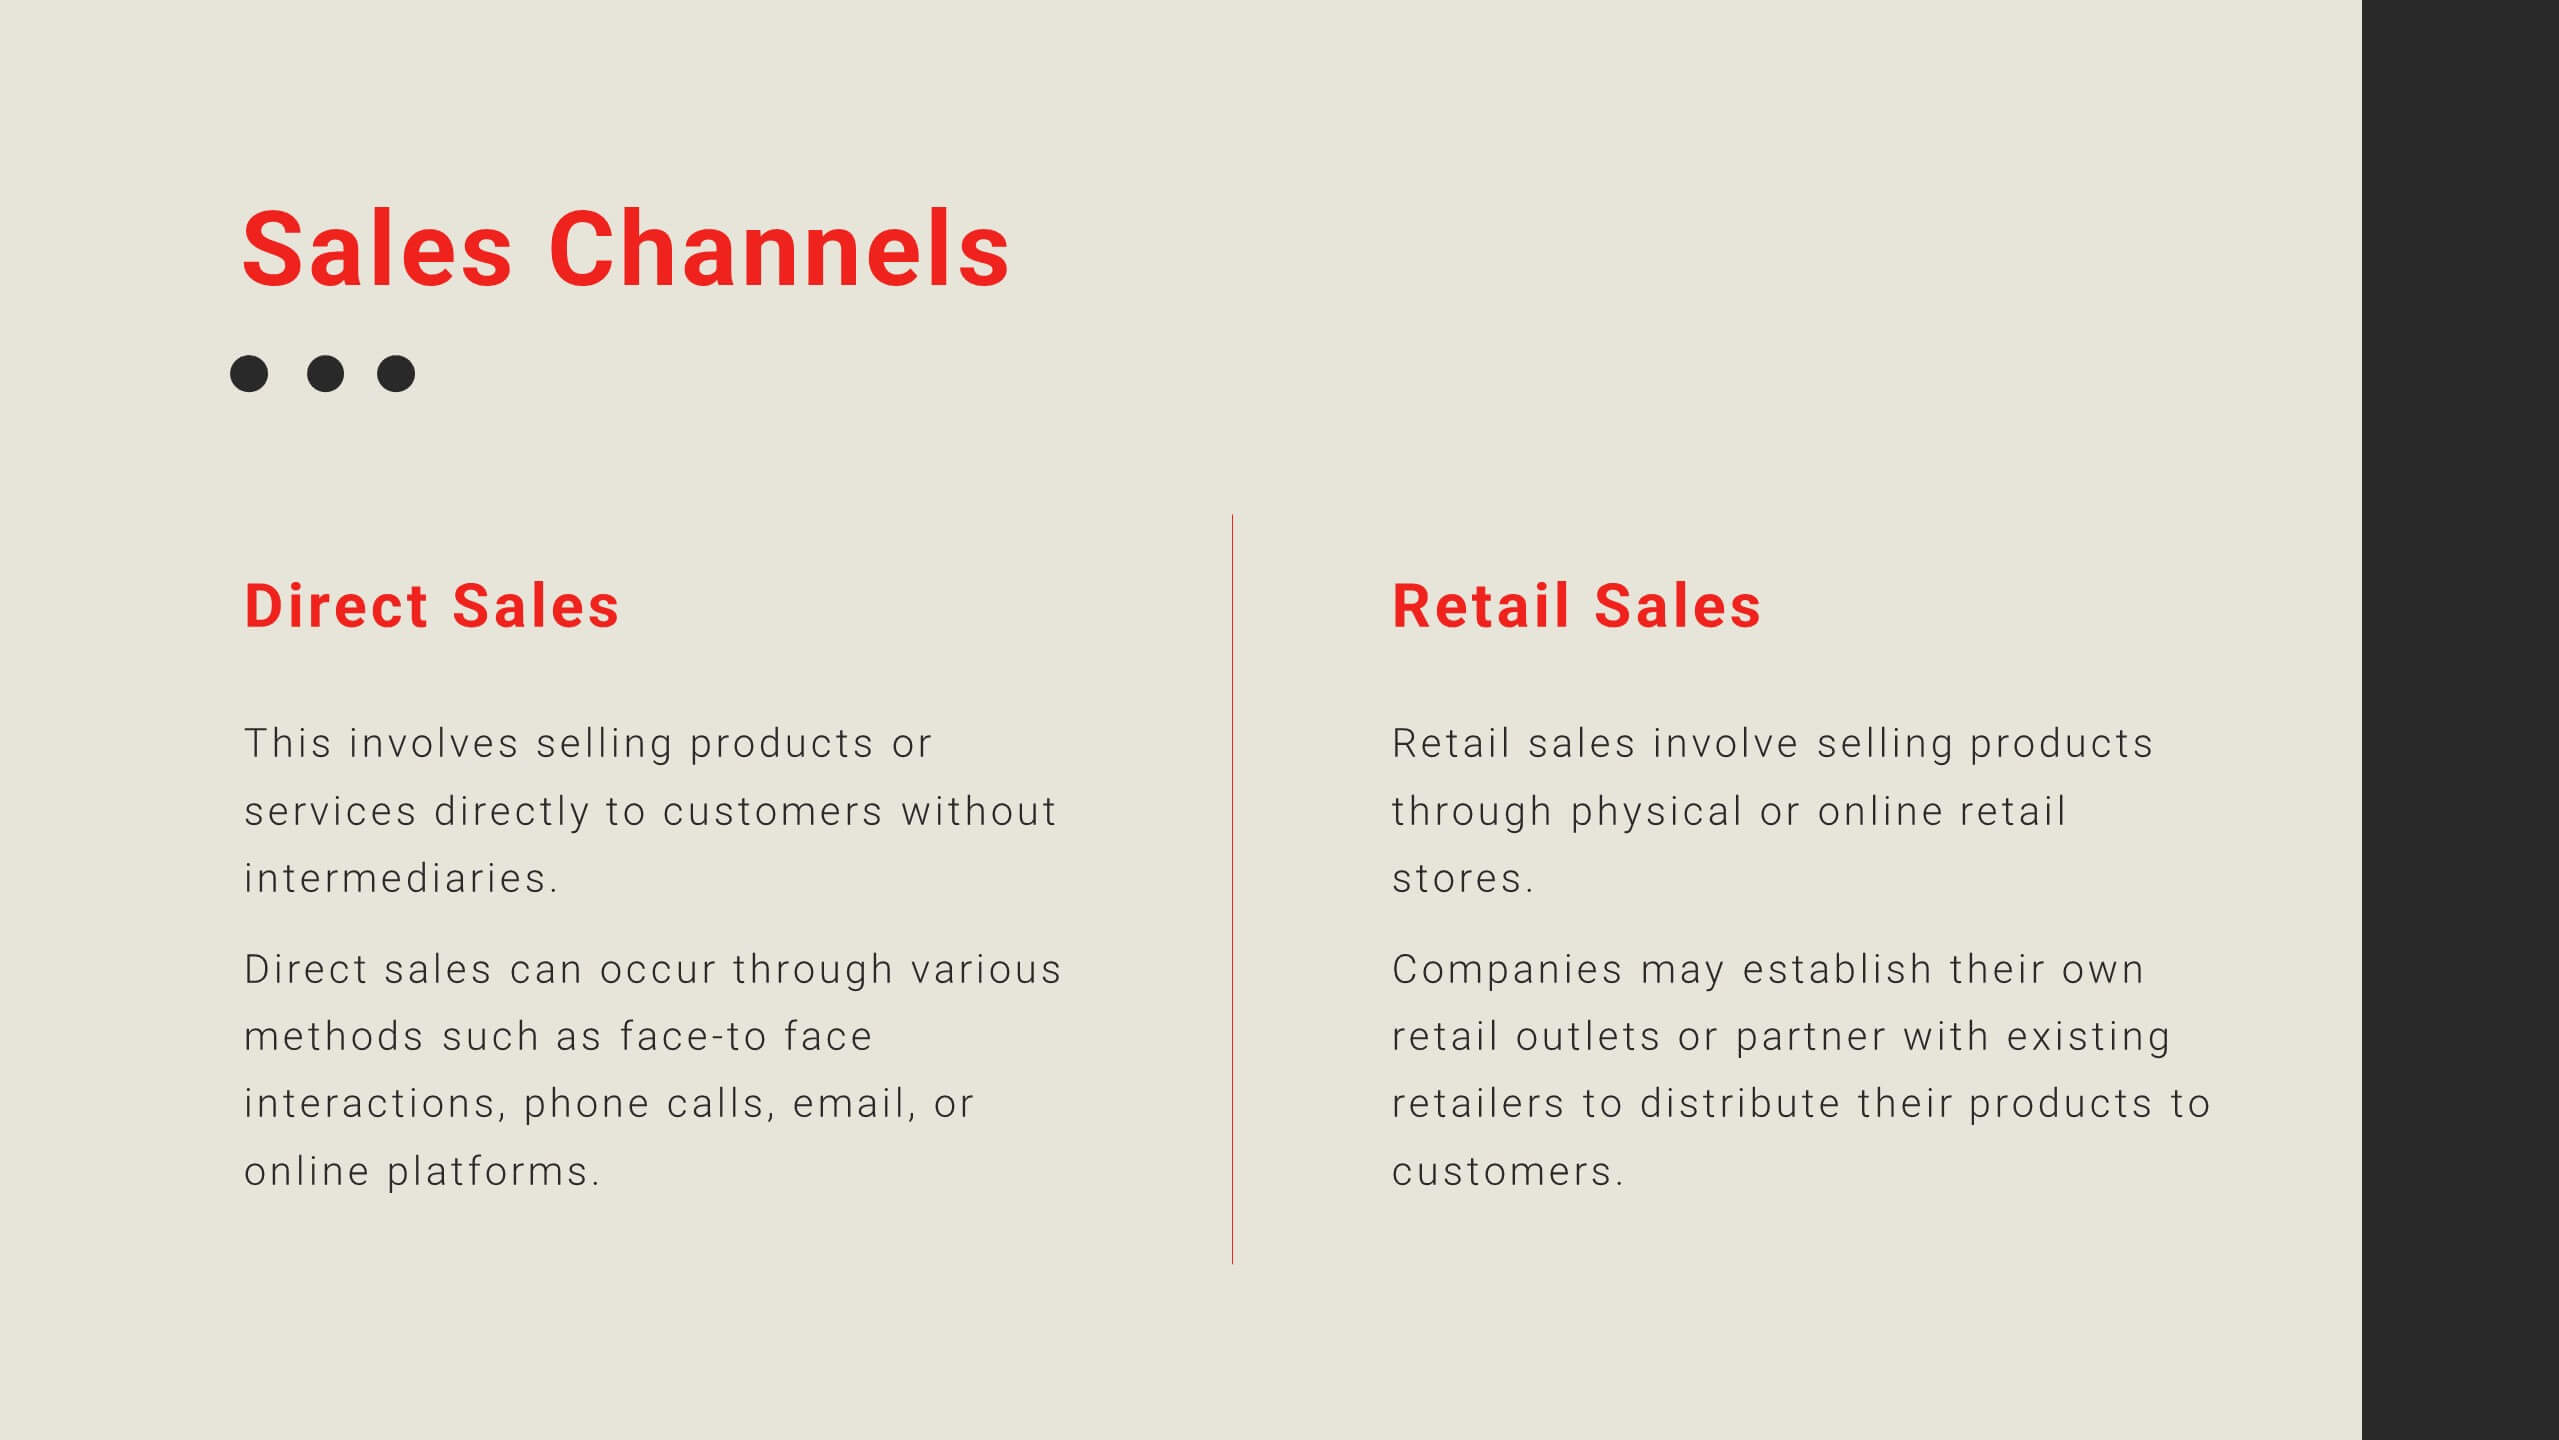
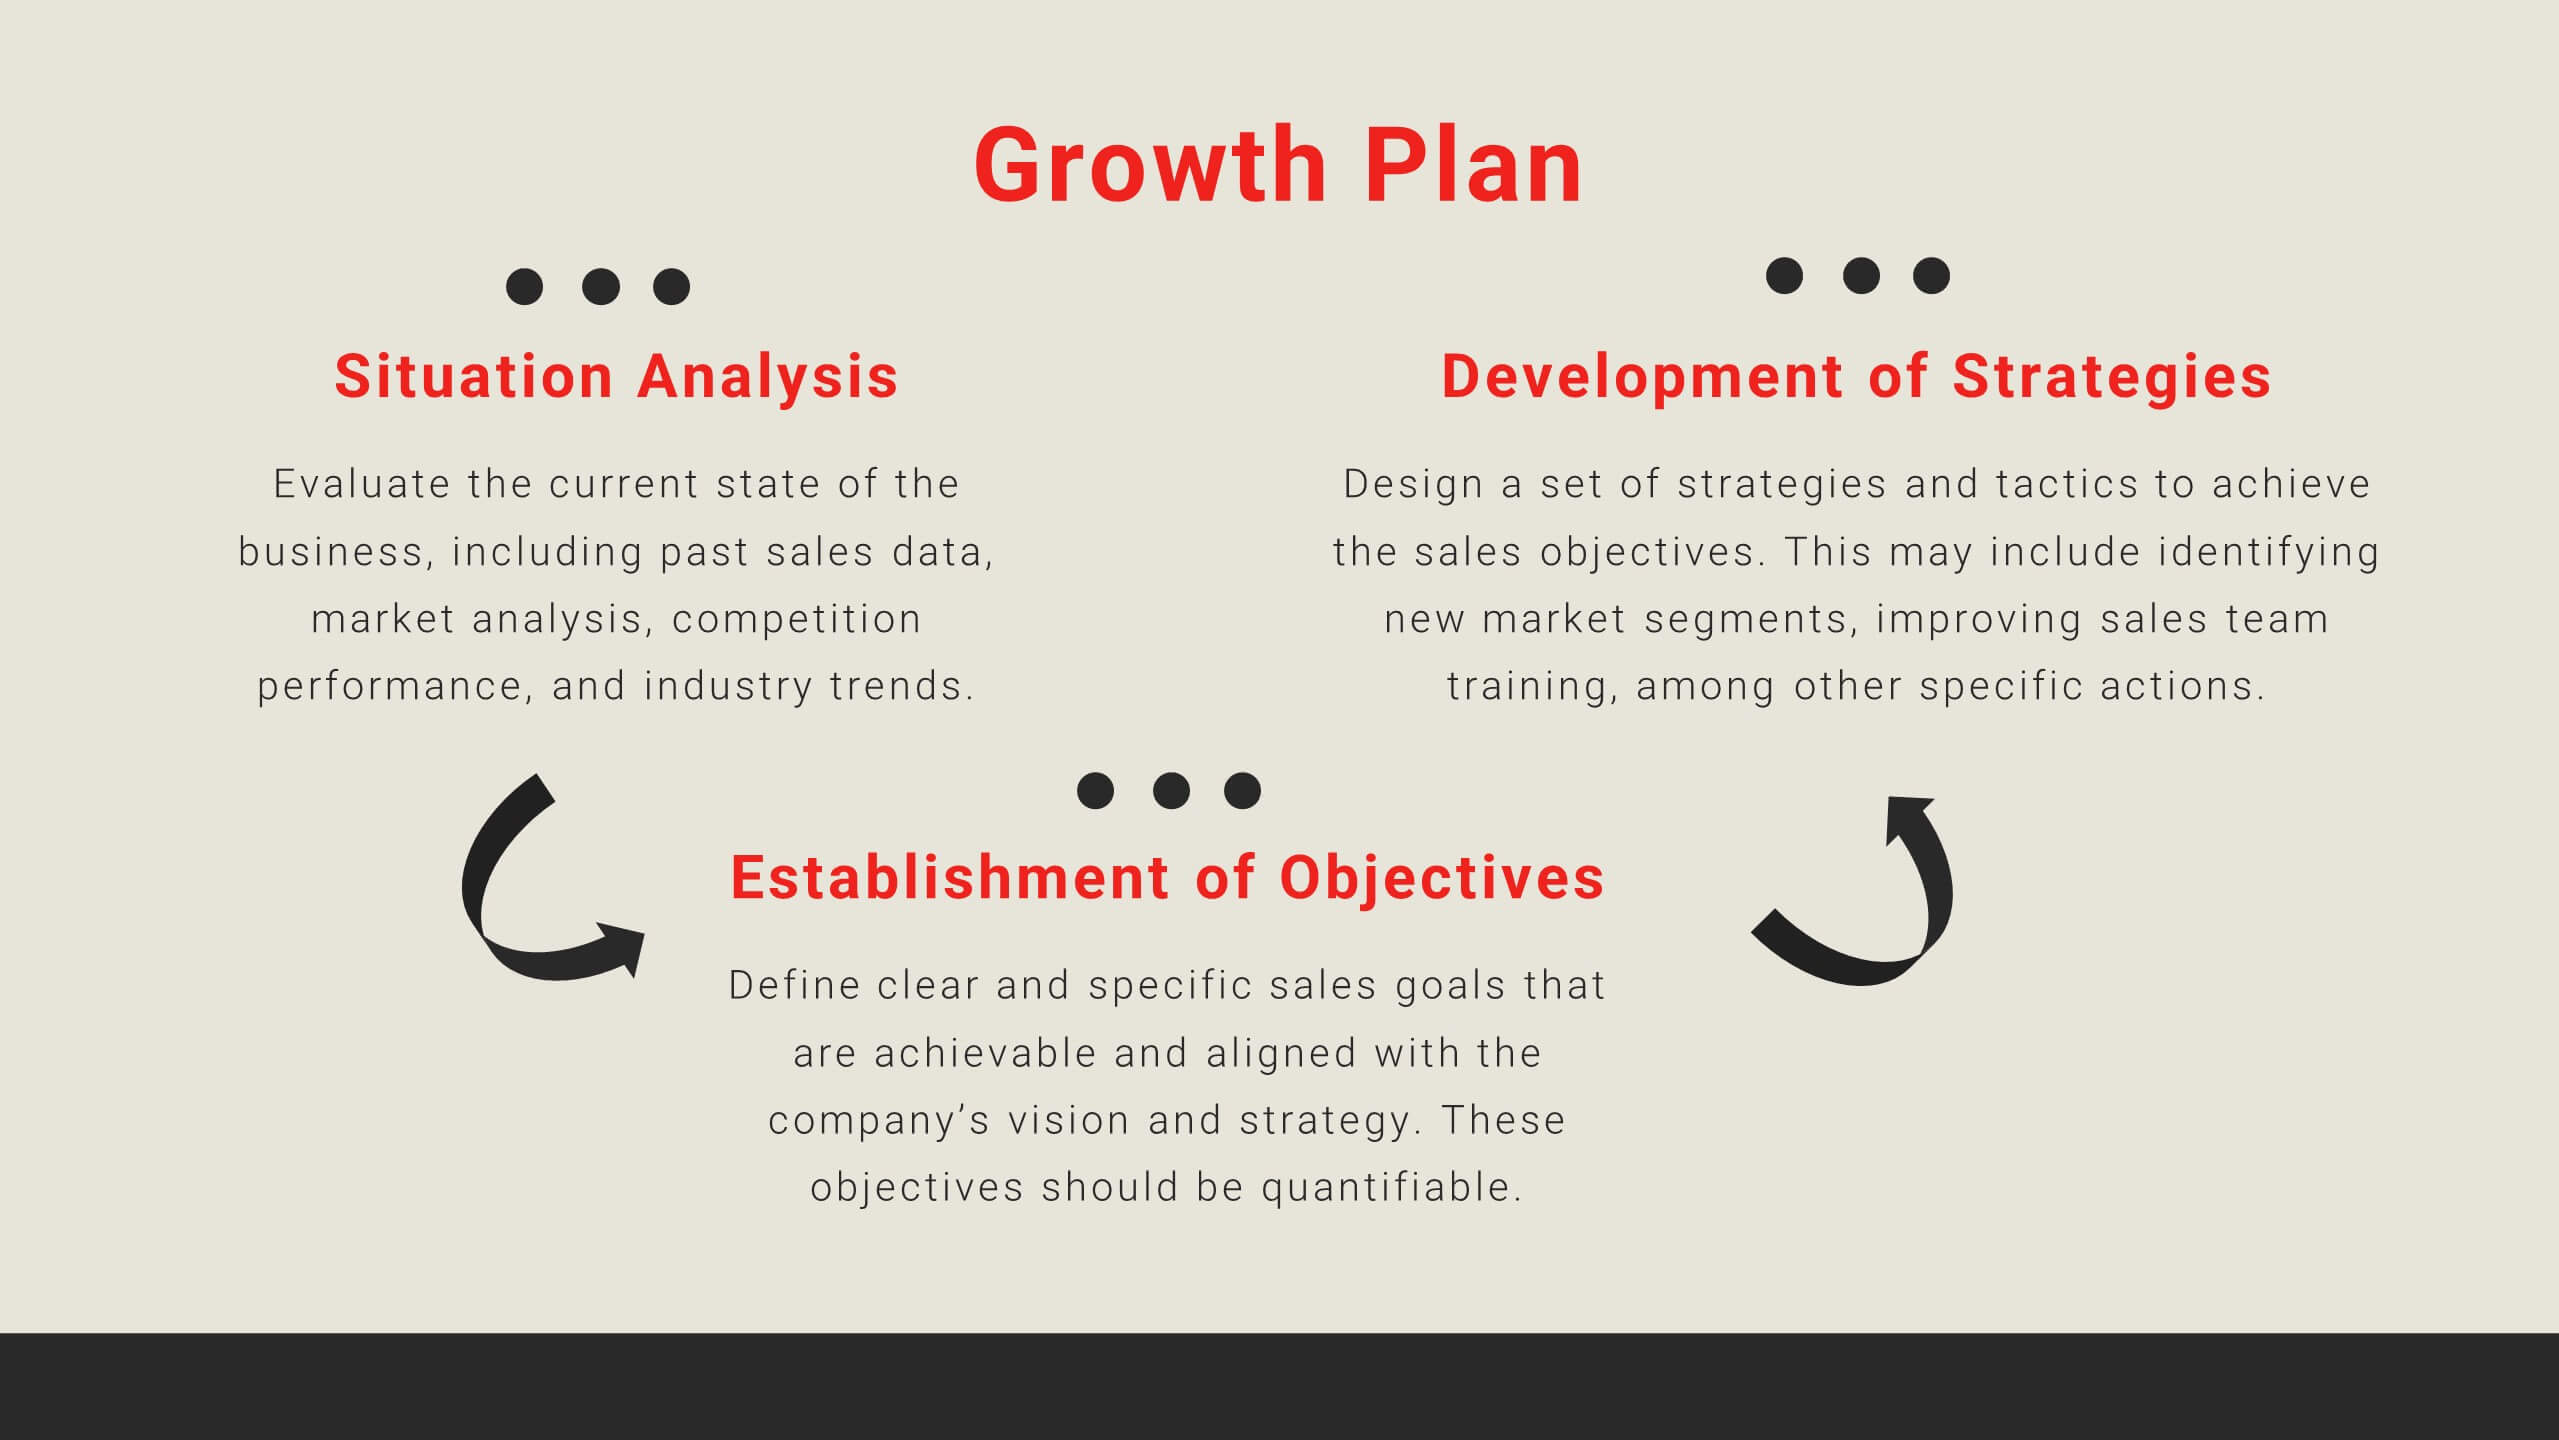
Deliver insights and strategies with this dynamic sales performance report presentation template. Featuring an elegant and modern design, it provides dedicated sections for agenda setting, company overview, service highlights, and customer value propositions. Present competitive analysis, sales objectives, and performance metrics with ease using clean, structured layouts. Visualize sales processes, team introductions, and pricing strategies through engaging, editable infographics and data slides. The template also includes areas for showcasing promotions, customer testimonials, future opportunities, and actionable next steps. Tailored for sales teams and managers, it offers a professional framework to review and strategize effectively. Fully customizable and compatible with PowerPoint, Google Slides, and Keynote, this template ensures seamless adaptation to your branding and needs. Impress your audience while highlighting achievements and paving the way for future growth!


6 slides
First-Time Buyer Tips Infographic
Navigate the thrilling world of first-time purchases with our "First Time Buyer Tips" Infographic Template. This vibrant tool is crafted to guide newcomers through the buying process with clarity and confidence. Each slide is a step-by-step beacon, illuminating the path with expert advice, from understanding budgeting basics to mastering negotiation tactics. Designed with the novice buyer in mind, this template features a series of easy-to-follow visuals and succinct tips that demystify the complexities of making major purchases. The clean, engaging design ensures that each piece of advice is both accessible and memorable, ideal for personal finance websites, real estate blogs, or consumer education workshops. Customize the color schemes, fonts, and layouts to align with your branding, making it a seamless addition to your educational materials. Equip your audience with the knowledge they need to make informed, confident decisions with this indispensable guide.


5 slides
Circular Wheel for Process Flow Presentation
Visualize your workflow with clarity using this 5-step circular process diagram. Perfect for illustrating continuous improvement, feedback loops, or operational stages. Each segment is color-coded and numbered for easy navigation and understanding. Fully editable in PowerPoint, Keynote, and Google Slides—customize icons, colors, and text to suit your message.


10 slides
Farming Technologies and Crop Management
Present cutting-edge insights with the Farming Technologies and Crop Management Presentation. This visually compelling slide uses wind turbine illustrations to symbolize innovation in agriculture. Ideal for showcasing smart farming tools, sustainable practices, and crop optimization strategies. Fully editable and compatible with PowerPoint, Keynote, and Google Slides.


4 slides
Lead Nurturing Funnel Breakdown Presentation
Guide leads through every stage with the Lead Nurturing Funnel Breakdown Presentation. This slide visualizes the customer journey from awareness to conversion, helping you present marketing automation, CRM strategies, or content funnels. Fully customizable in PowerPoint, Google Slides, and Canva for seamless integration.


7 slides
Artificial Intelligence Education Infographic Presentation
Artificial Intelligence is an important field of study and development that has the potential to revolutionize many aspects of modern life. A great way to display your ideas in a visual manner, this AI Infographic Template can be used by businesses and corporations who want to communicate their team vision in a clear and dynamic way. This template is completely editable, allowing you to customize it with your own information and photos. It includes icons and graphs to illustrate your points, as well as text boxes and slide titles. It is compatible with Powerpoint, Keynote and Google Slides.


20 slides
Lullabyne Design Portfolio Presentation
Showcase your creative work with this modern and professional design portfolio presentation. Covering essential elements like design briefs, mood boards, prototypes, and implementation plans, this template helps you present your work with clarity and style. Fully customizable and available for PowerPoint, Keynote, and Google Slides.


7 slides
Competitive Advantage Through Value Chain
Make your value chain comparison stand out with this bold, visual slide that maps two sides head-to-head. Perfect for highlighting competitive advantages, strategic differences, and operational gaps. This template is clear, customizable, and ready to plug into PowerPoint, Keynote, or Google Slides.


4 slides
Problem-Solving Puzzle Diagram Presentation
The "Problem-Solving Puzzle Diagram Presentation" template effectively showcases a creative approach to illustrating complex problem-solving strategies. Each piece of the puzzle represents a unique aspect of the solution process, encouraging viewers to consider how different components fit together to achieve a successful outcome. The diagram uses contrasting colors to differentiate between the sections clearly, making it easy for the audience to follow along and understand the interconnections. This template is perfect for business analysts, project managers, or any professional involved in strategic planning and problem-solving. It's designed to facilitate discussions in workshops, meetings, or team collaborations where visual aids can enhance comprehension and engagement in developing solutions.


2 slides
Creative Business Presentation
Showcase your ideas with energy and style using this bold, contemporary presentation layout. Featuring dynamic visuals and clean typography, this template is ideal for business proposals, portfolios, and startup pitches. Easily customizable in PowerPoint, Keynote, and Google Slides to suit your brand's identity.


21 slides
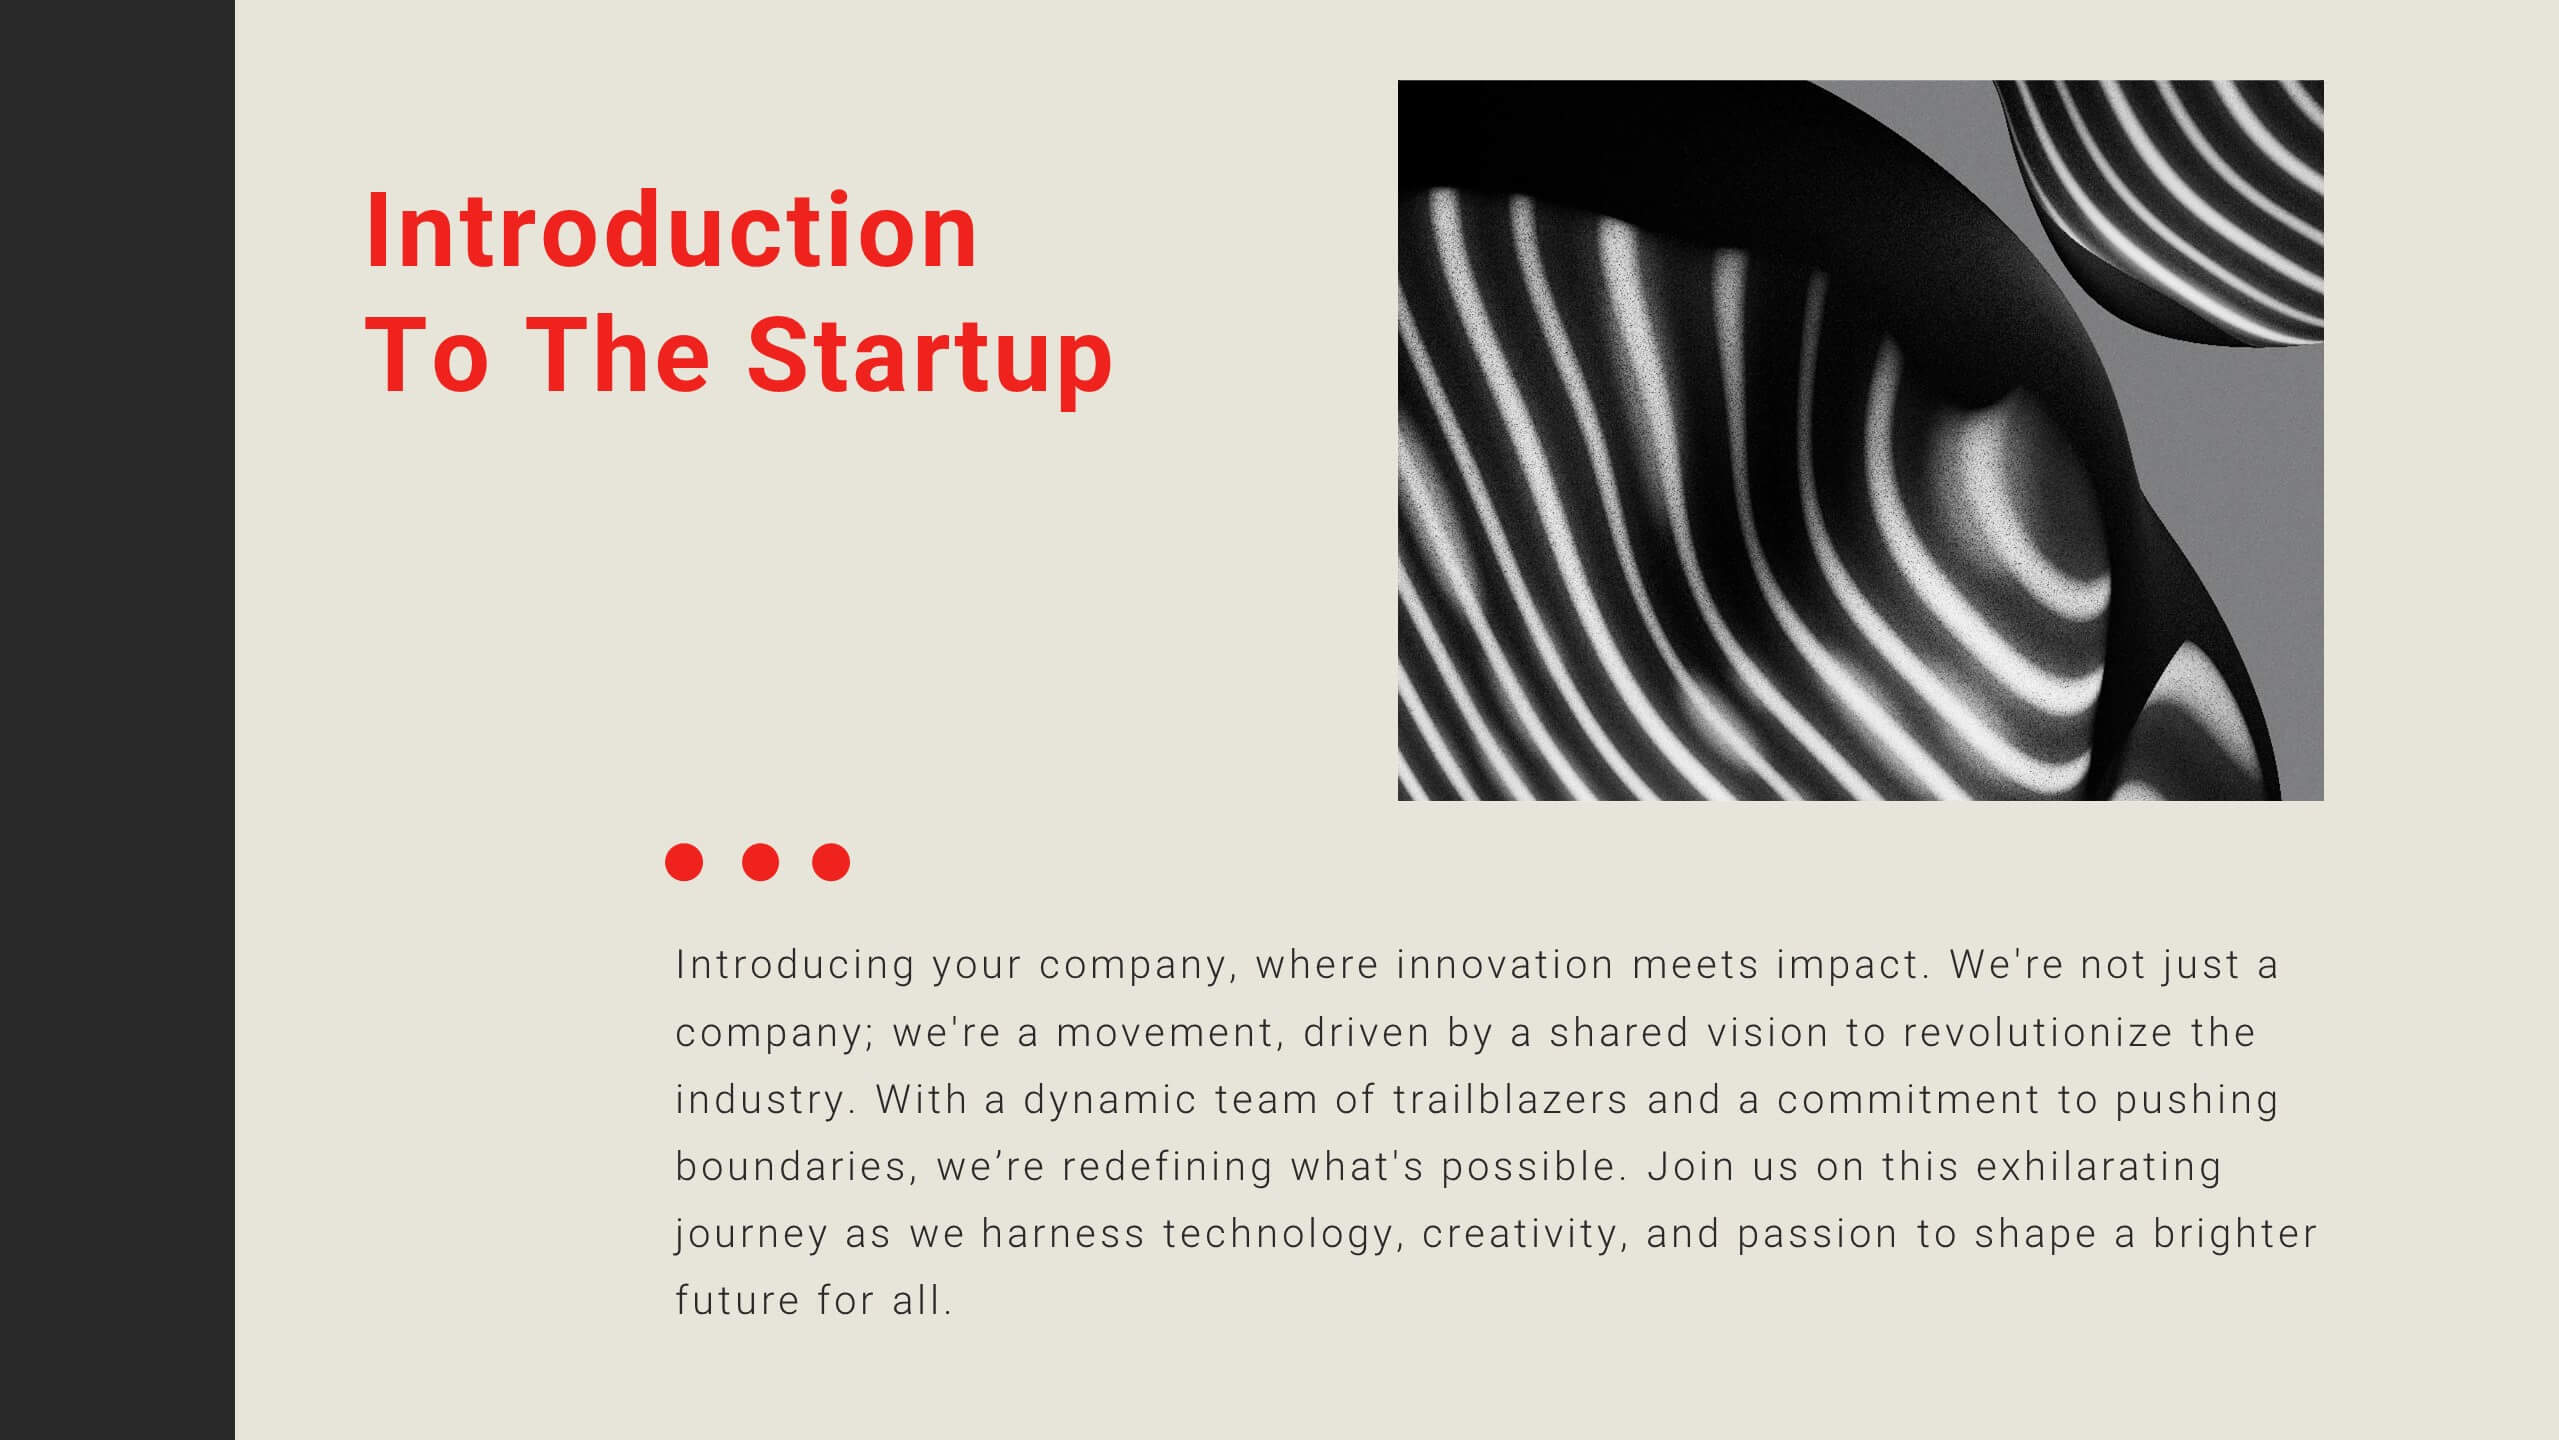
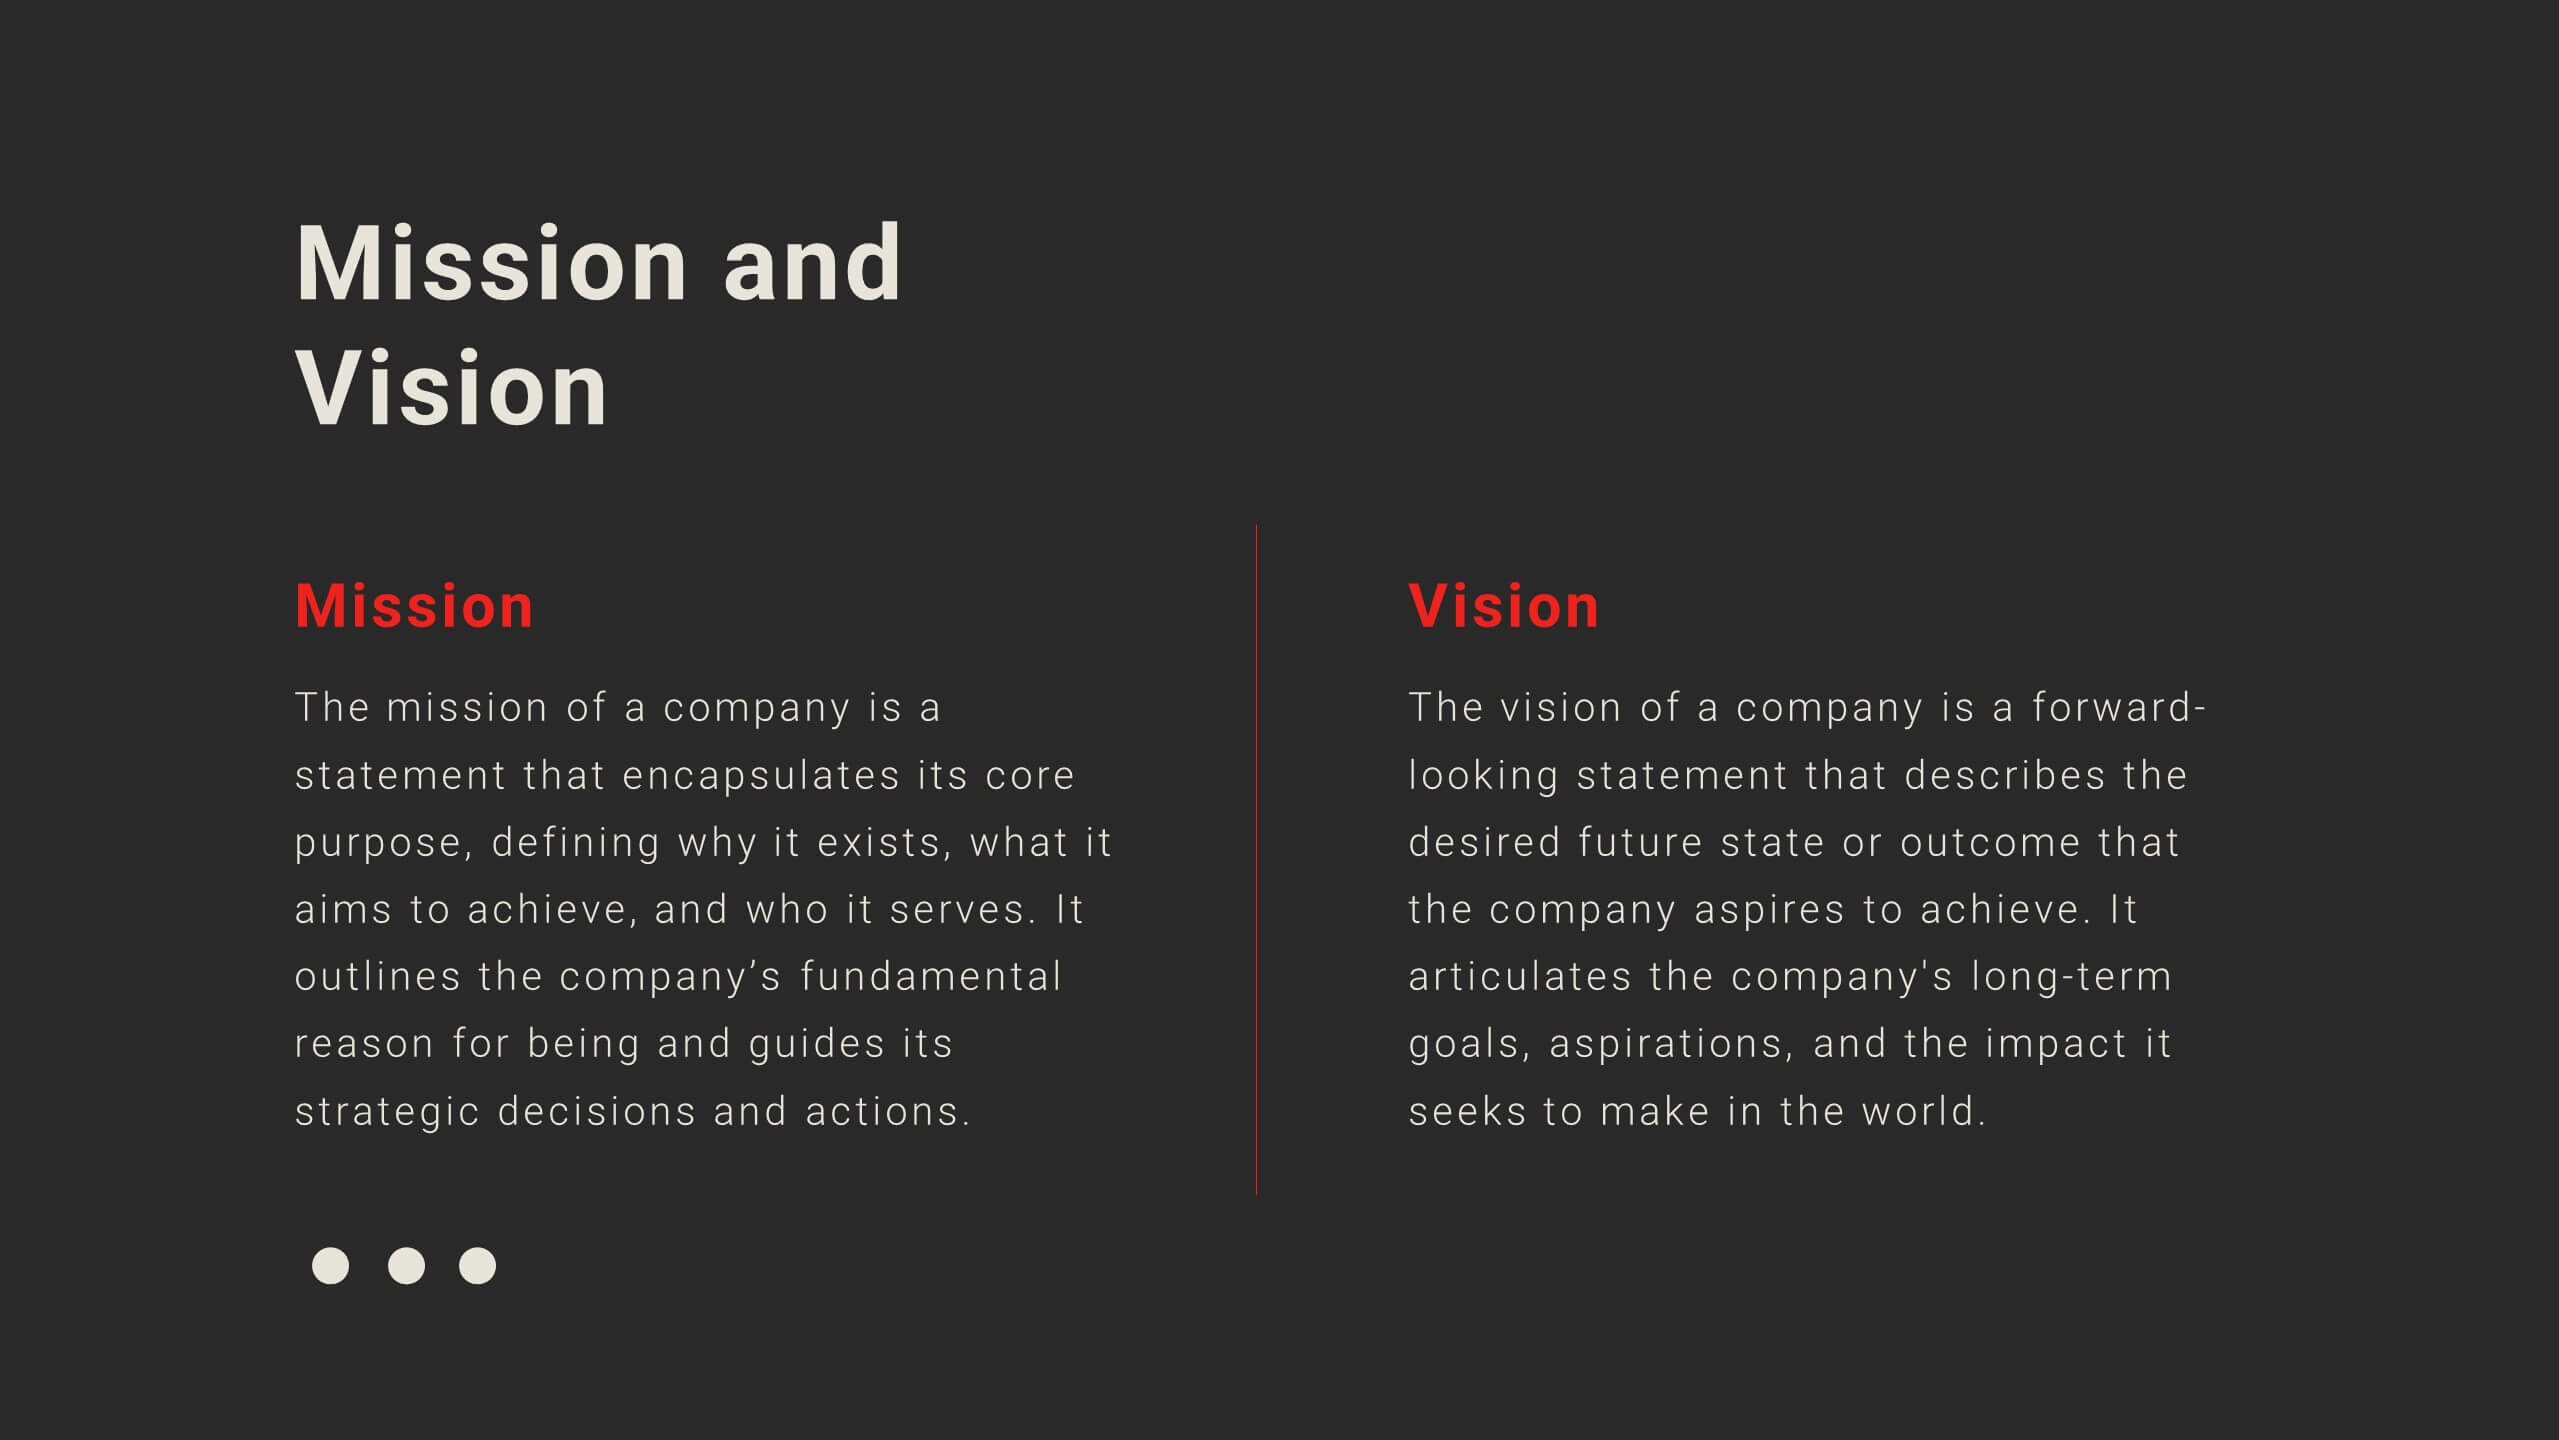
Velocity Startup Growth Plan Presentation
Accelerate your startup's growth with this dynamic plan template! Perfect for outlining your mission, vision, business model, and marketing strategy. Ideal for entrepreneurs aiming to secure funding and drive success. Compatible with PowerPoint, Keynote, and Google Slides, this template ensures your growth plan is clear, professional, and compelling. Achieve your startup goals today!


5 slides
Mind and Brain Creativity Concept Diagram Presentation
Ignite fresh thinking with the Mind and Brain Creativity Concept Diagram Presentation—a smart and visually engaging template that maps out five core concepts around a central brain icon. Each idea is linked with intuitive visuals and labeled A through E, ideal for creative strategy, innovation pitches, or mental model breakdowns. Fully customizable in PowerPoint, Keynote, and Google Slides.


21 slides
Mercurion Project Status Report Presentation
Stay on top of your project's progress with this structured and visually engaging presentation template. Covering key highlights, performance metrics, financial summaries, team productivity, and future priorities, this template helps you communicate project updates effectively. Whether for stakeholders, management, or team meetings, it provides clear insights and actionable recommendations. Fully customizable and compatible with PowerPoint, Keynote, and Google Slides.


7 slides
Concentric Circles Model Infographic Presentation
A Concentric Circle Infographic is a visual tool that represents information, data or ideas in a circular format, where each circle is centered inside the next larger circle. In this template you can use the circles to show the relationships between different elements or components, with the innermost circle representing the most important or central idea, and the outer circles representing related or peripheral ideas. Designed in Powerpoint, Keynote, and Google slides the circles in the template can be easily customized with different colors, sizes, and designs to fit your needs.