


Features
- 5 Unique slides
- Fully editable and easy to edit in Microsoft Powerpoint, Keynote and Google Slides
- 16:9 widescreen layout
- Clean and professional designs
- Export to JPG, PDF or send by email


Do you have any questions?
Recommend


10 slides
Business Planning and Risk Assessment Presentation
Visualize risk levels and strategic priorities with this matrix-style business planning template. Ideal for mapping uncertainties against impact and likelihood, it supports clear, data-driven decisions. Fully customizable in PowerPoint, Keynote, and Google Slides—perfect for risk reports, operational planning, and stakeholder communication in corporate, finance, or project management settings.

20 slides
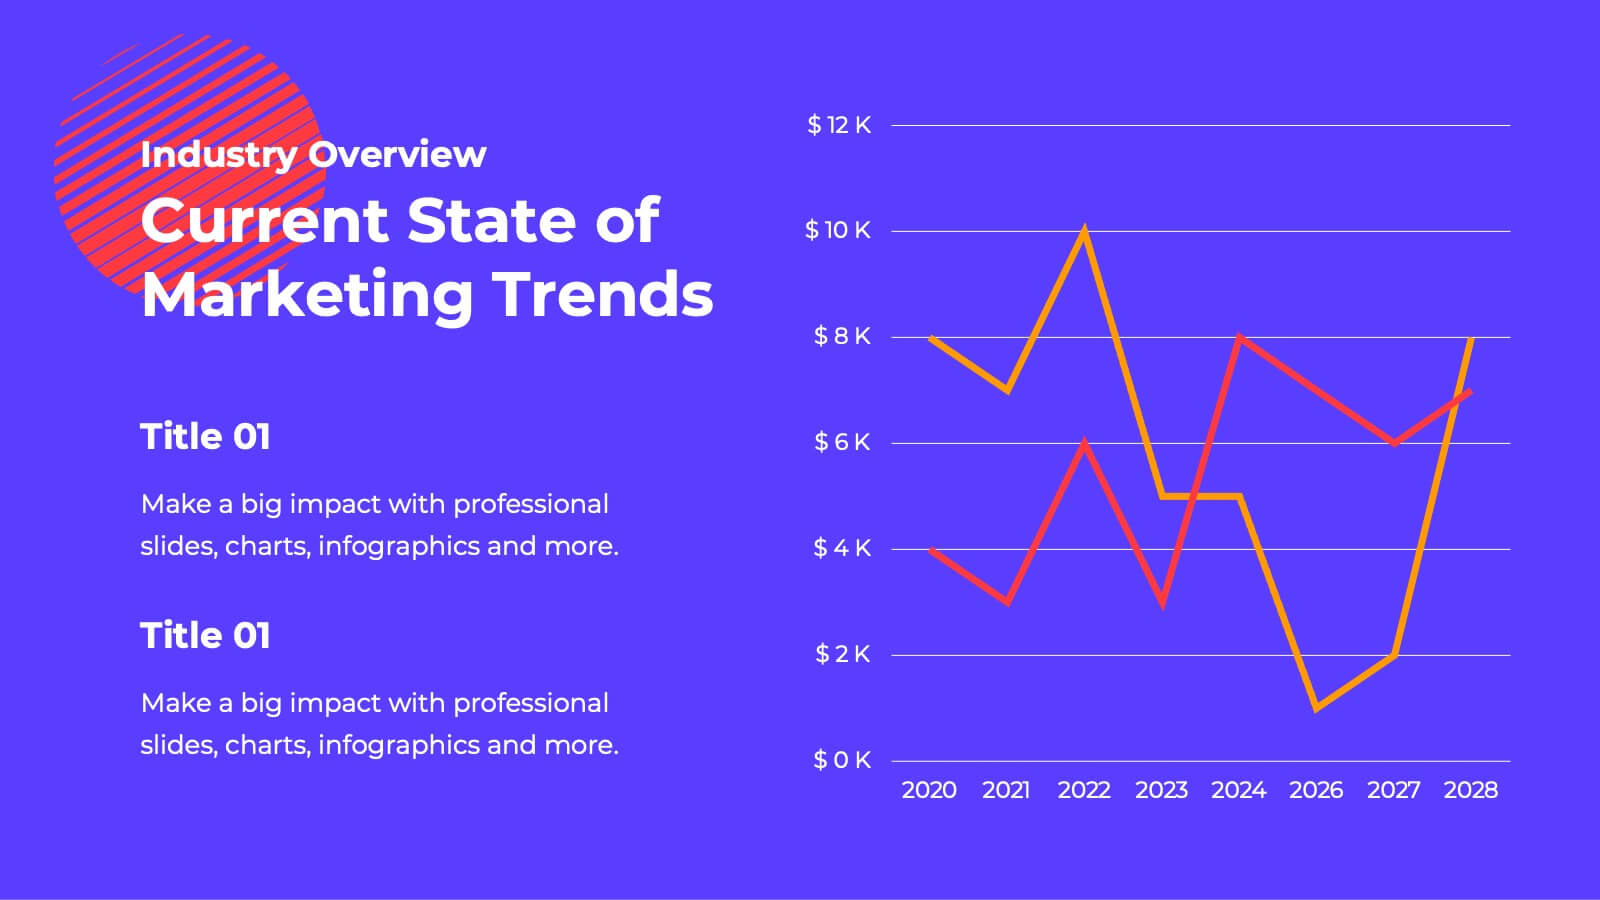
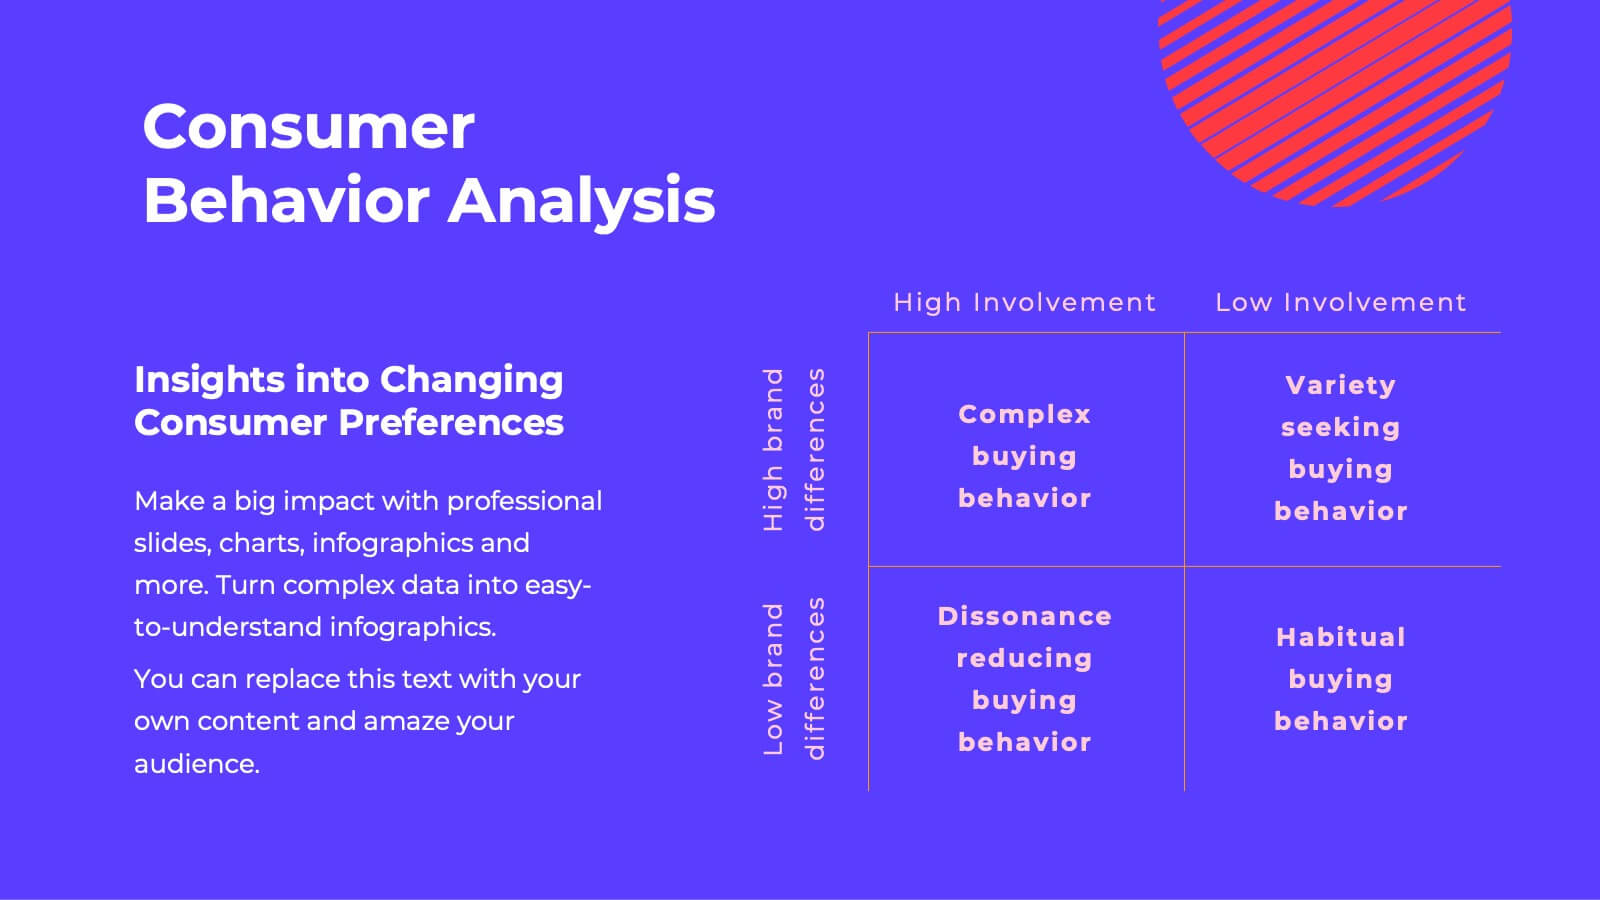
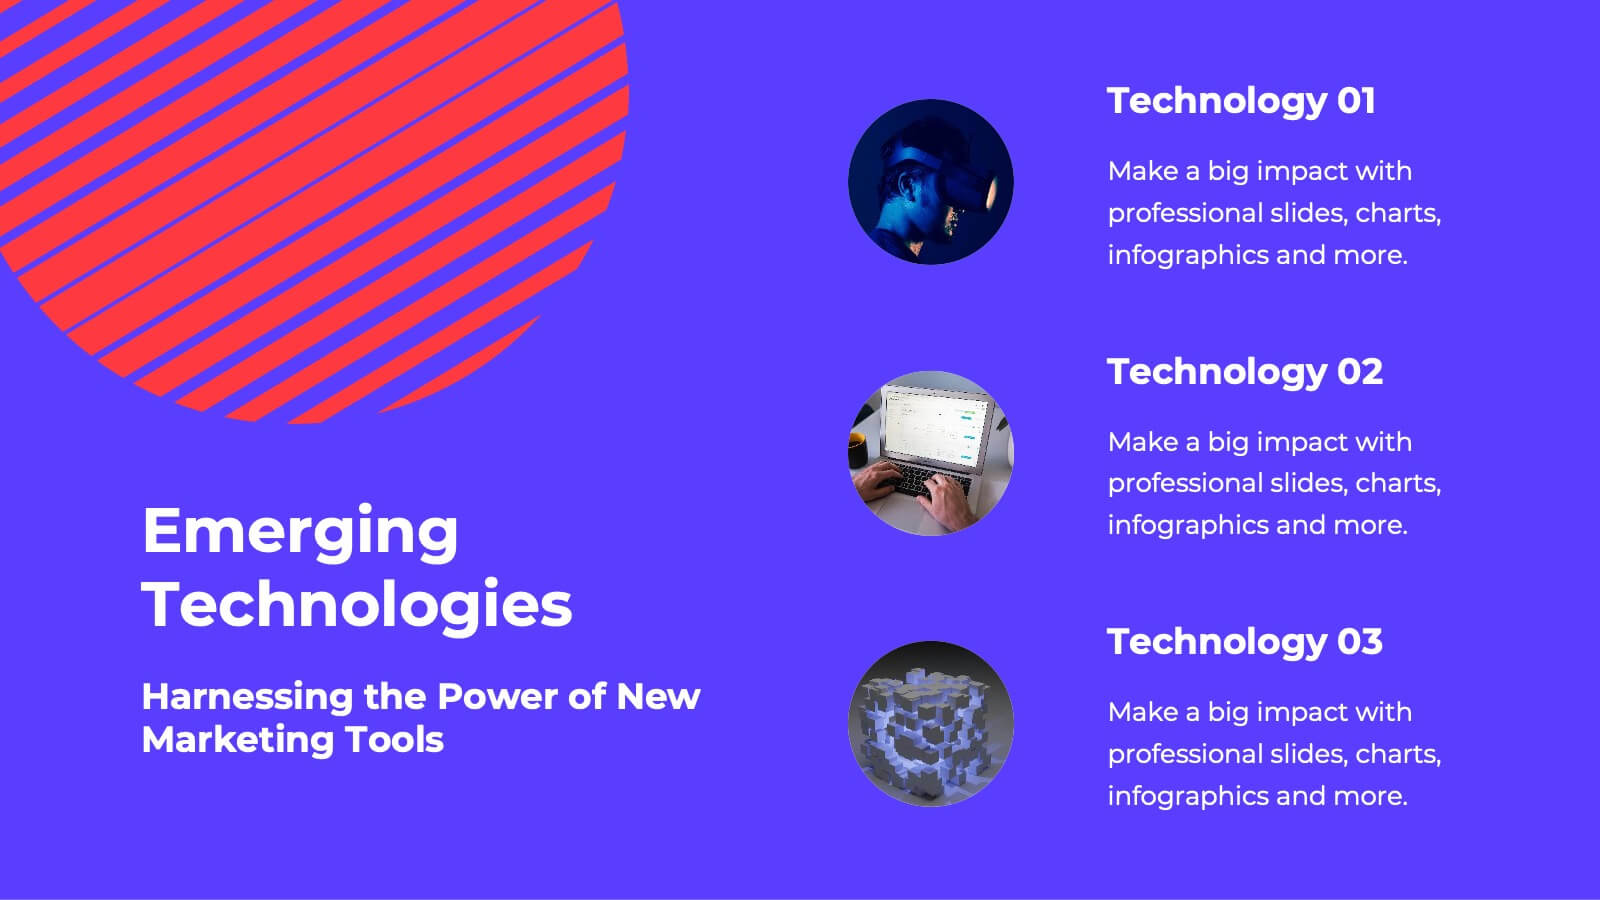
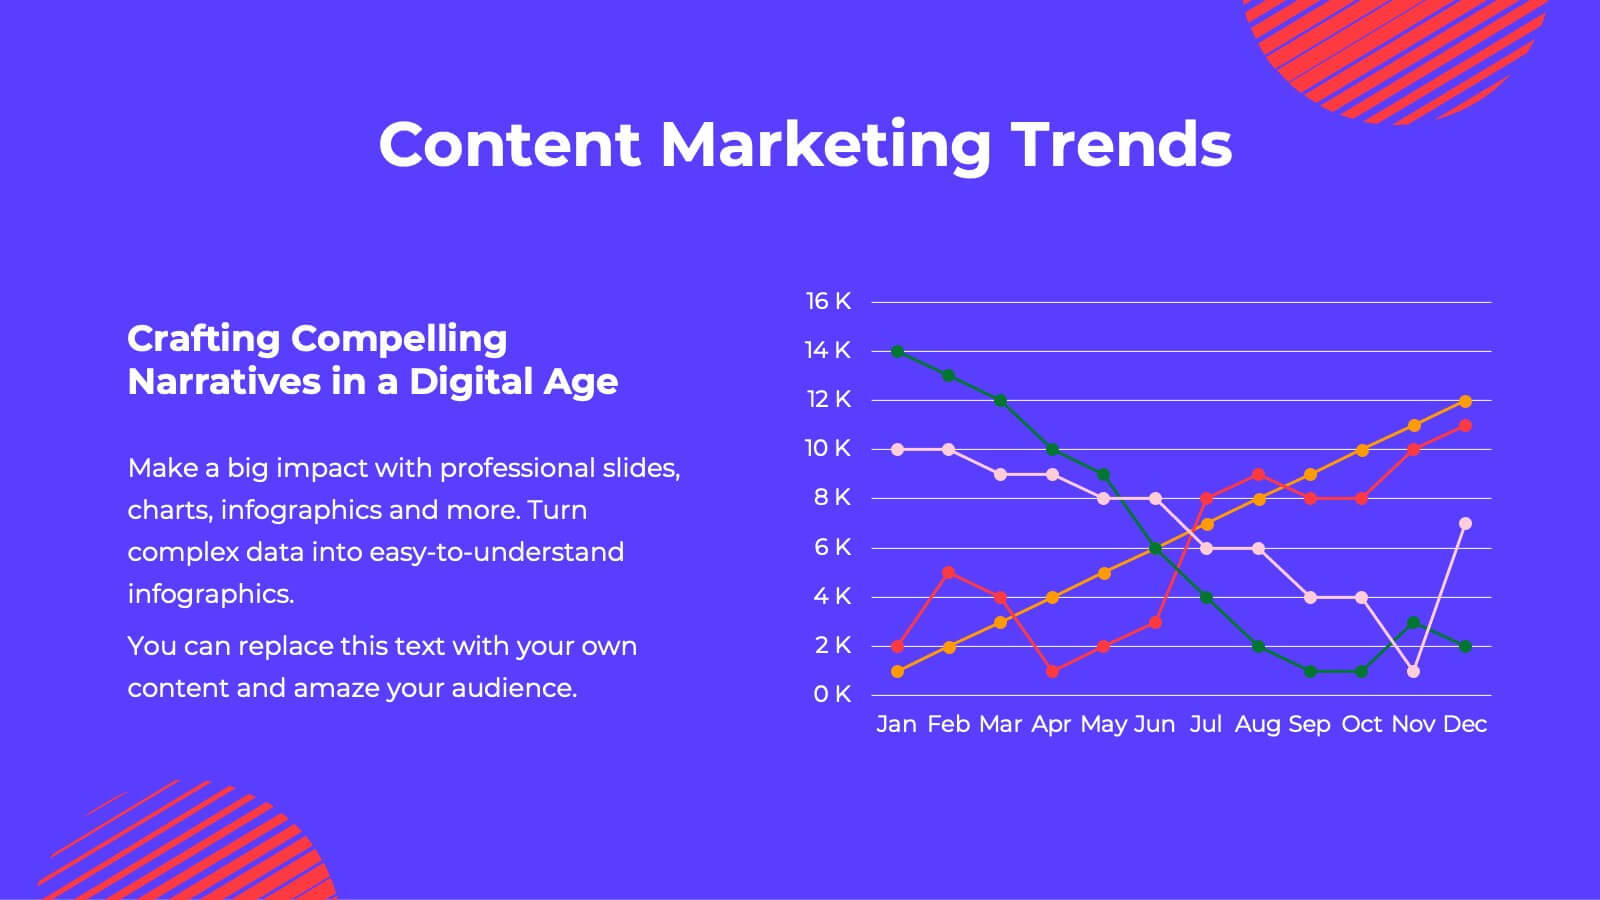
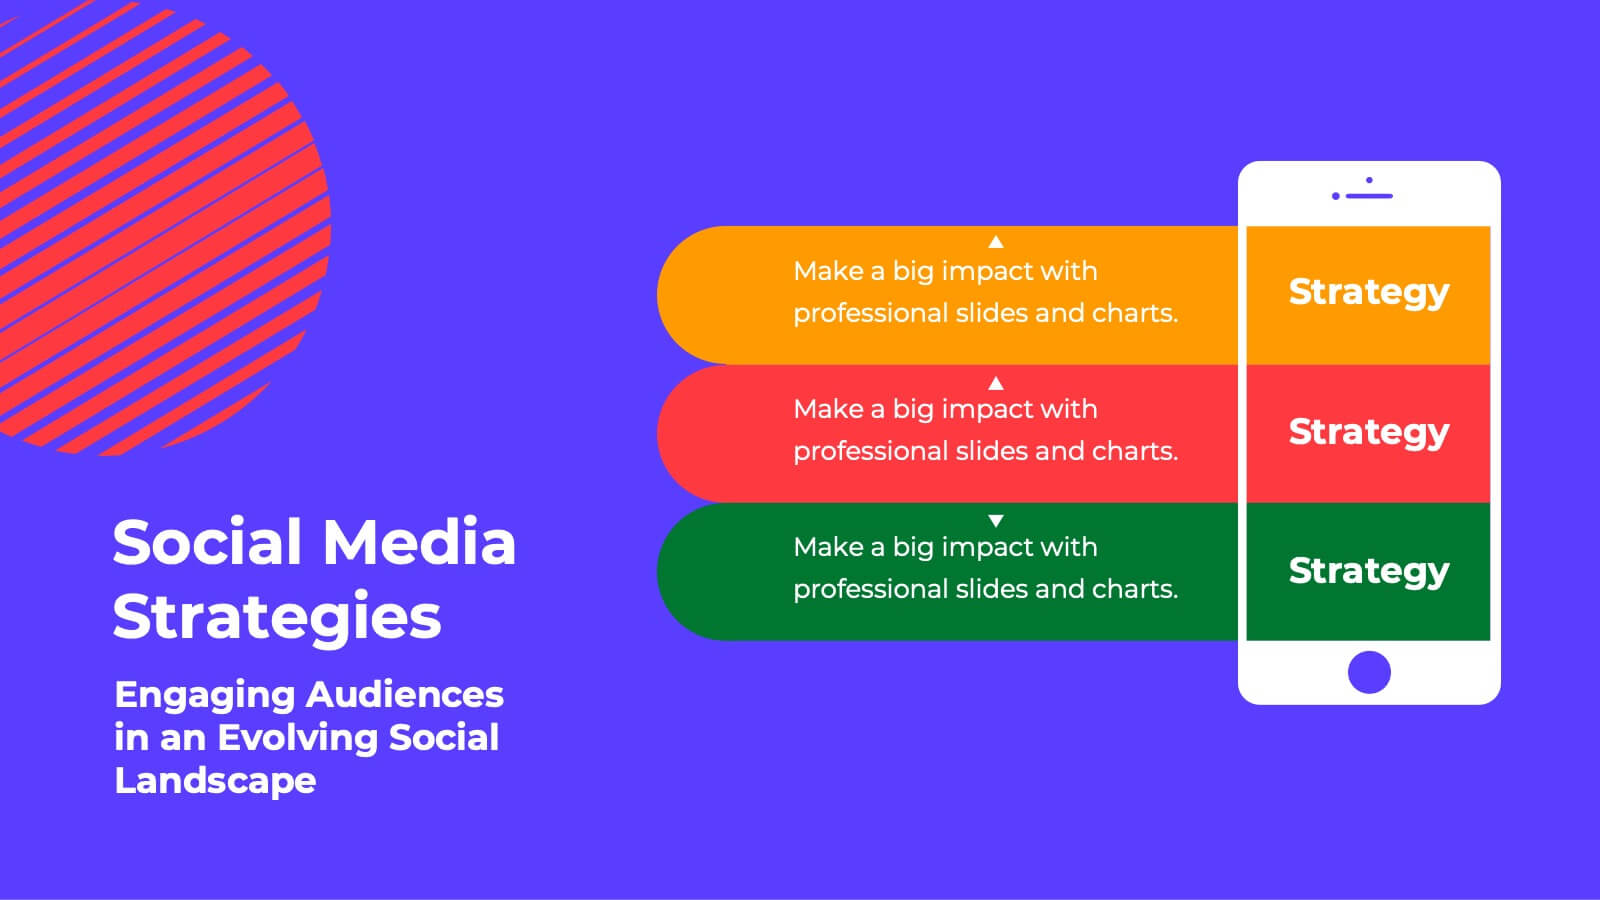
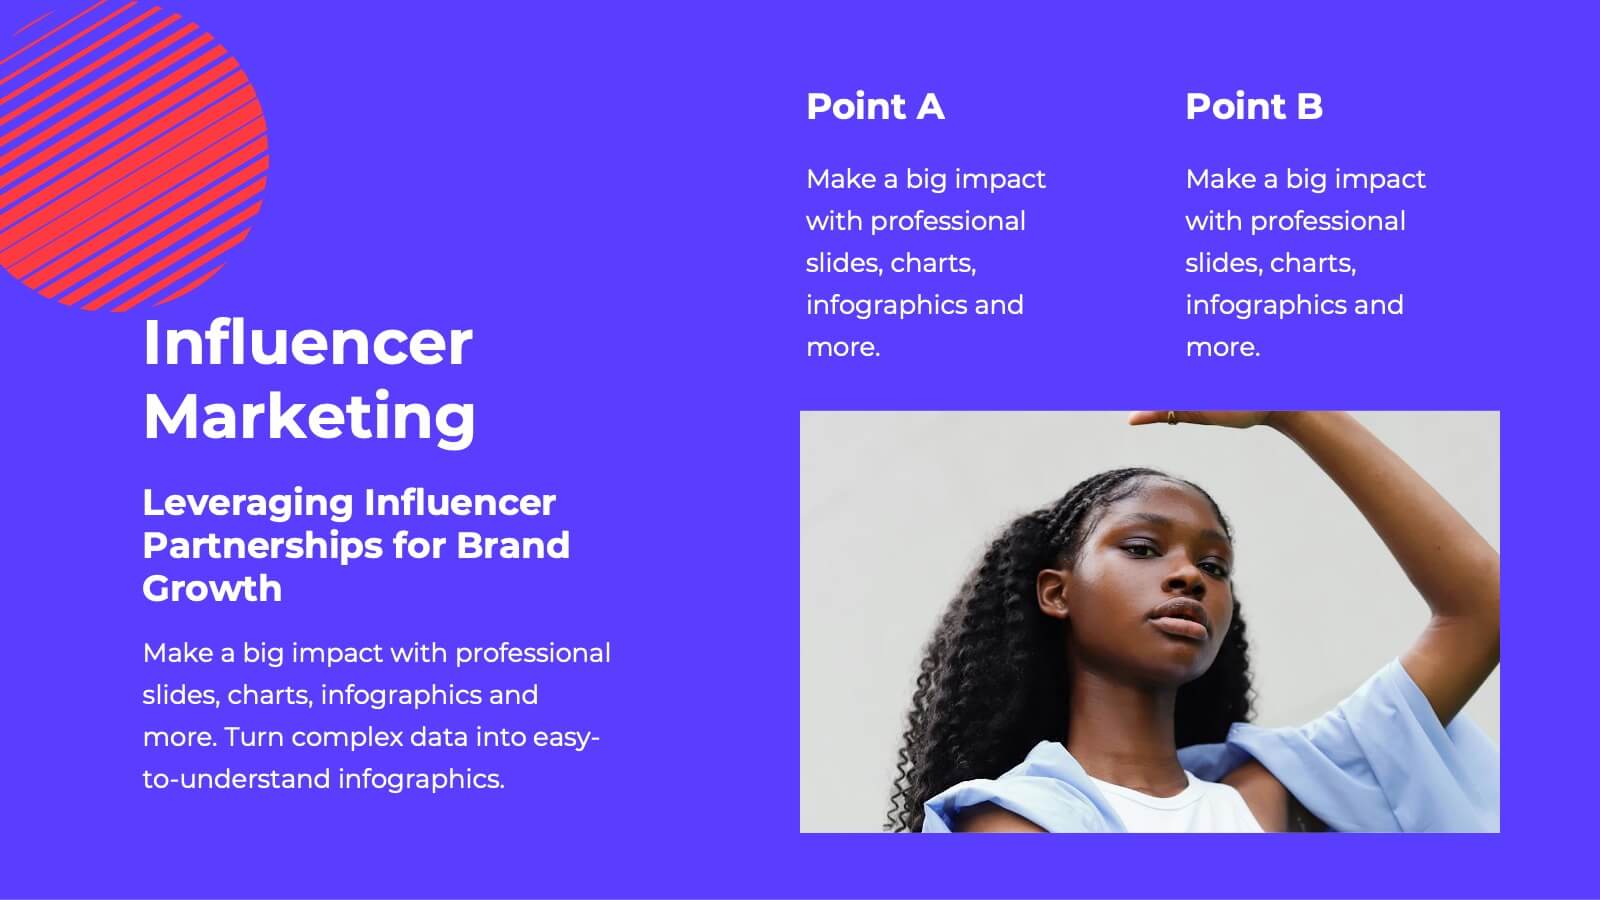
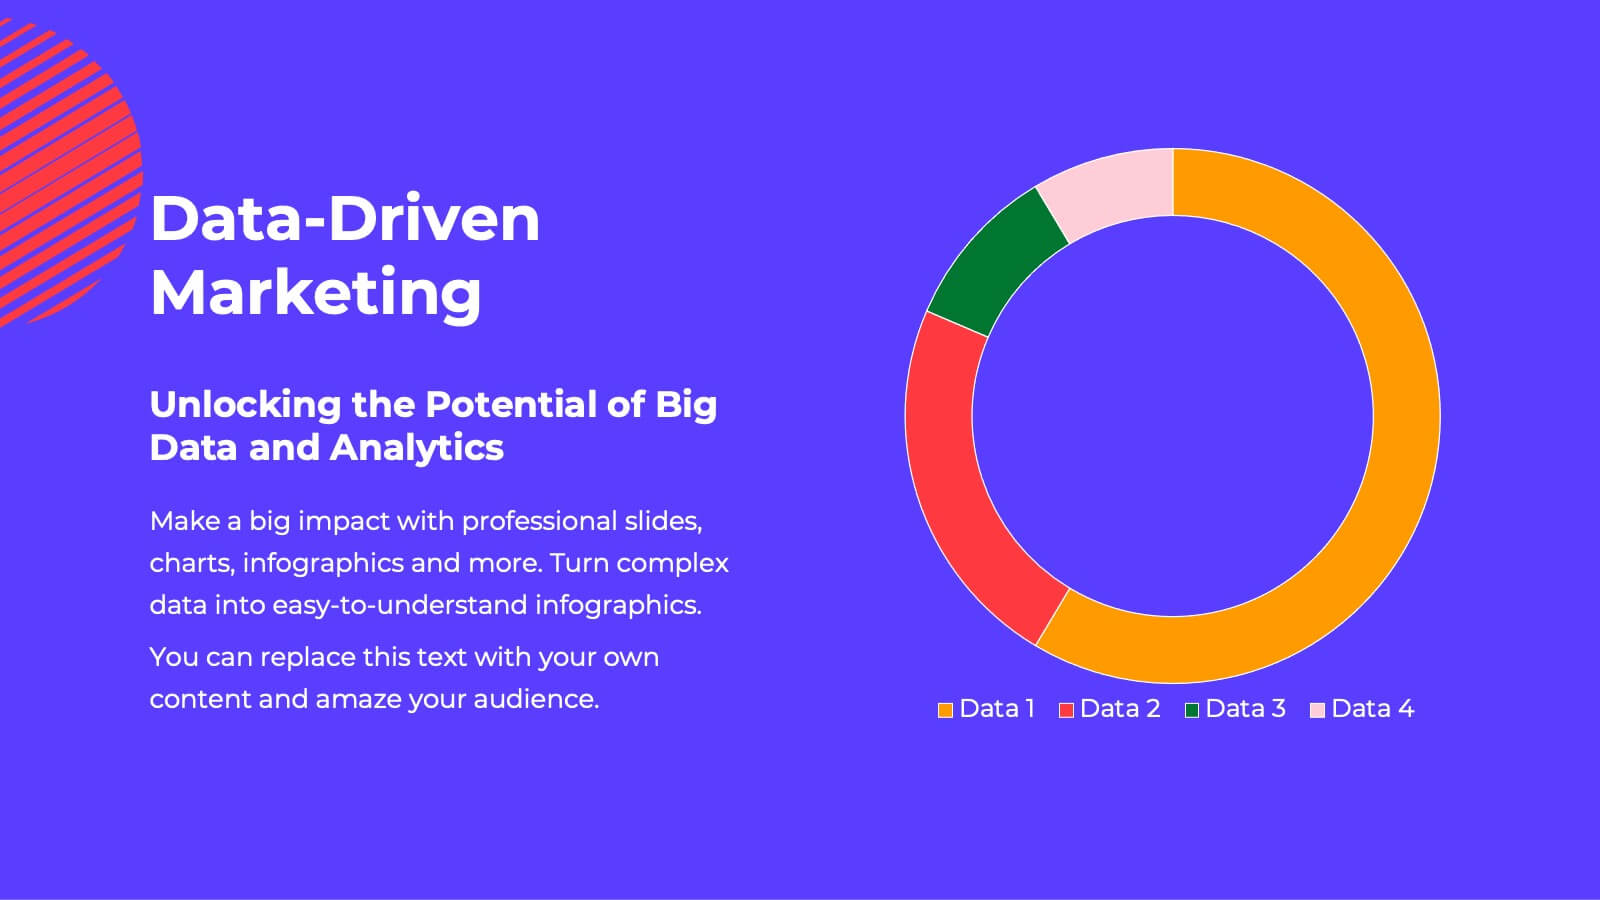
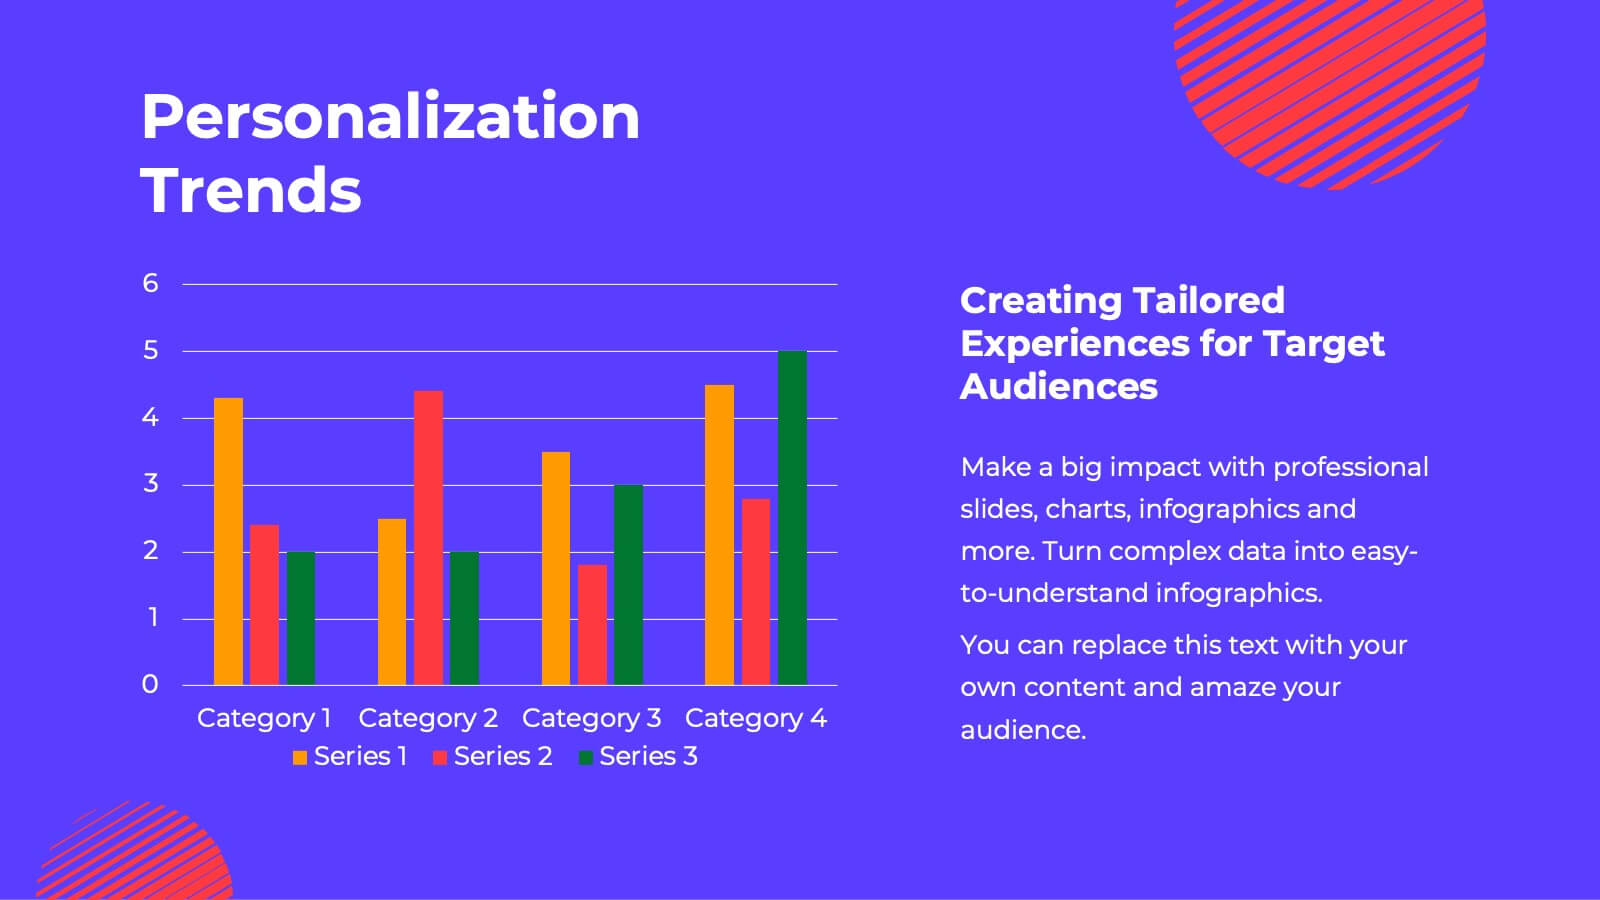
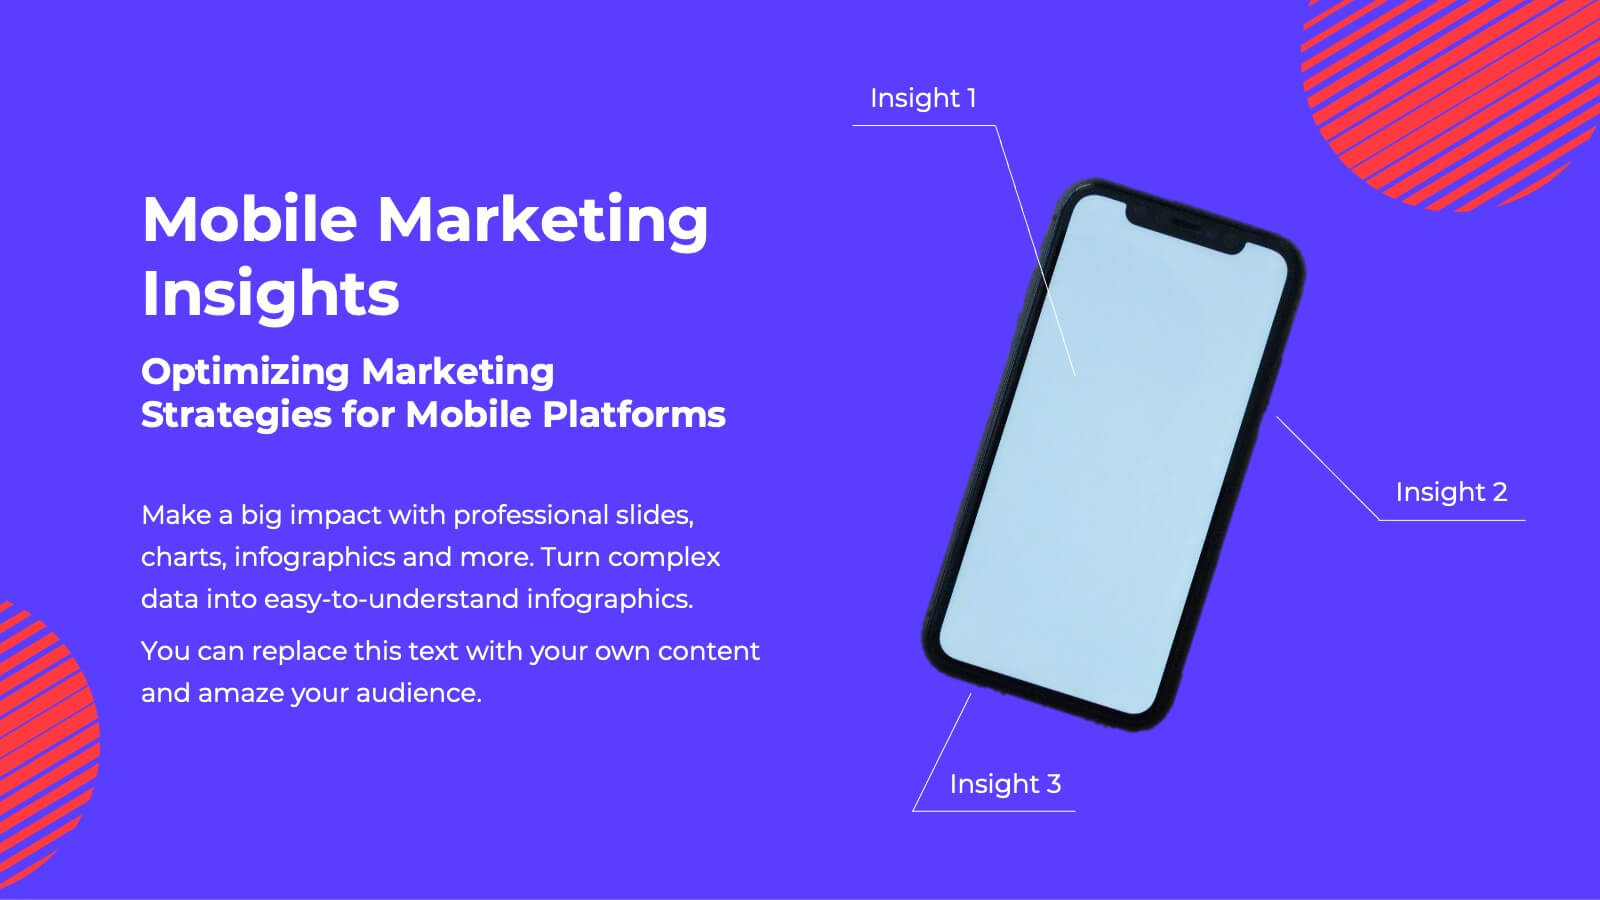
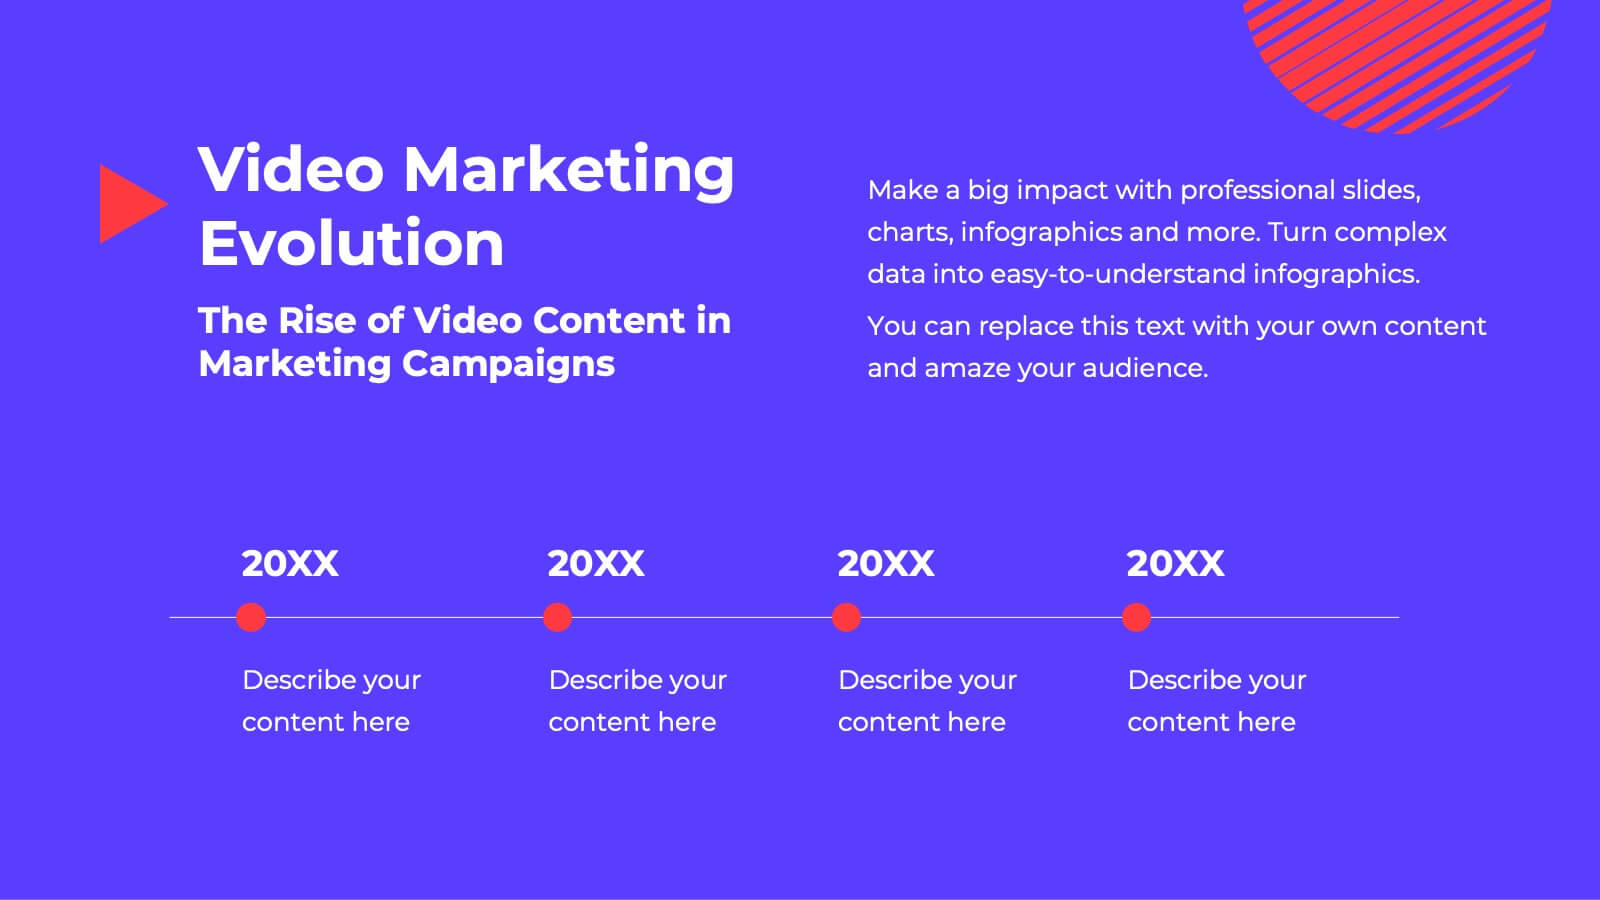
Fusion Marketing Campaign Presentation
Unleash the power of your marketing campaigns with this vibrant marketing campaign template! Dive into social media strategies, influencer marketing, data-driven insights, and more. Perfect for presenting to stakeholders and team members. Fully customizable and compatible with PowerPoint, Keynote, and Google Slides.


10 slides
Stakeholder Analysis Matrix Presentation
Spark interest from the very first slide with a clean, engaging layout designed to simplify complex relationships. This presentation helps you outline stakeholder influence, priorities, and engagement levels in a clear, structured way that supports better project decisions. Fully compatible with PowerPoint, Keynote, and Google Slides.


4 slides
Cyber Threat Prevention Strategies Presentation
Clearly communicate your cybersecurity roadmap using this sleek timeline-style slide design. Each step is represented by a distinct icon and color-coded milestone, ideal for outlining protocols such as threat detection, employee training, or system hardening. Designed for IT teams, security analysts, and corporate risk departments. Fully editable and compatible with PowerPoint, Keynote, and Google Slides.


4 slides
Sustainable Farming Practices Presentation
Explore the essentials of sustainable farming with our visually engaging presentation template. Perfect for educational and advocacy purposes, it outlines key practices that promote environmental sustainability in agriculture. This template features easy-to-understand graphics and placeholders for comprehensive discussions on eco-friendly farming techniques.


5 slides
Nonprofit Organizations Infographics
Nonprofit Organizations are organizations that are established to pursue a particular social cause or provide a service that benefits the public, rather than generate a profit. These infographic templates are designed to visually present information about nonprofit organizations. They feature bright, colorful and engaging designs with icons and illustrations that represent different aspects of nonprofit organizations, such as fundraising, volunteers, and social impact. The template includes customizable graphs and text boxes to allow users to easily present data about nonprofits, including their structure, goals, impact, and funding sources.


4 slides
Target Audience and Buyer Persona Analysis Presentation
Visually map out your core audience segments with this modern target diagram layout. This presentation features a concentric ring graphic to represent buyer personas and user data, alongside three editable text sections with icons for clear and structured insights. Ideal for marketing strategies, customer profiling, and campaign planning. Easily customizable in PowerPoint, Keynote, and Google Slides.


5 slides
Beer Industry Infographics
The beer industry refers to the production, distribution, and sale of beer, which is a popular alcoholic beverage consumed worldwide. These vertical infographics provide key insights into the beer industry. They are designed to present data, facts, and trends in a visually engaging format, making it easy for viewers to understand and retain the information. The infographics feature a captivating design with beer-themed visuals, vibrant colors, and appealing typography. The visuals are carefully chosen to represent different aspects of the beer industry and create a cohesive and visually appealing infographic.


8 slides
Employee Performance Review Presentation
Assess and visualize team performance effectively with these "Employee Performance Review" presentation templates. Crafted to simplify performance analysis, these slides allow you to pinpoint strengths and areas for improvement through clear, sequential visual layouts. They are perfect for managers looking to foster growth and productivity, and are fully compatible with PowerPoint, Keynote, and Google Slides.


21 slides
Mystorin Market Analysis Report Presentation
Present your market analysis findings with this sleek and professional report presentation template. Covering essential sections such as key highlights, performance metrics, competitor insights, and strategic initiatives, it provides a comprehensive framework for data-driven decisions. Ideal for businesses and analysts. Compatible with PowerPoint, Keynote, and Google Slides for easy customization.


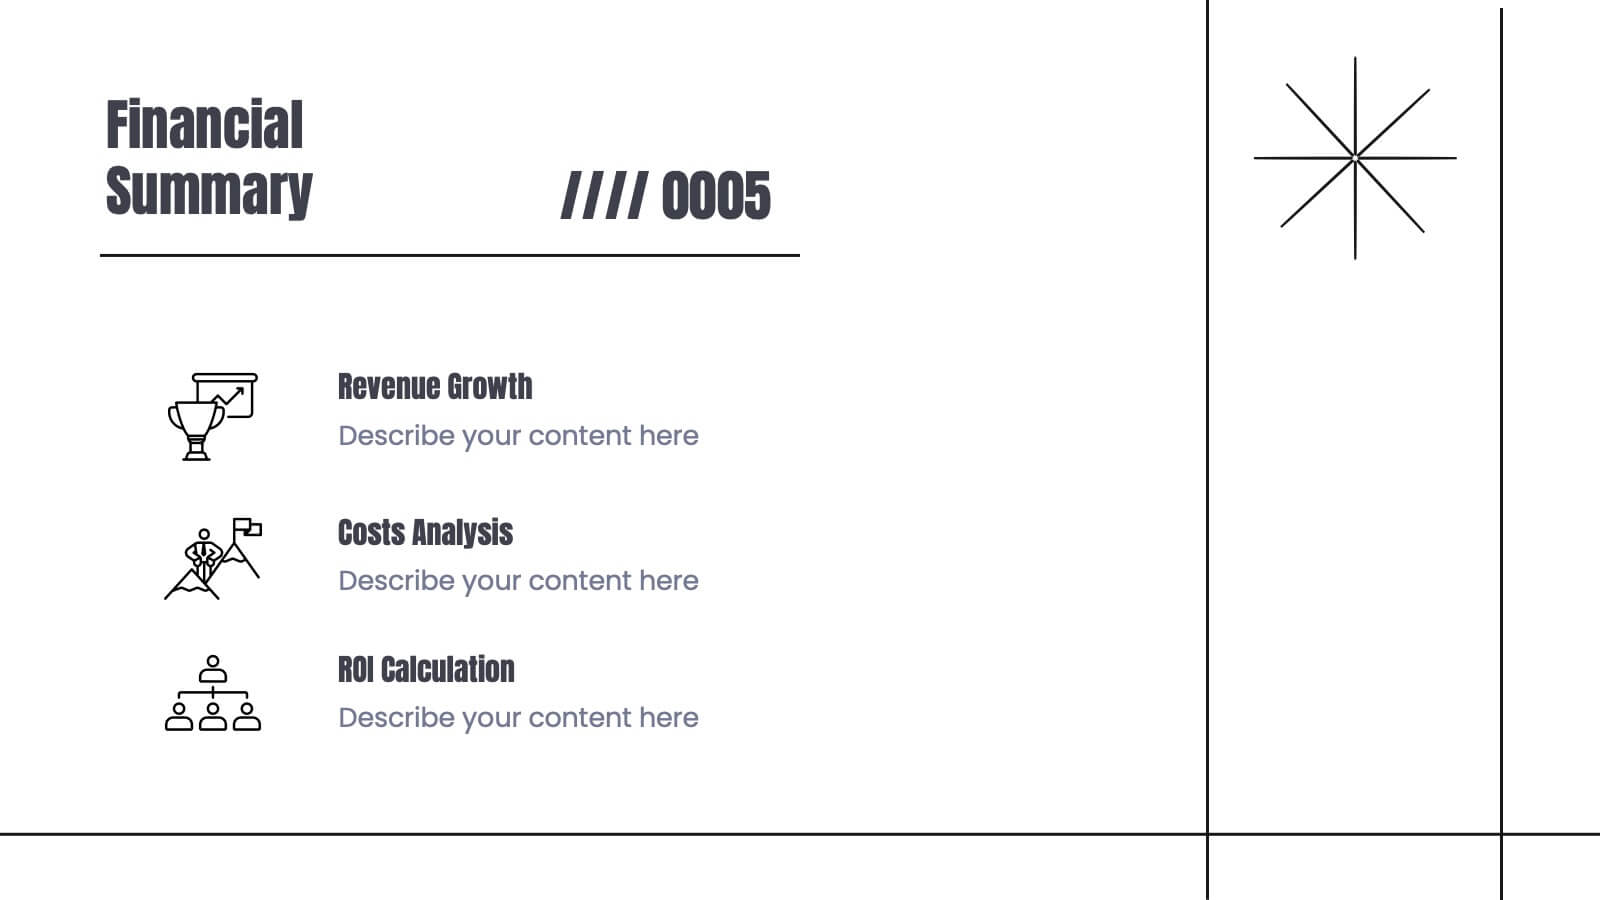
7 slides
Business Strategy with 7S Model
Clearly map out your organizational alignment using this Business Strategy with 7S Model template. Perfect for strategy consultants, leadership teams, and business educators, it illustrates the interconnectedness of structure, strategy, systems, style, staff, skills, and shared values. Fully customizable in PowerPoint, Keynote, and Google Slides.


5 slides
Corporate Teamwork and People Focus
Show how every team member powers success with this people-centered visual designed to highlight collaboration, roles, and interconnected efforts. Ideal for HR briefings, corporate values, or teamwork strategies, this gear-inspired layout places individuals at the heart of progress. Fully compatible with PowerPoint, Keynote, and Google Slides.


5 slides
Identifying Core Issues with Cause Mapping Presentation
Pinpoint the origin of your challenges with the Identifying Core Issues with Cause Mapping Presentation. This diagram is designed to break down problems step-by-step using a clean, logical flow format. Ideal for root cause analysis, risk reviews, and strategic audits, it helps teams visualize contributing factors and map out relationships. Fully editable in PowerPoint, Keynote, and Google Slides.


5 slides
Water Problems Infographics
Water Problems refer to the various issues that arise due to the scarcity, pollution, or mismanagement of water resources. These vertical infographics are perfect for addressing various issues related to water management and conservation. They are effective tools for raising awareness about water-related issues and promoting sustainable water management practices. This template is completely customizable and includes various icons and images related to water such as water droplets, faucets, and ocean waves. The color scheme is predominantly blue, signifying the importance of water conservation and preservation.


7 slides
Company Profile Infographic
This collection of company profile templates is designed to meet the diverse needs of various businesses, providing an efficient and polished method for presenting a company's identity, accomplishments, and offerings. Each template is meticulously crafted to cater to different professional contexts, making them suitable for annual reports, investment summaries, or internal briefings. Structured for clarity, these templates enable businesses to effectively communicate essential details such as company history, objectives, and the breadth of services or products offered. They are also equipped to showcase crucial statistics like employee numbers, significant achievements, and organizational hierarchy, enhancing the overall presentation. The design blends modern aesthetics with functionality, incorporating a professional color palette and clean layout that holds viewer interest and enhances readability. Customization is straightforward, allowing for easy adjustments in colors, fonts, and design elements to align with specific brand identities. Ideal for corporations looking to convey their market stance and engage potential clients, investors, or prospective employees, these templates serve as a vital tool in creating impactful and informative company profiles.


7 slides
World Map Infographic Presentation Template
The world map includes 195 recognized countries around the globe. This geographic world map template includes detailed background information and facts on each country, with flags and outline images of each country. You can easily see where all 195 countries are located on this map, and which countries share borders with each other. This overall template design is easy to read and highly informative for any geography enthusiast who wants to learn more about the different countries in the world. This World map template include all continents, regions of the world, oceans and seas.


7 slides
Aviation Terms Infographic
Take flight with our aviation terms infographic, designed with a serene palette of white, blue, and hints of orange that echo the hues of the sky. This meticulously crafted infographic decodes the intricate jargon of the aviation world, making it a breeze for enthusiasts, trainees, and even seasoned aviators to grasp. Ideal for flight schools, airline training programs, and aviation seminars, this infographic simplifies complex terminologies with ease. With full compatibility across PowerPoint, Keynote, and Google Slides, sharing your knowledge of the skies has never been more accessible or visually appealing.