


Features
- 4 Unique slides
- Fully editable and easy to edit in Microsoft Powerpoint, Keynote and Google Slides
- 16:9 widescreen layout
- Clean and professional designs
- Export to JPG, PDF or send by email


Do you have any questions?
Recommend


7 slides
5G Mobile infographic Presentation
5G technology is important because it has the potential to transform the way we live, work, and interact with the world around us. This template is designed to help you create an eye catching and informative infographic on the topic of 5G technology. With this template, you can easily showcase the benefits and capabilities of 5G in an easy to understand way. This template features a vibrant and clean design, with uniquely selected color schemes and fonts to ensure that the content is visually appealing. It includes a variety of slide layouts, including text slides, images, charts and graphs!


6 slides
Business Decision Venn Diagram Presentation
Make complex decision-making simple and visually impactful with this Business Decision Venn Diagram Presentation. Featuring a bold triangular layout with six segmented areas, this slide is ideal for presenting overlapping factors, interconnected strategies, or priority zones. Perfect for business planning, competitive analysis, or project evaluation. Fully editable in PowerPoint, Keynote, and Google Slides for seamless integration into your presentations.


10 slides
Teamwide Business Implementation Plan Presentation
Visualize your implementation roadmap with this team-focused progress slide. Featuring circular avatars, percentage bars, and milestone titles, it’s ideal for highlighting departmental progress or execution timelines. Fully editable in PowerPoint, Keynote, and Google Slides—perfect for internal updates, leadership reviews, or showcasing collaborative performance across business functions.


7 slides
Productivity Comparison Infographic
Step into the dynamic realm of efficiency with our Productivity Comparison Infographic. Set against a pristine white backdrop, the palette dances with the invigorating energy of orange, the reliability of blue, and the fervor of red. This lively template boasts engaging infographics, custom-designed icons, and adaptable image placeholders that vividly illustrate the highs and lows of productivity metrics, tools, and strategies. Expertly crafted for Powerpoint, Keynote, or Google Slides. A must-have for business analysts, team leads, productivity coaches, or any professional keen on spotlighting productivity contrasts.


21 slides
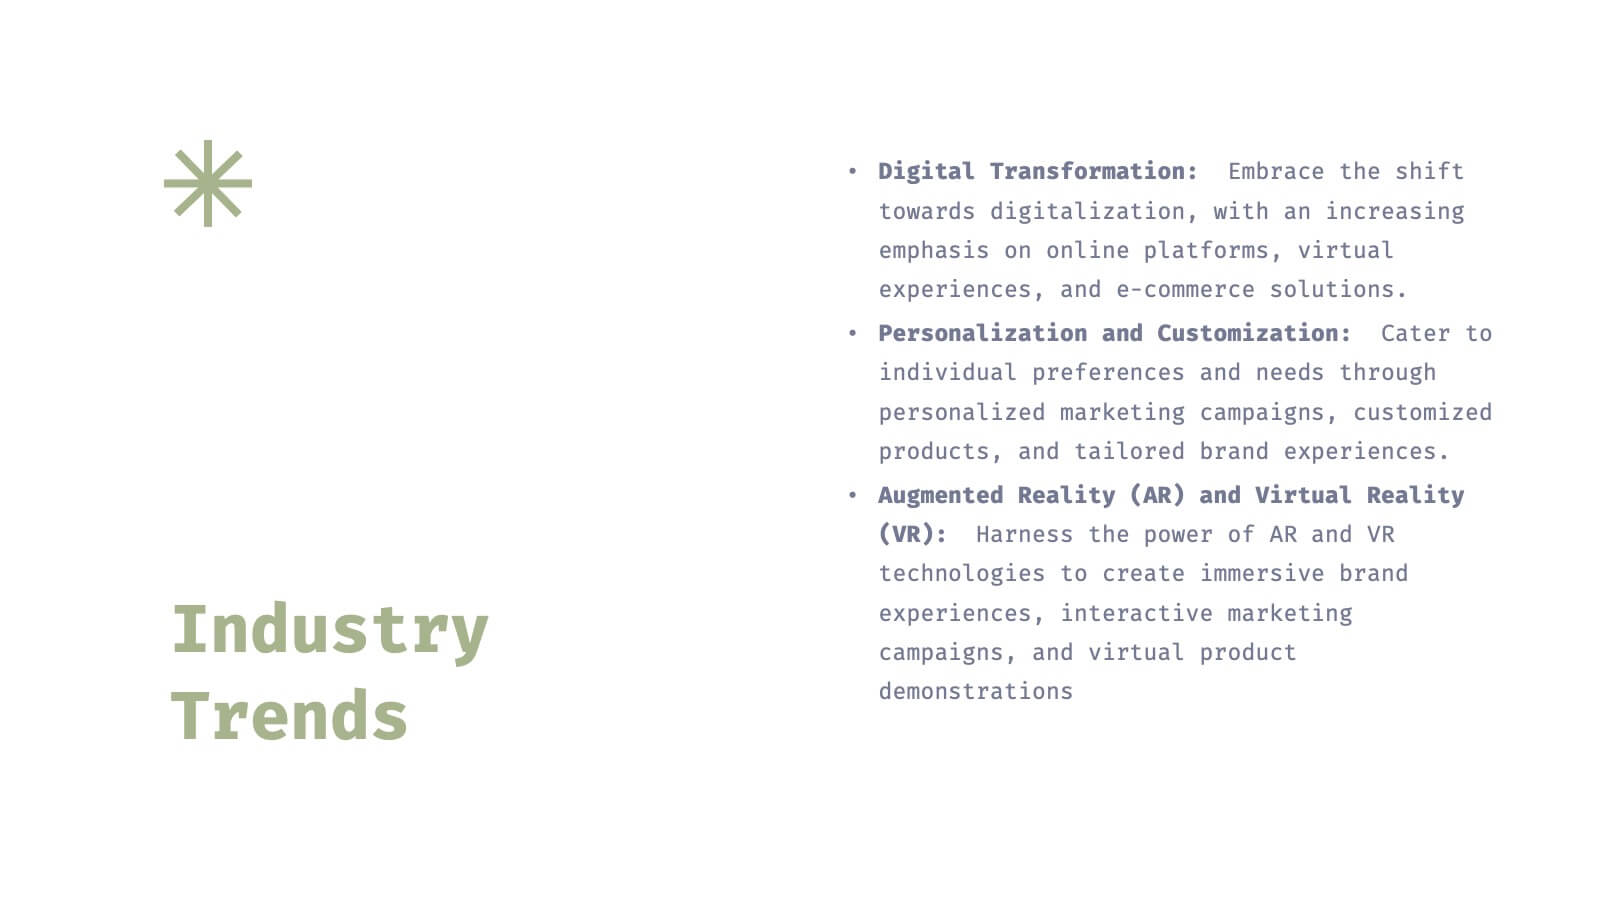
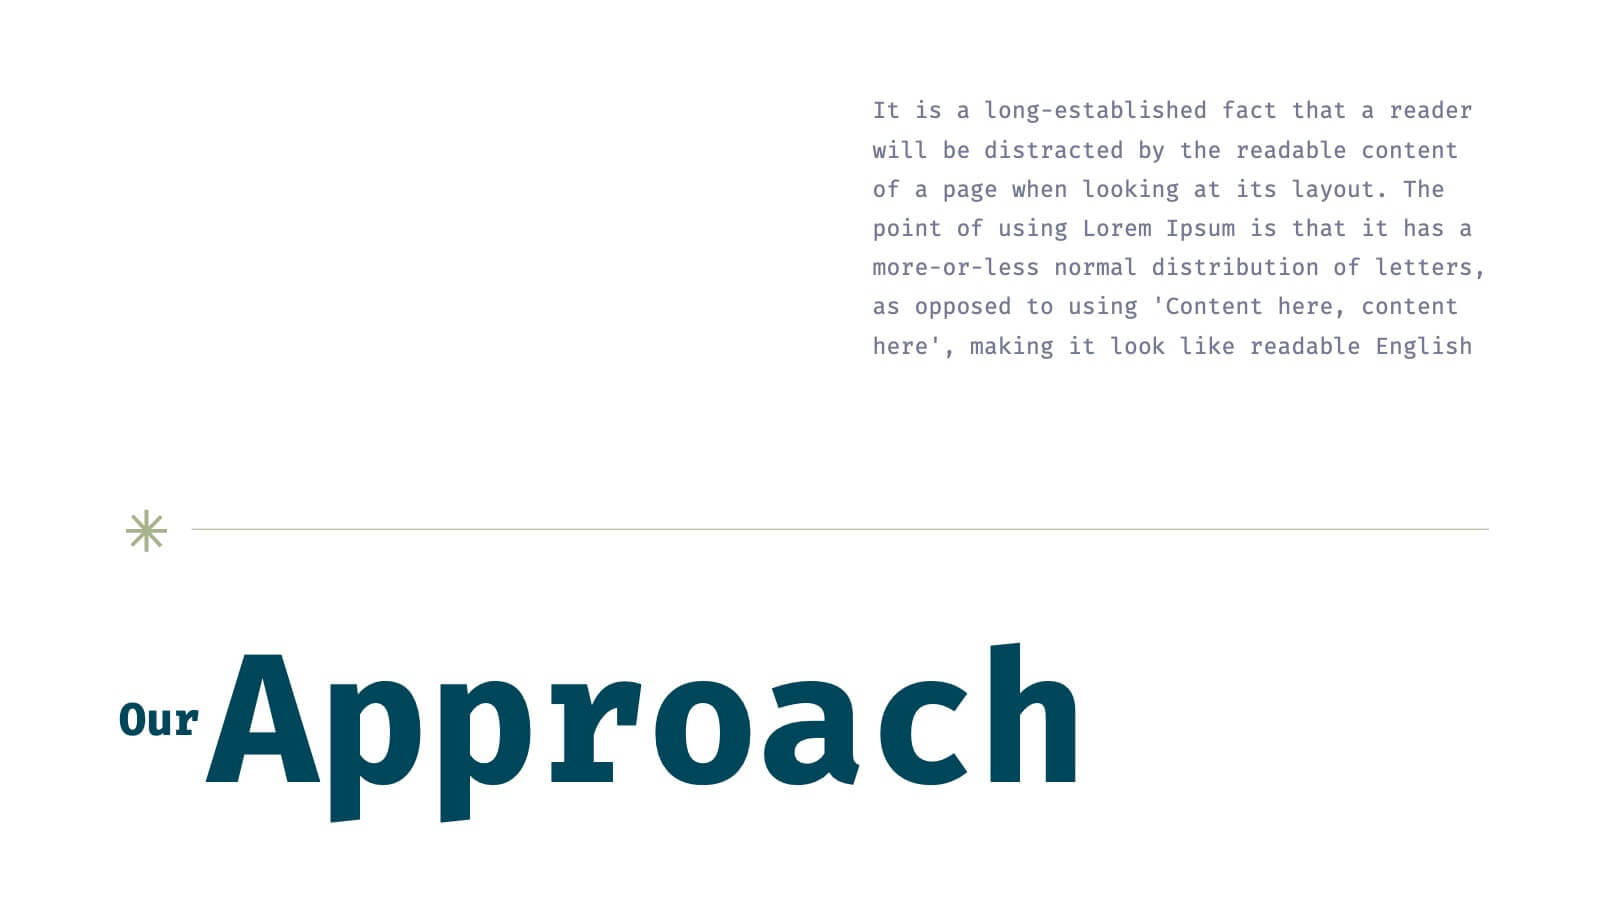
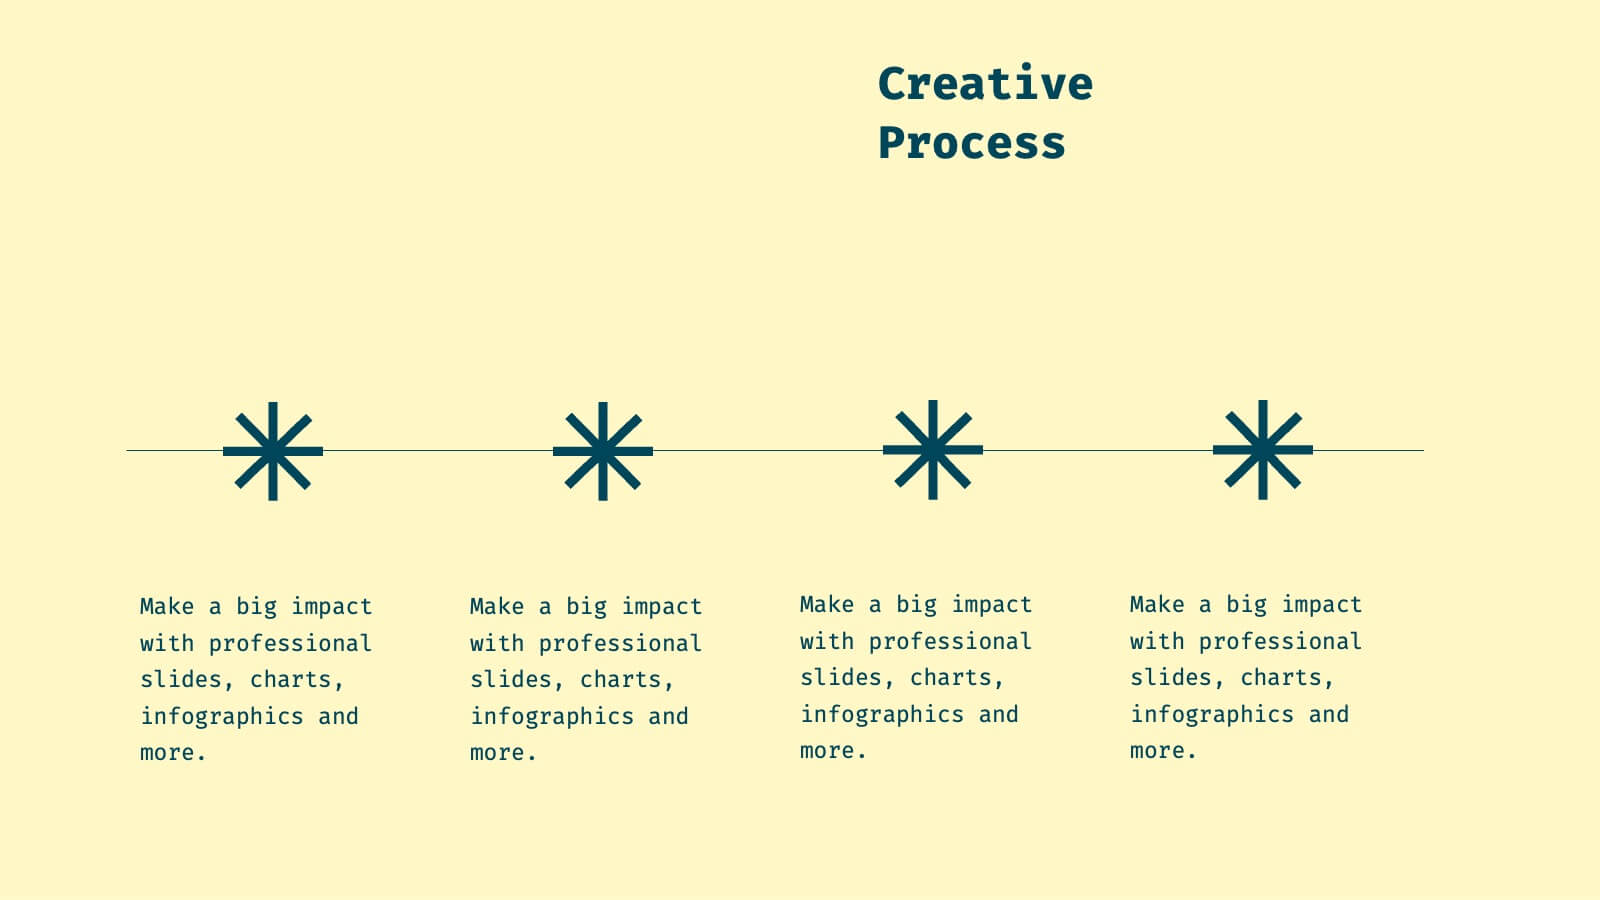
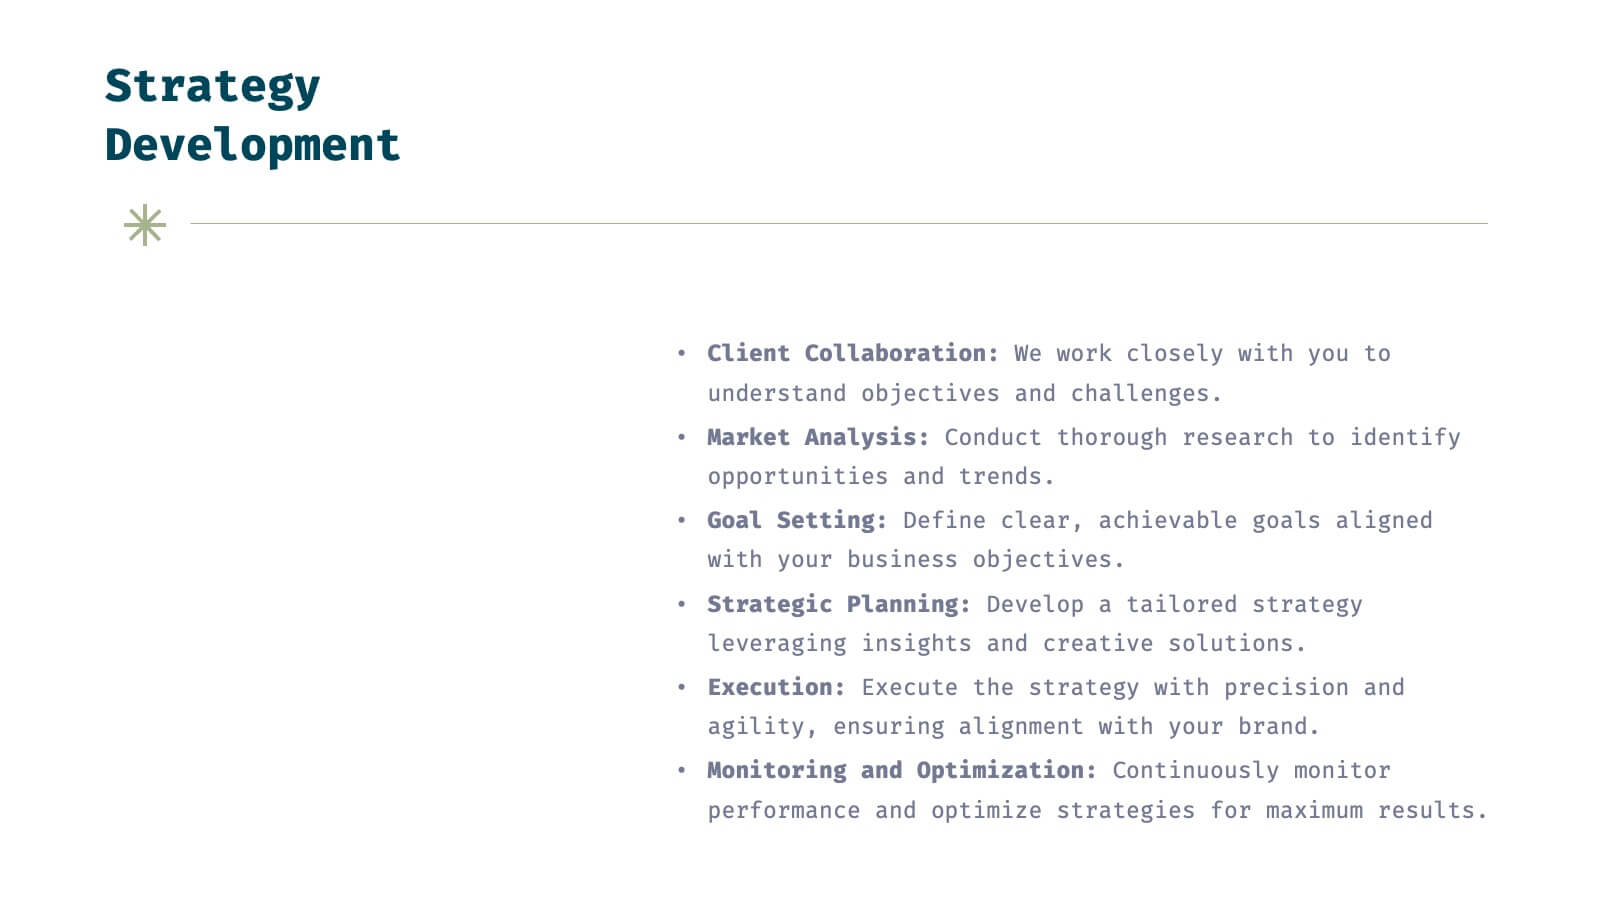
Helix Full-Service Agency Project Plan Presentation
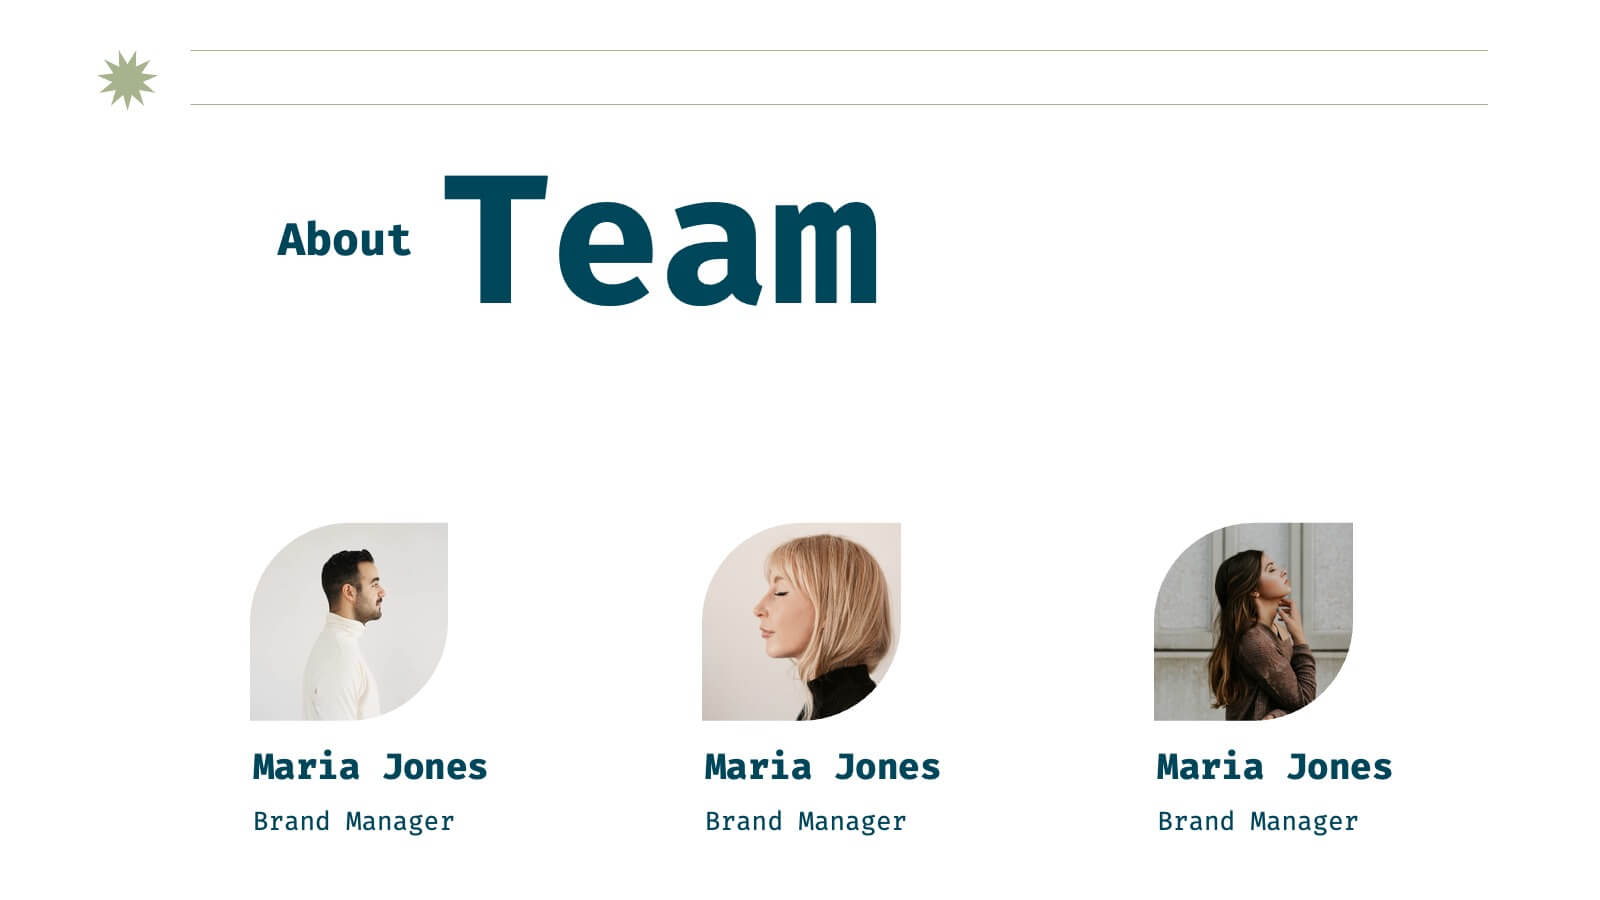
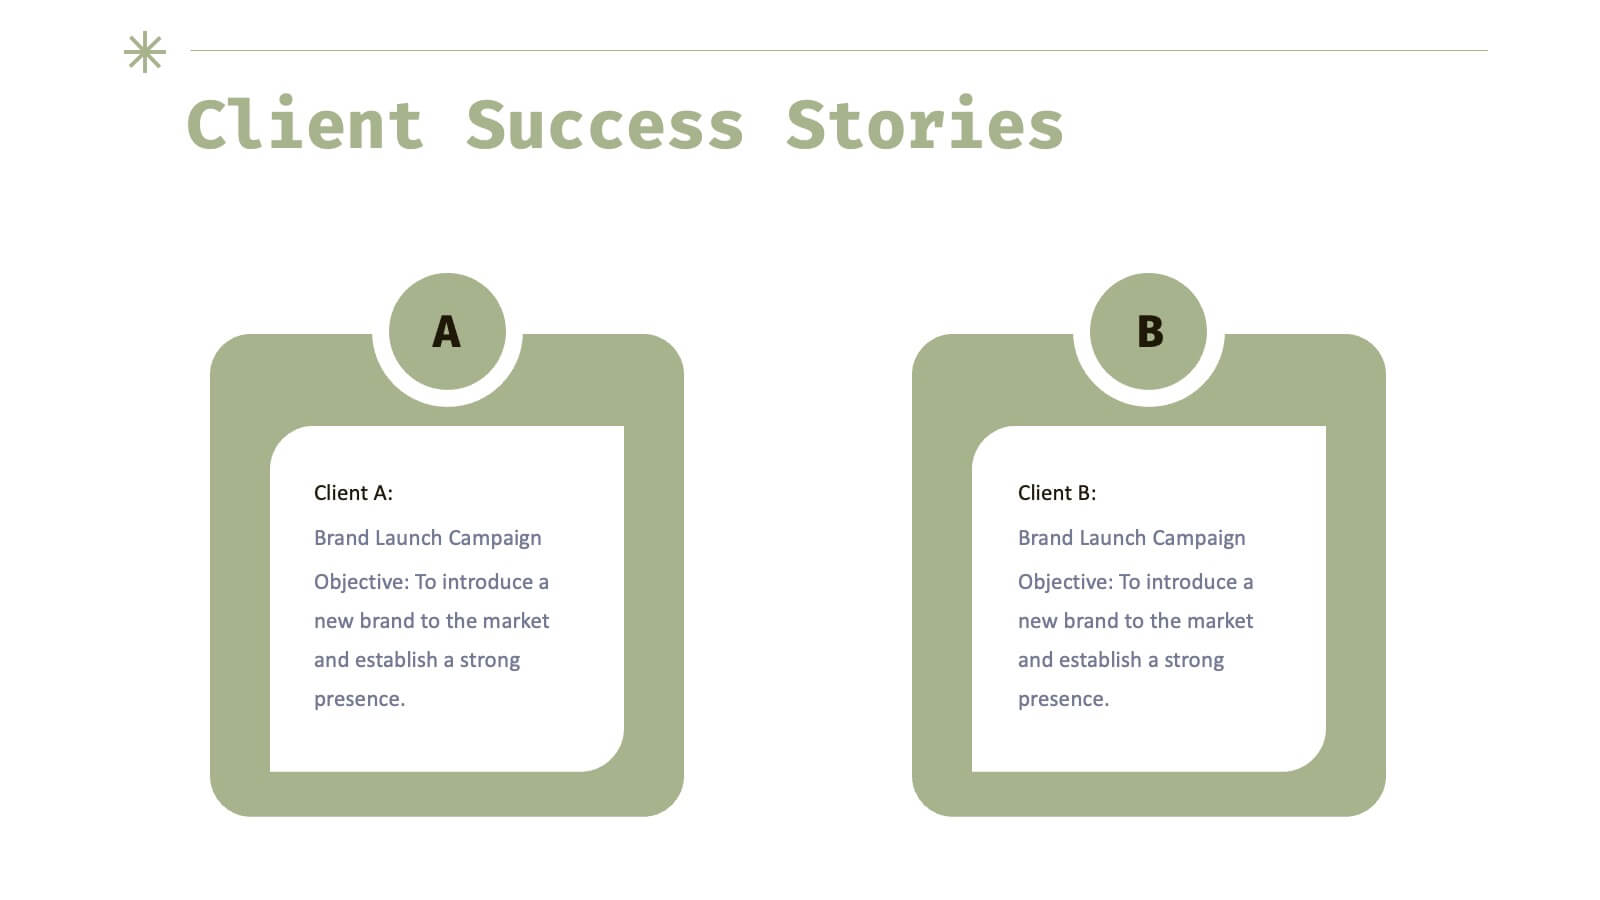
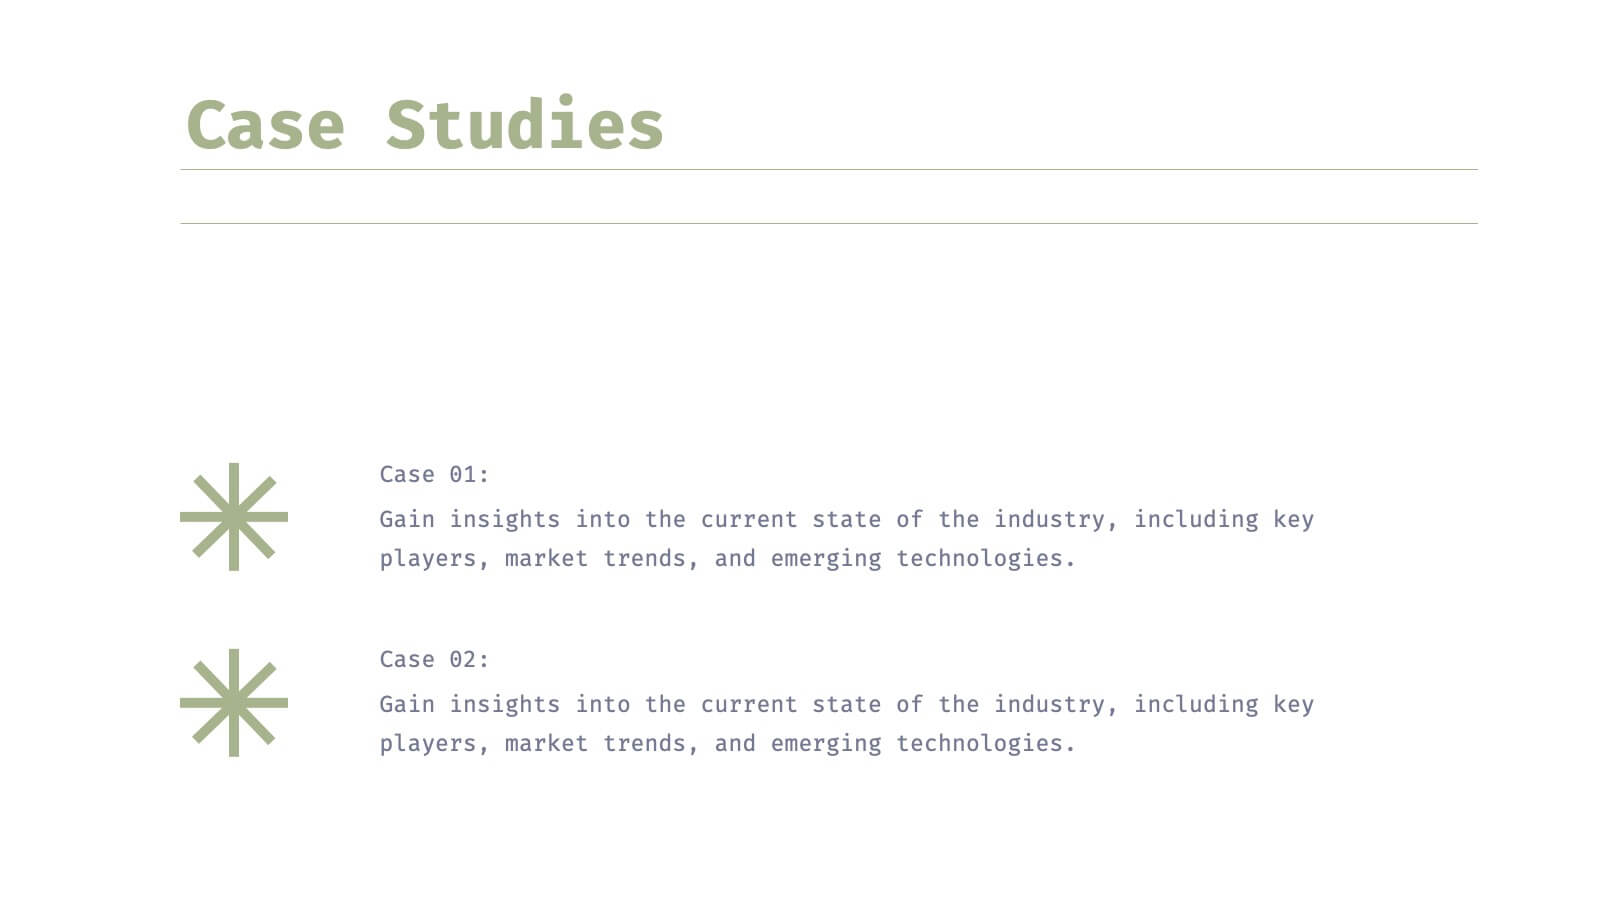
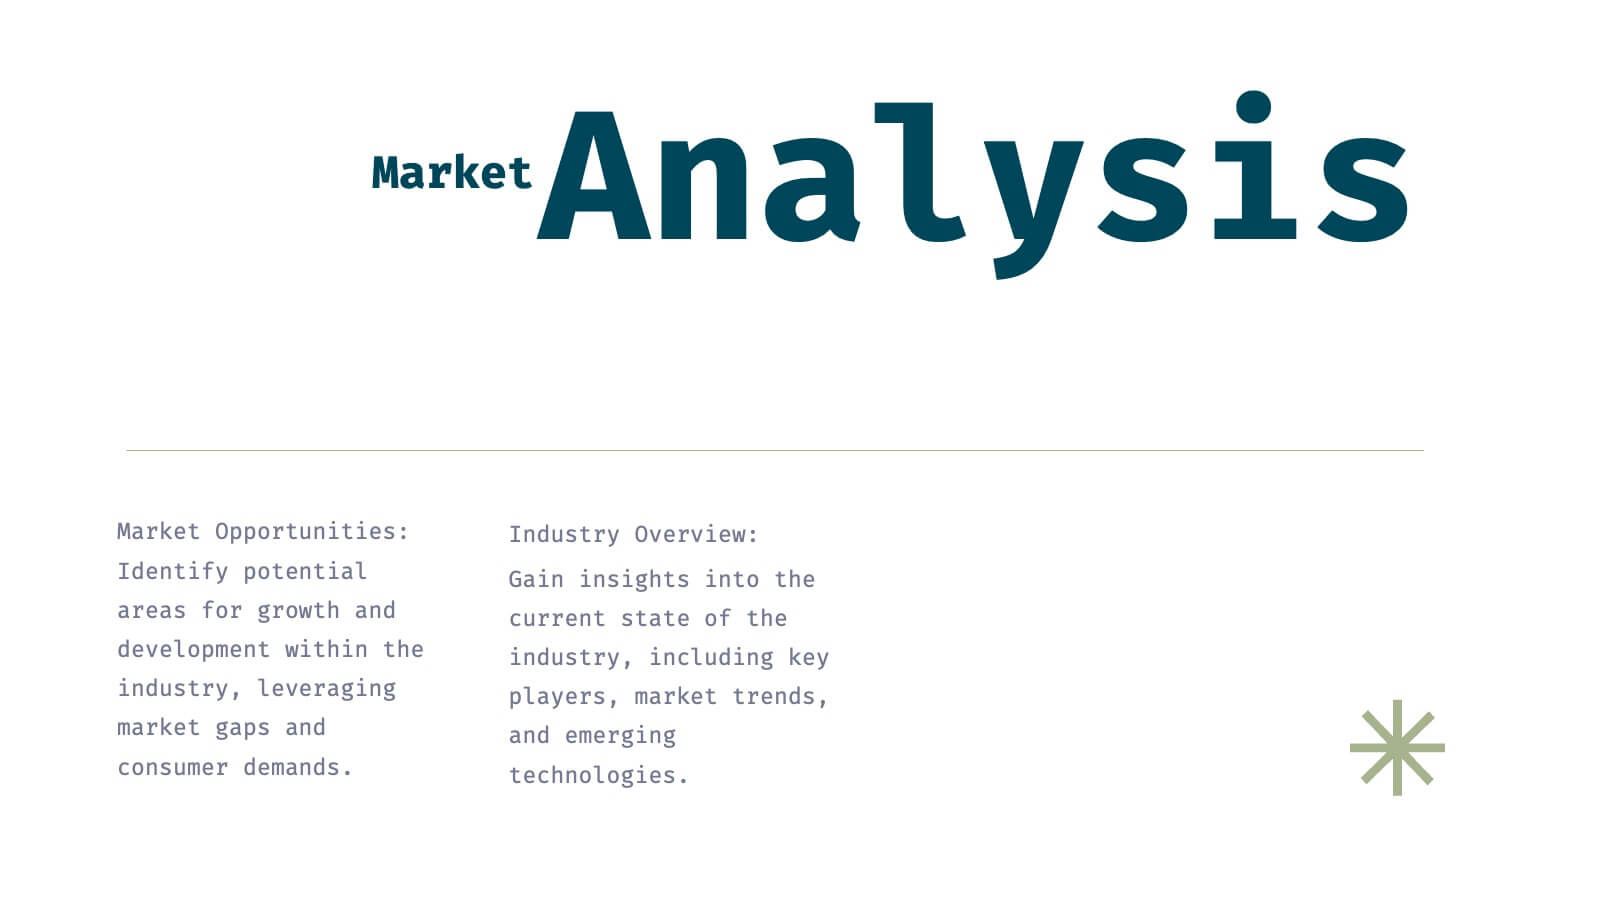
Showcase your agency's expertise with this sophisticated, minimalistic presentation template. Designed to present comprehensive market analysis, strategy development, and client success stories, this template ensures your agency's capabilities are clearly communicated. Its clean design and professional layout make it perfect for building trust and credibility. Compatible with PowerPoint, Keynote, and Google Slides, it's versatile for any platform.


5 slides
Fashion History Infographics
Fashion History is a rich and fascinating study that allows us to appreciate the artistry, craftsmanship, and cultural significance of clothing and style. These infographic templates explore the evolution of fashion over time. These templates are designed to present key milestones, trends, and influential figures in fashion history in a concise and engaging manner. The color scheme, icons, and illustrations included help these serve as visually captivating resources for anyone interested in the evolution of fashion. Perfect for fashion history presentations, museum exhibitions, or any occasion where you want to share the rich and diverse history of fashion.


4 slides
Cyber Threat Prevention Strategies Presentation
Clearly communicate your cybersecurity roadmap using this sleek timeline-style slide design. Each step is represented by a distinct icon and color-coded milestone, ideal for outlining protocols such as threat detection, employee training, or system hardening. Designed for IT teams, security analysts, and corporate risk departments. Fully editable and compatible with PowerPoint, Keynote, and Google Slides.


6 slides
5-Year Financial Forecast Slide Presentation
Show your long-term growth with a clean, visual touch that makes numbers easy to follow and goals clear to everyone. This modern layout highlights yearly progress using engaging icons and percentage indicators, perfect for financial reports or investor decks. Fully compatible with PowerPoint, Keynote, and Google Slides for seamless editing.


6 slides
Effective Leadership Skills Presentation
Build stronger teams with this effective leadership skills template, featuring a colorful building block design to represent key competencies. Ideal for leadership workshops, corporate training, and professional development, it visually organizes six core skills. Fully editable in Canva, PowerPoint, or Google Slides for easy customization to match your organization’s style.


8 slides
Monthly and Weekly Planning Calendar Presentation
Stay ahead of your schedule with this all-in-one monthly and weekly planner template. Designed for professionals and teams who need to balance long-term goals with daily priorities, this presentation offers a 6-week overview, to-do list, notes section, and weekday breakdown. With sleek color-coded tabs and editable labels, it’s perfect for time-blocking, campaign tracking, or event coordination. Easily customizable in PowerPoint, Keynote, and Google Slides.


5 slides
Pet Clinic Business Strategy Presentation
Enhance your pet clinic's approach with our Pet Clinic Business Strategy presentation template. This layout is expertly designed to outline your clinic’s key strategies and enhance your operational excellence, making it perfect for meetings, stakeholder presentations, and strategic workshops.


4 slides
Buyer Persona Research and Profile Map Presentation
Make your audience feel like they already know your ideal customer. This creative template helps you visually map out key buyer persona data, such as demographics, goals, behavior, and pain points. Perfect for marketing strategy and customer research presentations. Fully compatible with PowerPoint, Keynote, and Google Slides for seamless editing.


26 slides
Company Profile and Accomplishments Presentation
A company profile is a document that provides an overview of a business entity. This template serves as a company introduction, presenting essential information about company history, products or services, achievements, goals, and other relevant details. This template showcases the milestones and capabilities of a company. This presentation is perfect for businesses, startups, or organizations looking to highlight their success, growth, and overall expertise in their industry. The clean layout, engaging visuals, and comprehensive information, will help your presentation leave a lasting impression on your audience and enhance your company's reputation.


5 slides
Corporate Ethics and Legal Guidelines
Clearly outline company policies and ethical standards with this organized and professional slide. Featuring a checklist-style layout with customizable categories, it’s ideal for corporate trainings, compliance presentations, and HR onboarding. Fully editable and compatible with PowerPoint, Keynote, and Google Slides.


7 slides
Corporation Hierarchy Infographic
Discover the intricate layers of corporate structure with our corporation hierarchy infographic. Set in an appealing blend of blue, yellow, and white, this template artfully depicts the hierarchal ladder commonly seen in major corporations. From CEOs to interns, it beautifully outlines every rung. This infographic is indispensable for business students, corporate trainers, managers, and anyone seeking to understand the inner workings of a corporation. Designed with precision and clarity, it's perfectly suited for PowerPoint, Keynote, and Google Slides, making your presentations not only informative but also visually captivating.


6 slides
North America Weather Map Infographics
Explore our customizable North America Weather Map infographic template, a valuable tool for understanding regional weather patterns. Compatible with PowerPoint, Keynote, and Google Slides, this template simplifies complex data into user-friendly visuals, allowing you to tailor it to your specific requirements. This infographic template offers a foundation for displaying current and historical weather data, temperature trends, precipitation patterns, and more. Whether you're a meteorologist, educator, or just curious, this template provides a versatile platform to create weather-related presentations that suit your unique needs. Impress your audience with this SEO-optimized North America Weather Map infographic template, designed for clarity and ease of use. Customize it to stay informed, plan outdoor activities, and effectively communicate weather information. Get started with your customized infographic today!


4 slides
Annual Calendar Layout for Projects
Plan your year like a pro with this clean and colorful visual layout—it’s designed to help you stay focused, organized, and on track month by month. Whether you're mapping out team projects, campaign milestones, or business goals, this annual calendar format makes it easy to see everything at a glance. Fully compatible with PowerPoint, Keynote, and Google Slides.