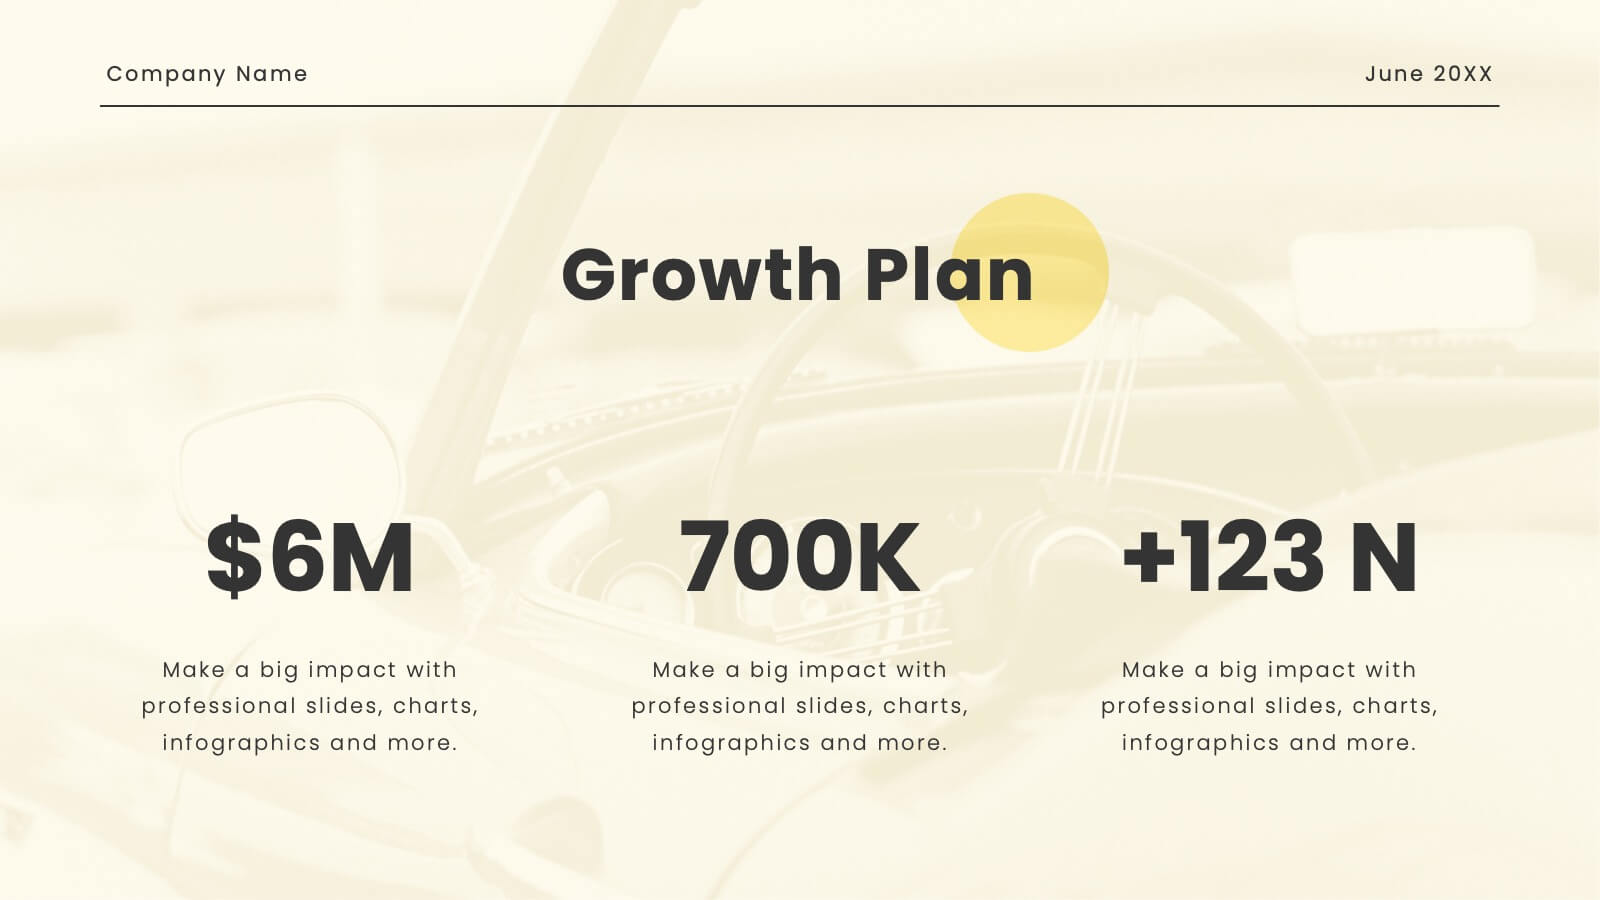
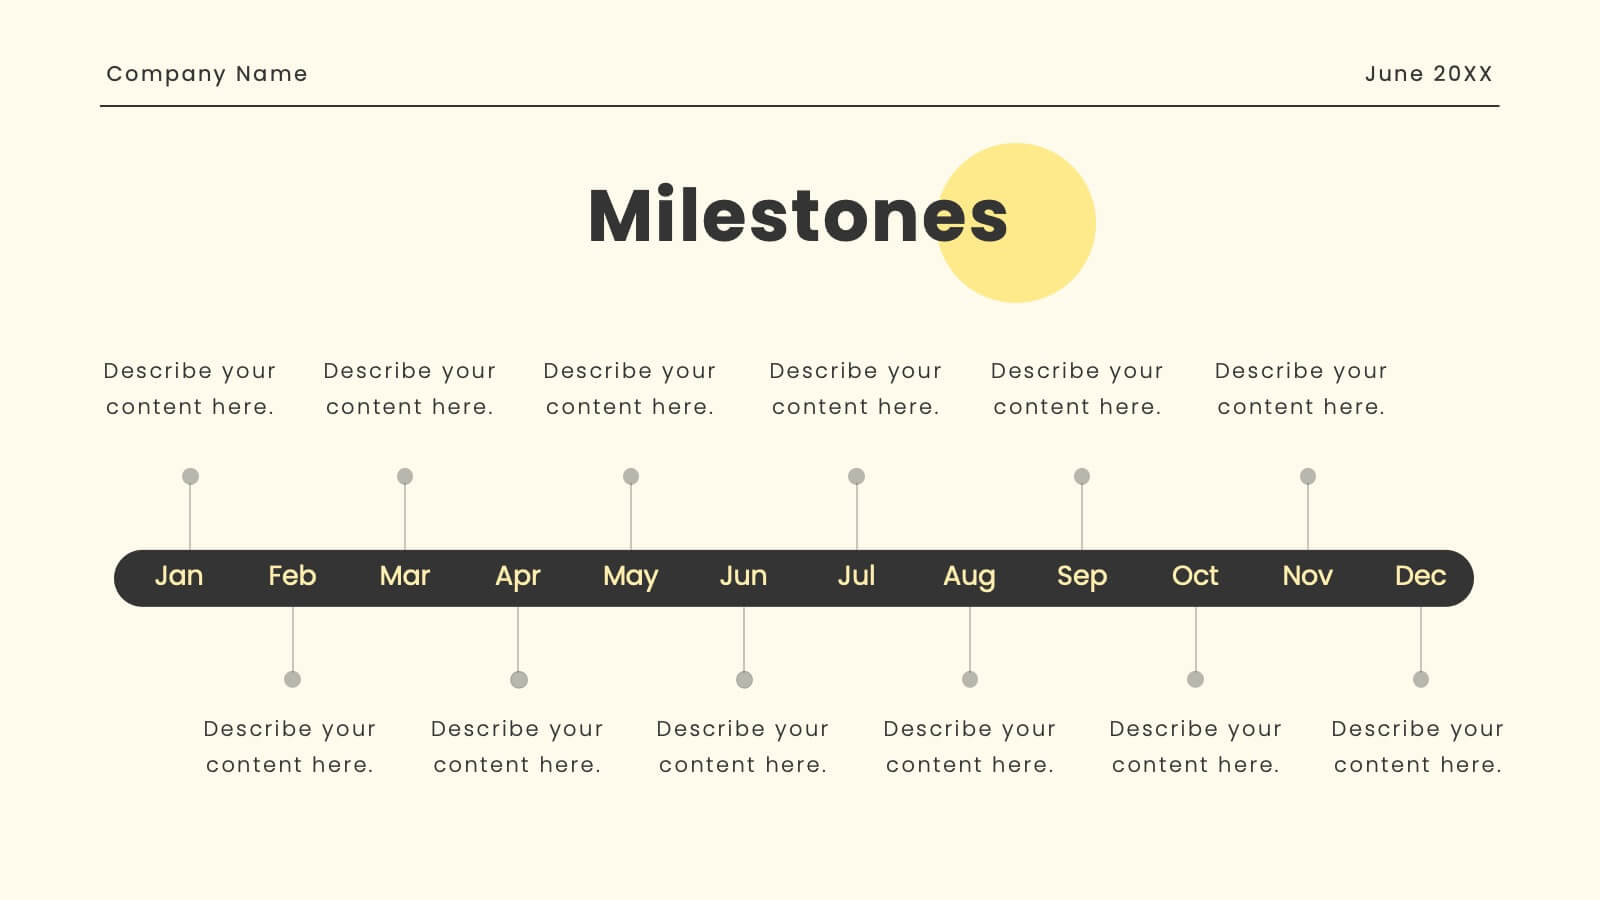
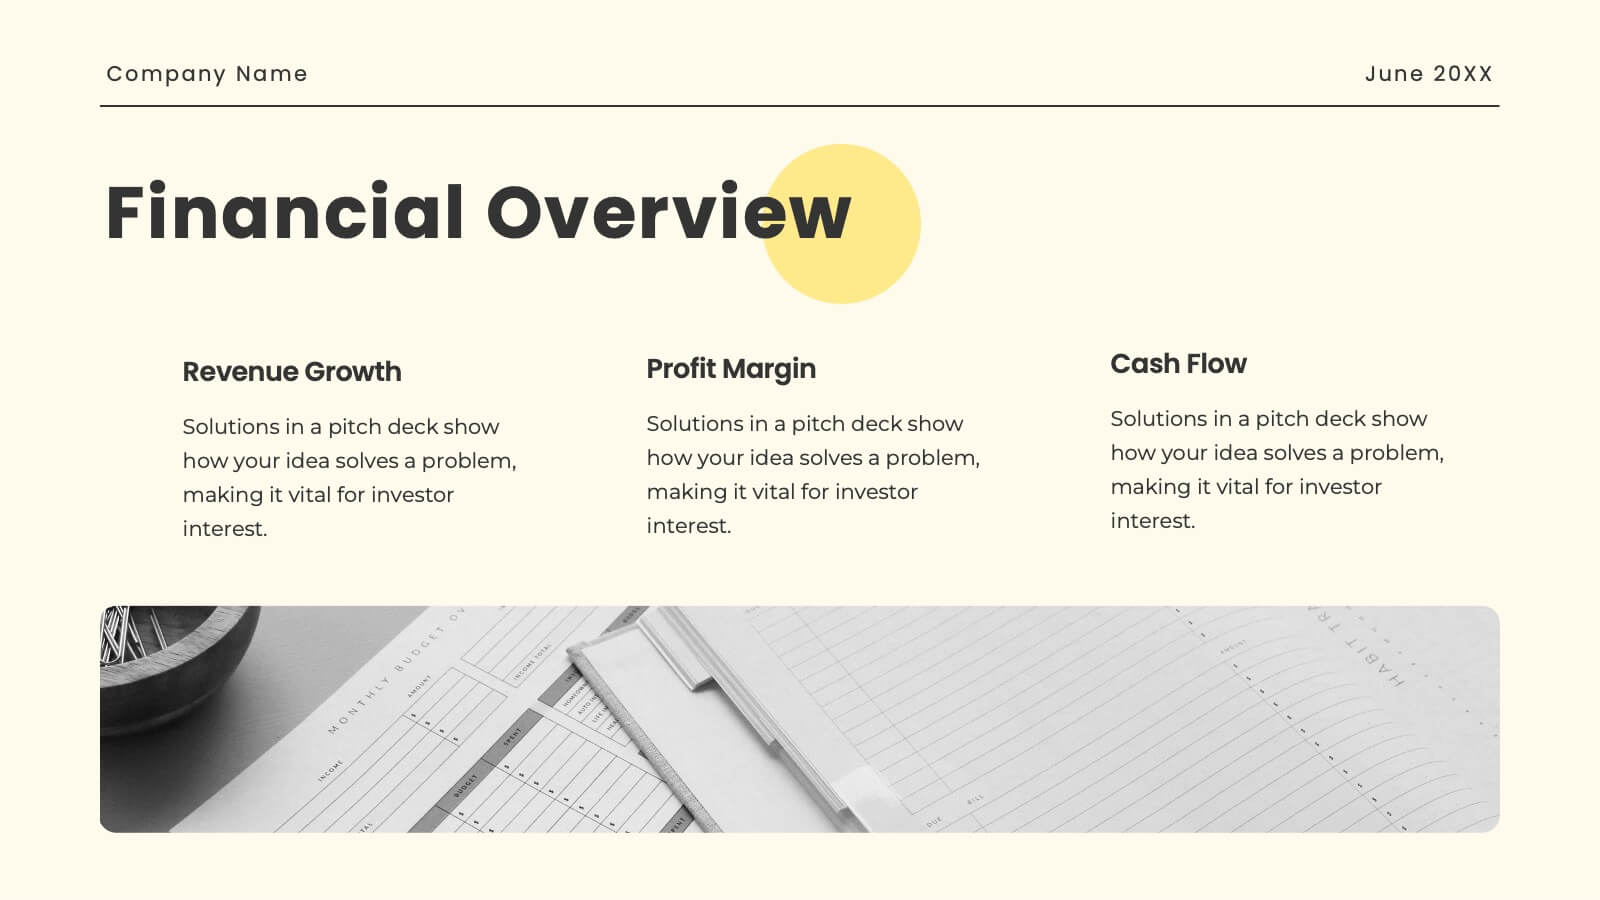
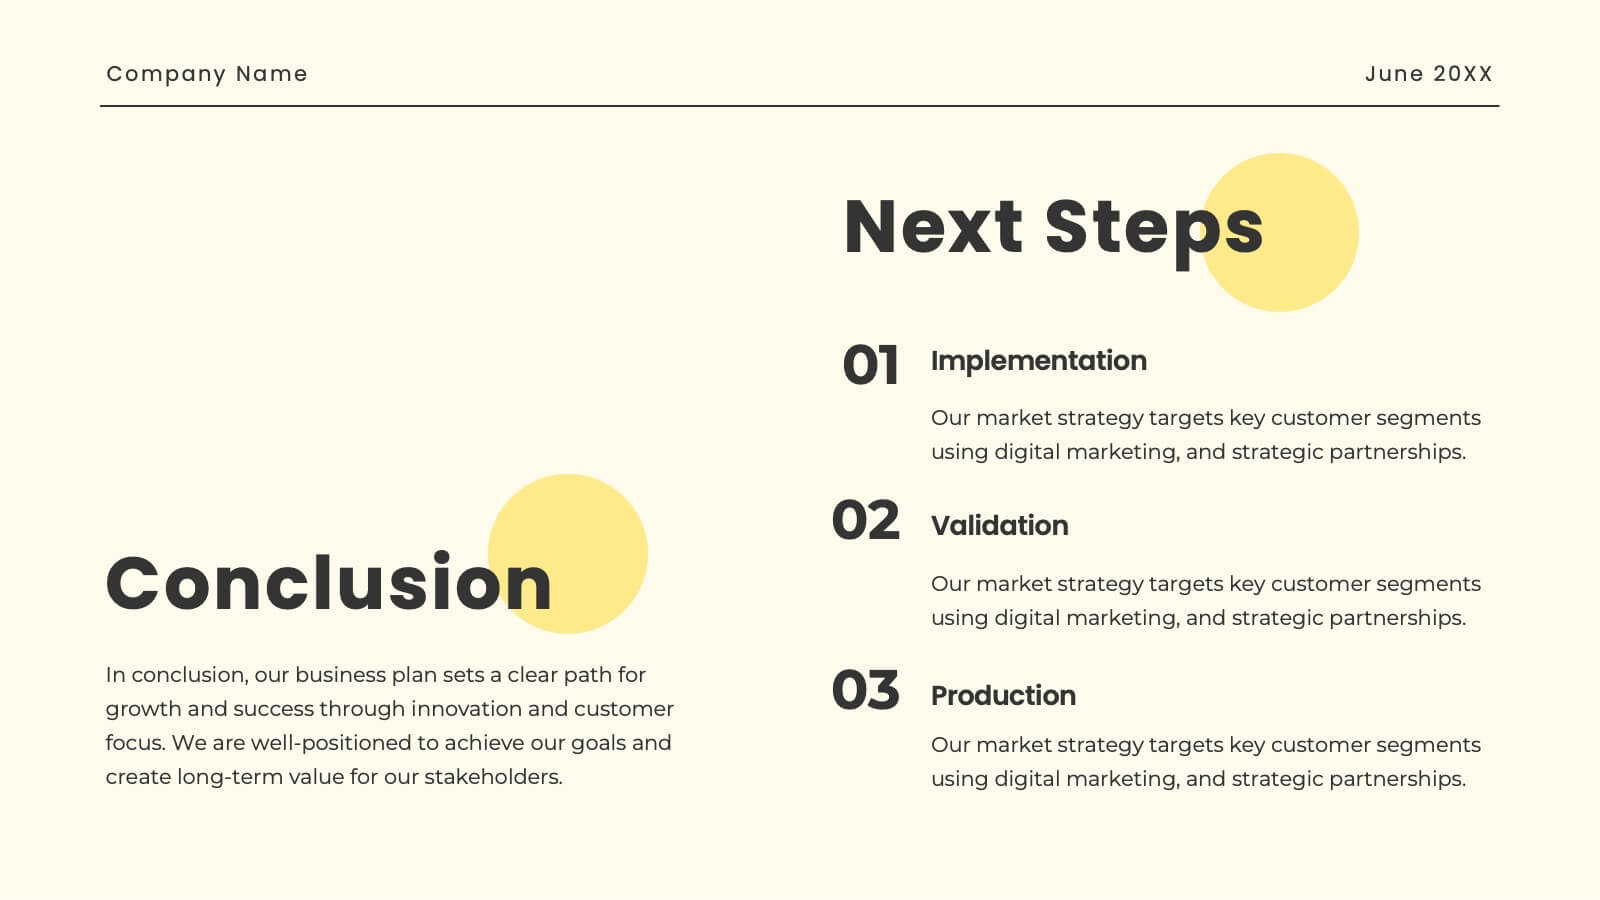
5 Steps Timeline Template
PowerPoint Template and Google Slides Theme


Features
- 12 Unique Slides
- Fully editable and easy to edit in Microsoft Powerpoint, Keynote and Google Slides
- 16:9 widescreen layout
- Clean and professional designs
- Export to JPG, PDF or send by email
- Remove from favorites
Powerpoint Template
1 MB
Google Slides Template
External link
Keynote Template
2 MB
Recommend
- Remove from favorites
Powerpoint Template
1 MB
Google Slides Template
External link
Keynote Template
1 MB
4 slides
Healthcare Trends and Innovations Presentation
Showcase cutting-edge medical insights using this umbrella-themed slide design tailored for healthcare trends and innovations. Ideal for highlighting advancements, protective strategies, or sector forecasts, this template offers a clean, symbolic layout. Fully editable in PowerPoint, Keynote, and Google Slides—perfect for medical professionals, health consultants, and industry analysts alike.
- Remove from favorites
Powerpoint Template
1 MB
Google Slides Template
External link
Keynote Template
2 MB
7 slides
State-by-State Business Data Presentation
Break down insights with this State-by-State Business Data Presentation. Featuring a U.S. map segmented by regions, this slide is ideal for illustrating localized performance, regional statistics, or market segmentation. Customize text labels and highlight specific zones to match your business needs. Fully editable in PowerPoint, Keynote, and Google Slides.
- Remove from favorites
Powerpoint Template
1 MB
Google Slides Template
External link
Keynote Template
1 MB
5 slides
Agribusiness Market Strategy Overview
Showcase your market plan with the Agribusiness Market Strategy Overview Presentation. This engaging slide uses fresh produce illustrations to symbolize market growth, distribution, and agricultural planning. Perfect for farm business proposals, supply chain discussions, or food sector reports. Fully customizable and works seamlessly in PowerPoint, Keynote, and Google Slides.
- Remove from favorites
Powerpoint Template
1 MB
Google Slides Template
External link
Keynote Template
1 MB
4 slides
3-Circle Venn Diagram Presentation
Visualize overlap and connection with clarity using the 3-Circle Venn Diagram Presentation. This minimalist slide is ideal for showing relationships between three ideas, strategies, or data sets. Each circle is color-coded for distinction, and intersections highlight shared elements. Perfect for business models, marketing segments, or product comparisons. Fully editable in PowerPoint, Keynote, and Google Slides.
- Remove from favorites
Powerpoint Template
1 MB
Google Slides Template
External link
Keynote Template
1 MB
4 slides
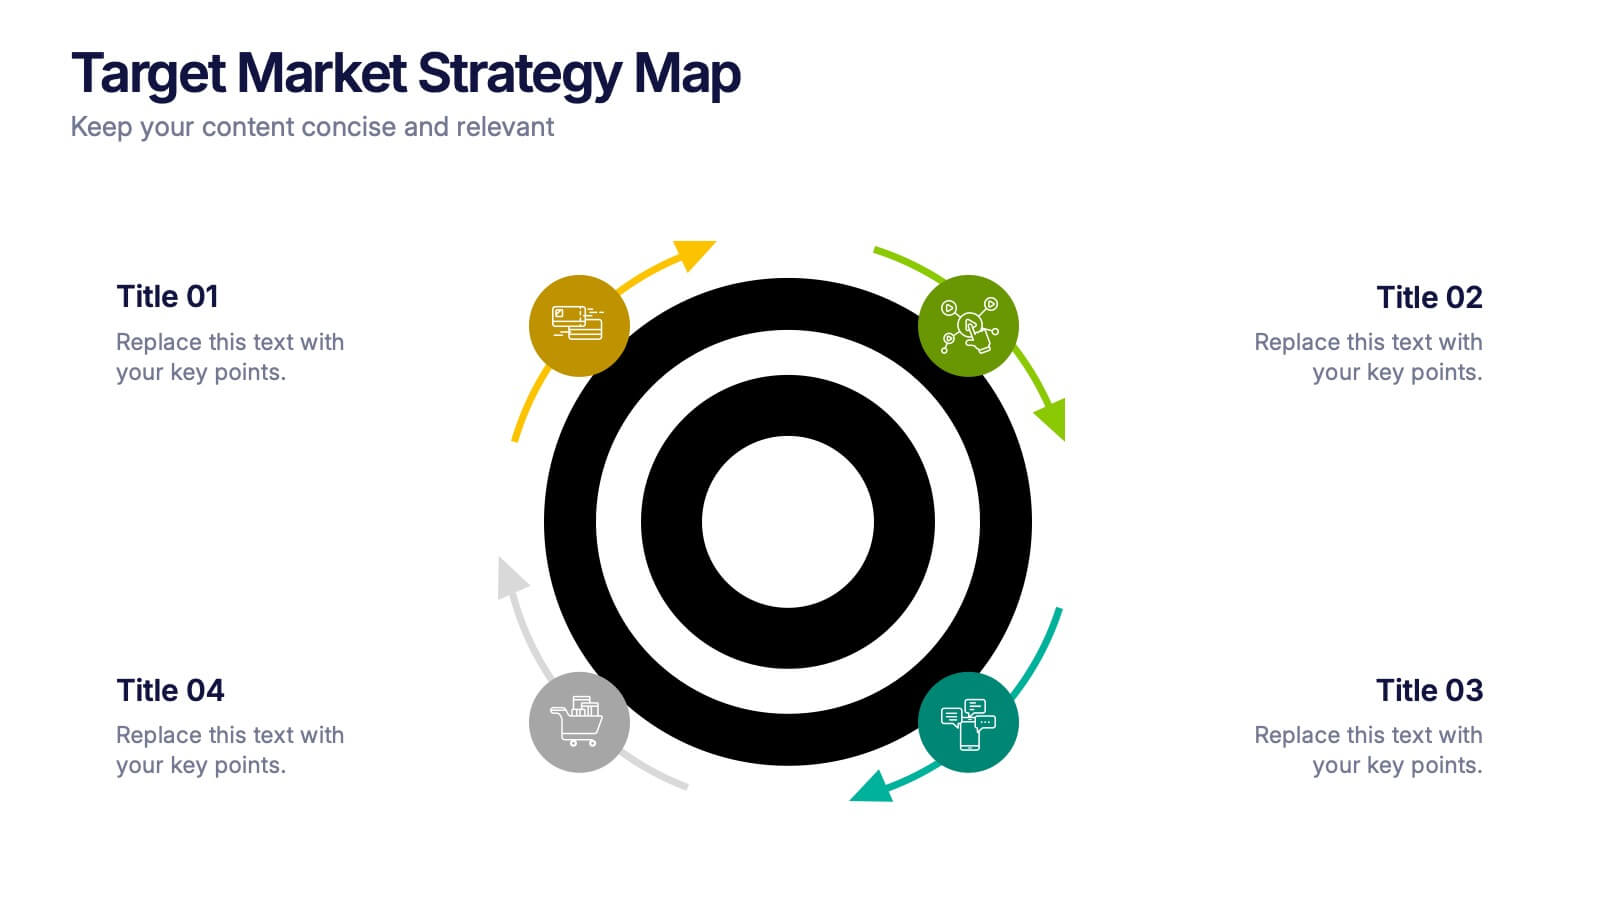
Target Market Strategy Map Presentation
Bring your strategy to life with a bold visual that makes your target market impossible to miss. This presentation helps you outline customer priorities, growth opportunities, and key competitive insights in a clean, intuitive format that keeps teams aligned and focused. Fully compatible with PowerPoint, Keynote, and Google Slides.
- Remove from favorites
Powerpoint Template
1 MB
Google Slides Template
External link
Keynote Template
2 MB
7 slides
Kickoff Meeting Infographic
A meeting is a planned gathering of individuals, often from an organization or a group, who come together to discuss specific topics, share information, make decisions, or collaborate on projects. This infographic template is a visually engaging guide to launching your projects with a burst of energy and purpose. This template is your go-to tool for orchestrating that vital moment—the project kickoff—that sets the stage for success. Compatible with Powerpoint, Keynote, and Google Slides. This template is a structured way to communicate, coordinate actions, and ensure that everyone involved is aligned towards common goals.
- Remove from favorites
Powerpoint Template
2 MB
Google Slides Template
External link
Keynote Template
4 MB
21 slides
Trident Product Development Plan Presentation
Present your product development strategy with this sleek, professional template! Highlight company overview, product features, and unique selling proposition. Ideal for showcasing market analysis, pricing strategy, and production process. Perfect for developers and project managers. Compatible with PowerPoint, Keynote, and Google Slides.
- Remove from favorites
Powerpoint Template
1 MB
Google Slides Template
External link
Keynote Template
1 MB
5 slides
Cyber Security Risk Management Presentation
Effectively visualize your digital defense strategy with this cyber security-themed presentation layout. Featuring a sleek laptop illustration and circular infographic design, this template helps you outline five critical areas of risk management with matching icons and editable text sections. Ideal for IT teams, consultants, or training sessions. Fully customizable and compatible with PowerPoint, Keynote, and Google Slides.
- Remove from favorites
Powerpoint Template
1 MB
Google Slides Template
External link
Keynote Template
1 MB
2 slides
Eye-Catching Title Cover Slide Presentation
Capture attention instantly with this bold, modern title cover slide. Featuring vibrant colors, oversized geometric shapes, and strong typography, this layout is ideal for setting the tone in creative, marketing, or business presentations. The design is fully editable and compatible with PowerPoint, Keynote, and Google Slides—making it easy to tailor to your brand and message.
- Remove from favorites
Powerpoint Template
1 MB
Google Slides Template
External link
Keynote Template
1 MB
5 slides
Projects Milestone Timeline Presentation
Kickstart your story with a clean, engaging timeline that makes every achievement feel purposeful and easy to follow. This presentation helps you outline major milestones, track progress, and communicate project goals with clarity and structure. Ideal for planning, reporting, and strategy sessions. Fully compatible with PowerPoint, Keynote, and Google Slides.
- Remove from favorites
Powerpoint Template
1 MB
Google Slides Template
External link
Keynote Template
1 MB
7 slides
Behavior Iceberg Infographic
Delve deep into human behavior with our behavior iceberg infographic. Set against a serene white backdrop, the design is brought to life with various shades of blue, mimicking the depths of an iceberg and symbolizing the visible and hidden aspects of behavior. Enhanced with fluid infographics, evocative icons, and adaptable image placeholders, this template portrays the tip of observable behavior while revealing the underlying thoughts, beliefs, and emotions submerged beneath. Precision-crafted for Powerpoint, Keynote, or Google Slides. Ideal for psychologists, counselors, HR professionals, or educators aiming to comprehend and address underlying issues.
- Remove from favorites
Powerpoint Template
11 MB
Google Slides Template
External link
Keynote Template
14 MB
21 slides
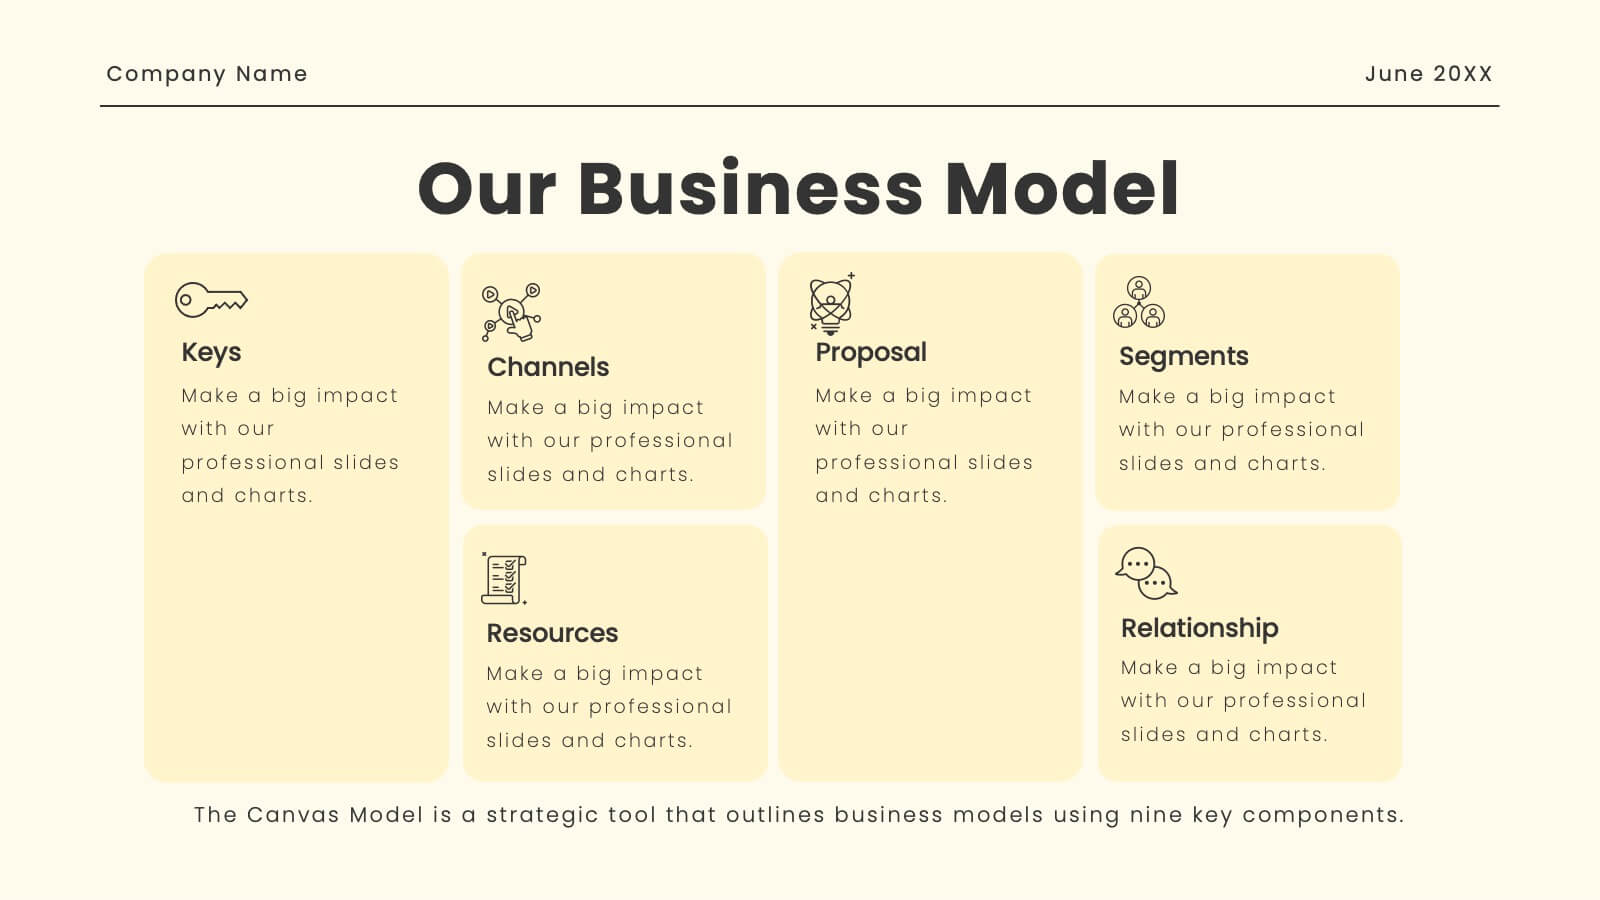
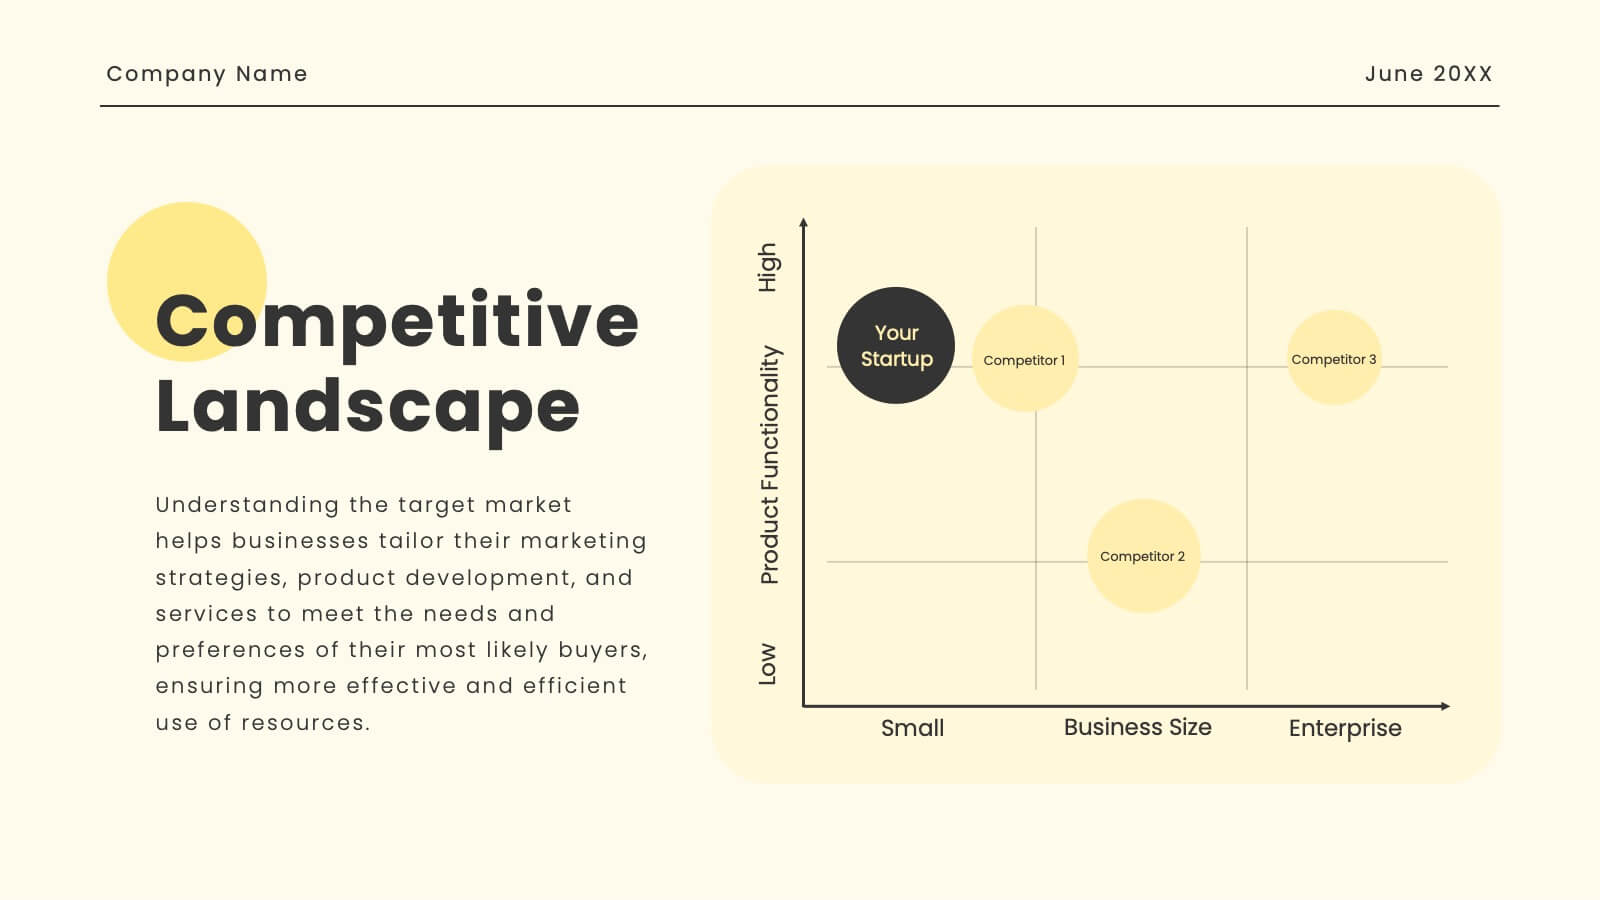
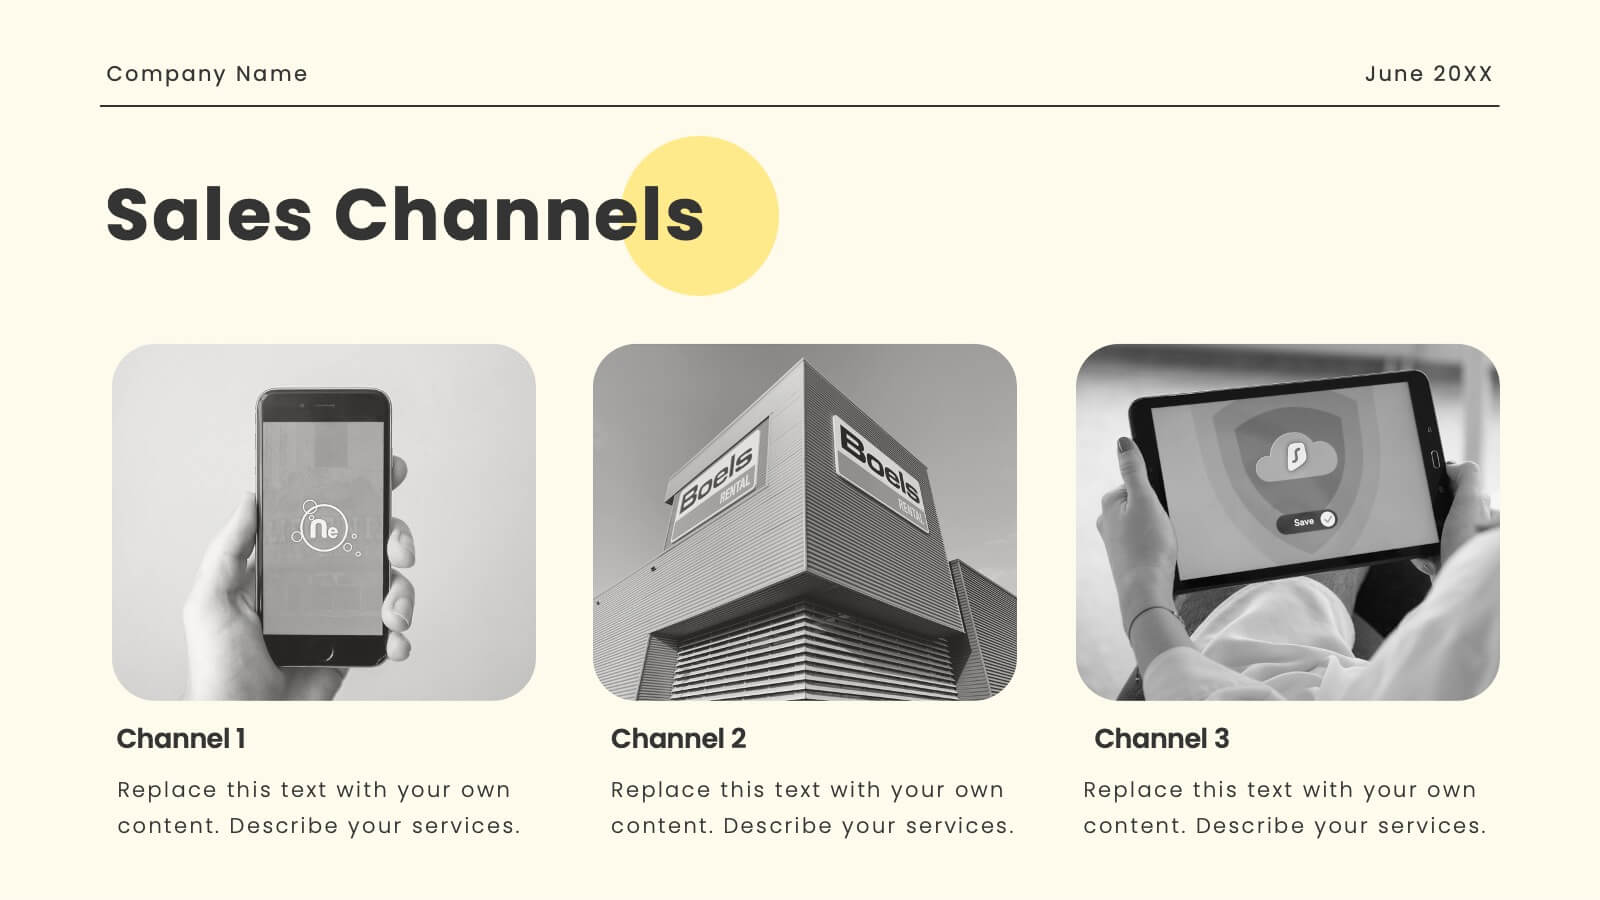
Oasis Startup Business Plan Presentation
Present your corporate business plan with confidence! This template includes sections for company overview, mission, vision, services, target market, and more. Showcase your market strategy, sales channels, growth plan, and financial overview. Perfect for conveying a professional and comprehensive business plan. Compatible with PowerPoint, Keynote, and Google Slides. Impress your audience today!
- Remove from favorites
Powerpoint Template
1 MB
Google Slides Template
External link
Keynote Template
1 MB
4 slides
Internal Meeting Agenda and Notes Presentation
Stay organized and aligned with the Internal Meeting Agenda and Notes presentation template. Designed for clarity and productivity, this layout includes dedicated sections for meeting topics, notes, action items (to-do list), brainstorming, and extra comments. Ideal for team check-ins, project syncs, and internal reviews. Fully editable and compatible with PowerPoint, Keynote, and Google Slides.
- Remove from favorites
Powerpoint Template
1 MB
Google Slides Template
External link
Keynote Template
2 MB
10 slides
Business Growth and Market Statistics Presentation
Showcase key business growth trends and market insights with the "Business Growth and Market Statistics" presentation templates. These visuals are crafted to enhance clarity in communicating growth drivers, market dynamics, and performance metrics effectively. Ideal for corporate presentations, they're compatible with PowerPoint, Keynote, and Google Slides, ensuring a professional look across all platforms.
- Remove from favorites
Powerpoint Template
1 MB
Google Slides Template
External link
Keynote Template
2 MB
7 slides
Customer Relationship Management
Strengthen client loyalty and drive growth with this organized CRM infographic. Perfect for presenting customer touchpoints, service strategies, and loyalty-building initiatives. Fully customizable in PowerPoint, Keynote, and Google Slides, this design ensures your CRM workflows are communicated with clarity and visual impact.
- Remove from favorites
Powerpoint Template
1 MB
Google Slides Template
External link
Keynote Template
3 MB
7 slides
Anatomy Infographic Presentation Template
Anatomy infographics are visual representations of the different systems and structures of the human body. They are designed to convey complex information in an easily manner and visually appealing way. Our anatomy template include images, diagrams, and text to provide an overview of the different systems of the human body, such as the skeletal, muscular, and cardiovascular systems. Our template can be used for a variety of purposes, including education, medical training, and patient education. The text, colors and images can be easily modified to suit your needs and preferences!
- Remove from favorites
Powerpoint Template
1 MB
Google Slides Template
External link
Keynote Template
1 MB
6 slides
ABC Alphabet Infographic
An "Alphabet Infographic" is a visually engaging way to present the letters of the alphabet along with corresponding words or images that start with each letter. This type of infographic is often used in educational settings to teach young children the alphabet and basic vocabulary. Display the letters of the alphabet in a clear and appealing layout. You can arrange them in rows or columns, using a bold and easily readable font. Use colorful and child-friendly illustrations for the images associated with each letter. This will make the infographic more captivating and engaging for young learners.


