


Features
- 5 Unique slides
- Fully editable and easy to edit in Microsoft Powerpoint, Keynote and Google Slides
- 16:9 widescreen layout
- Clean and professional designs
- Export to JPG, PDF or send by email


Do you have any questions?
Recommend

21 slides
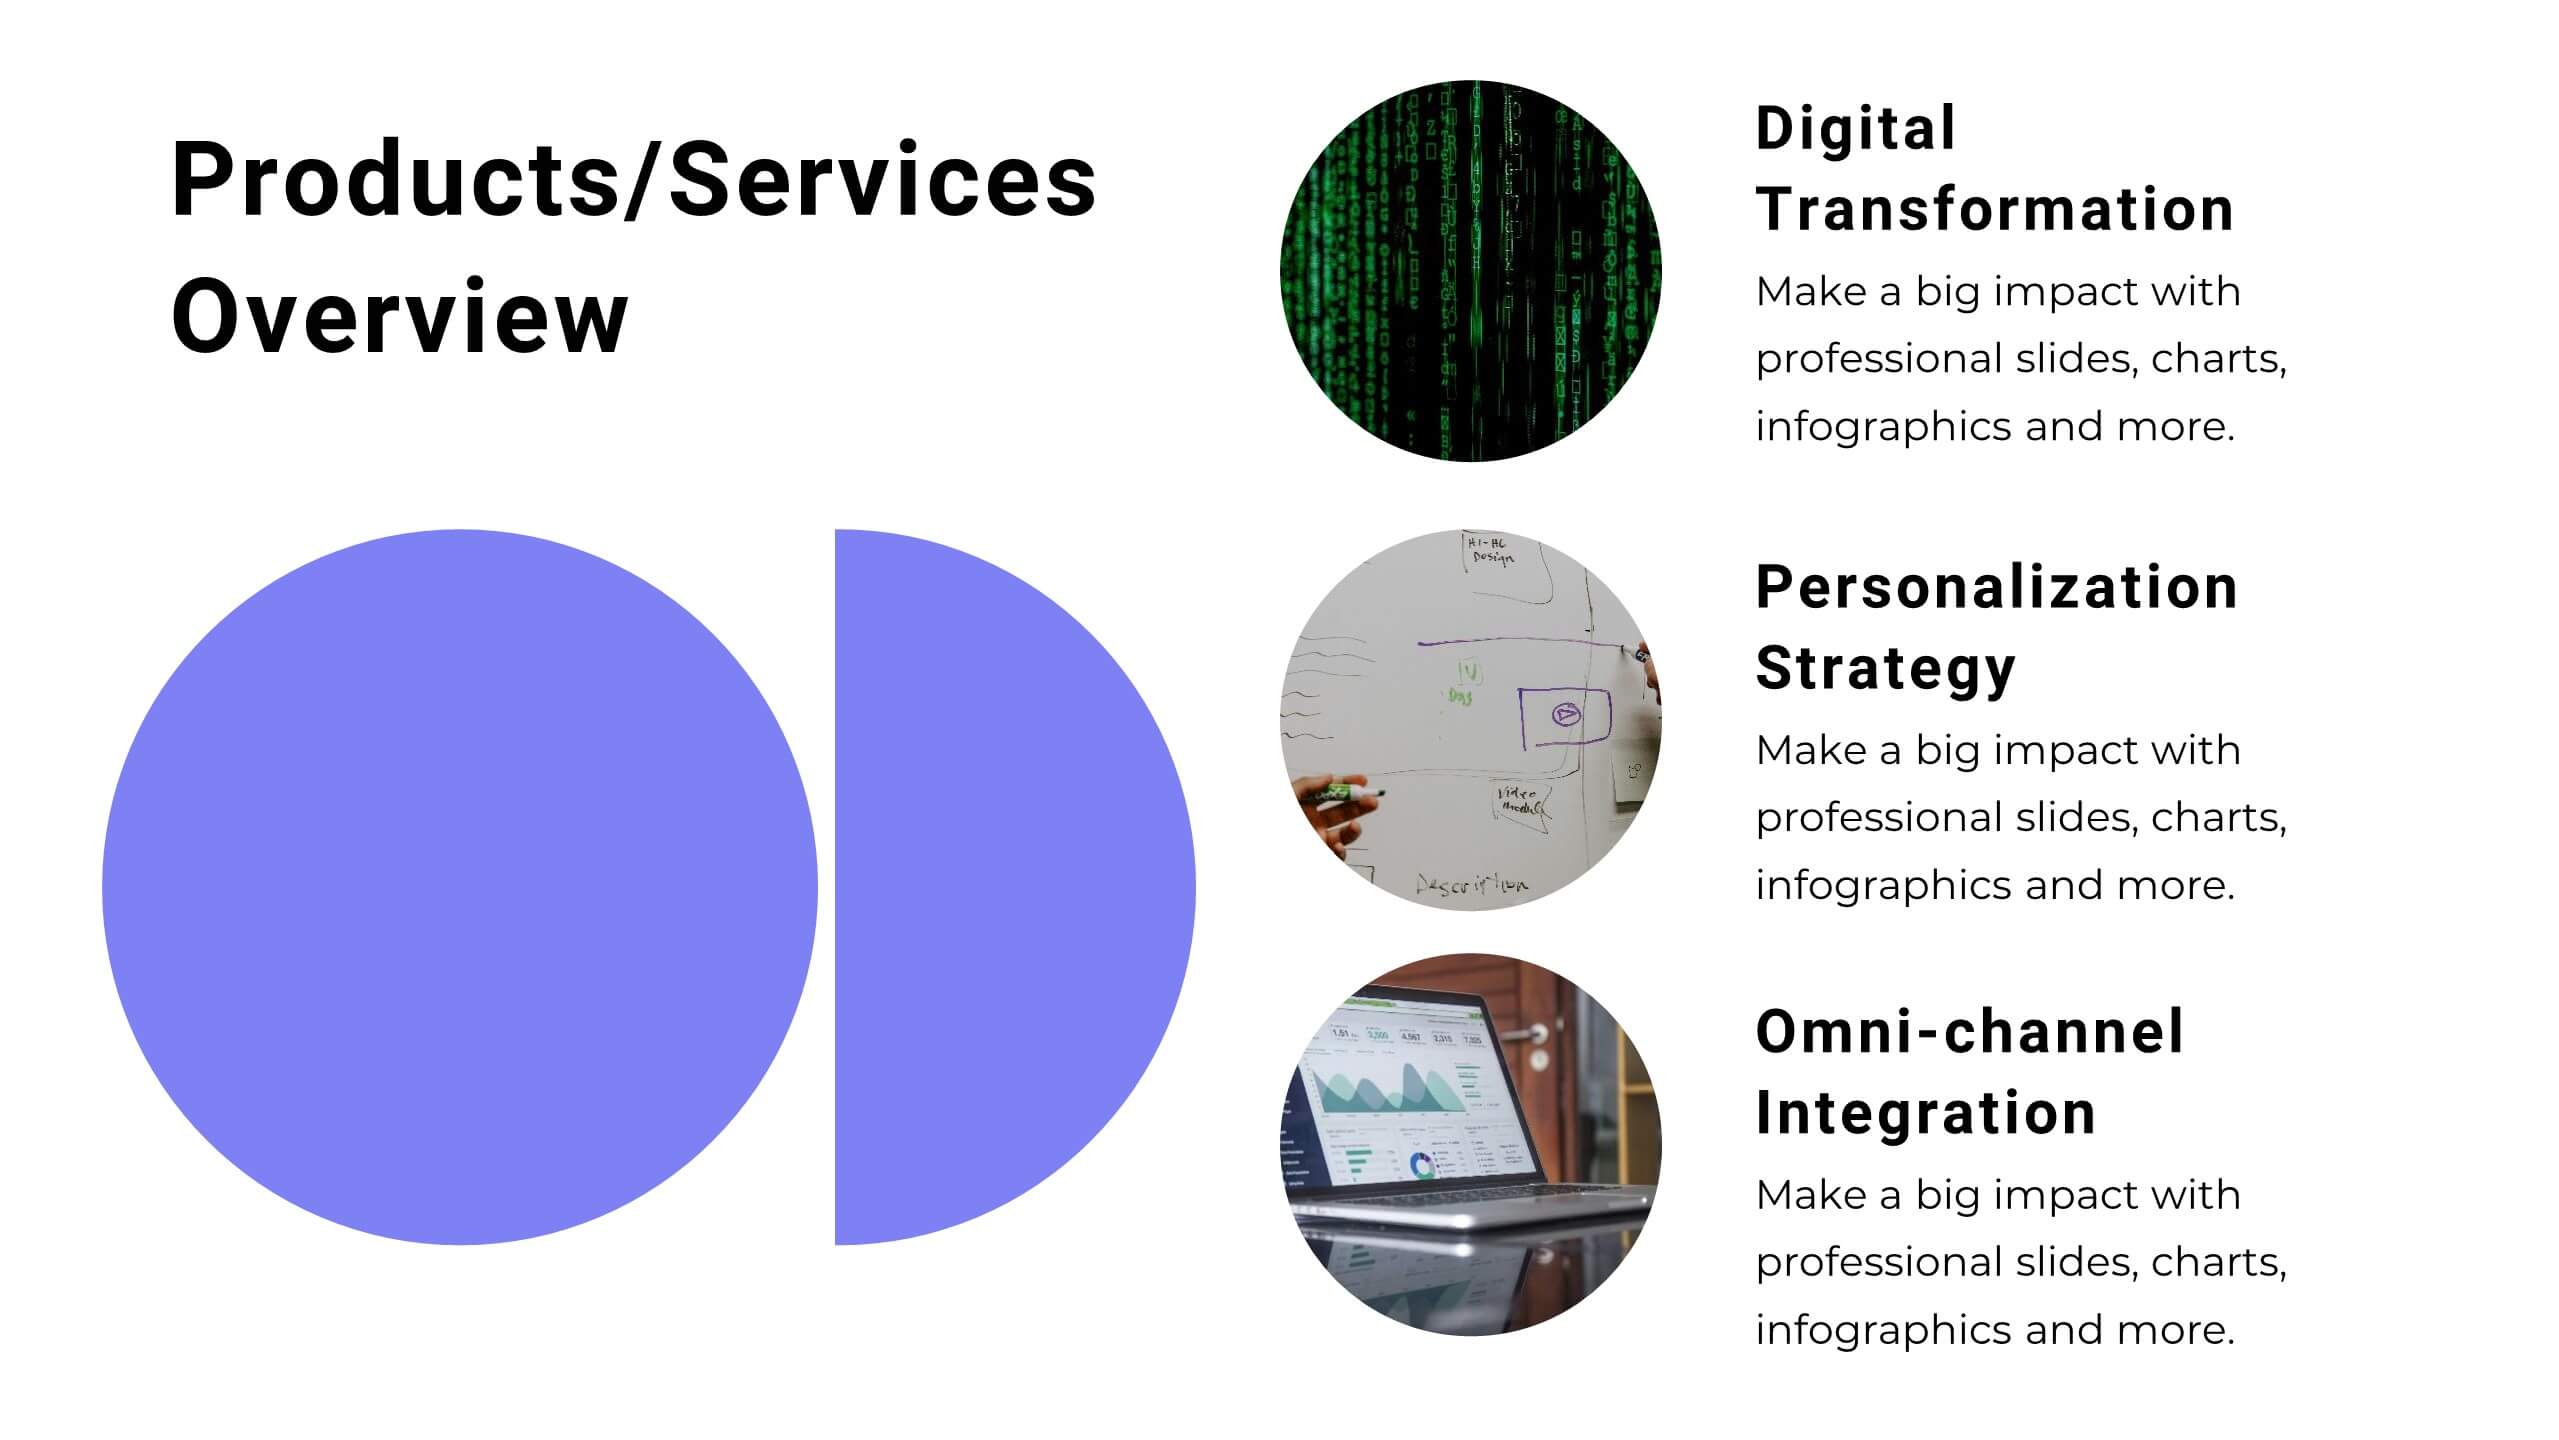
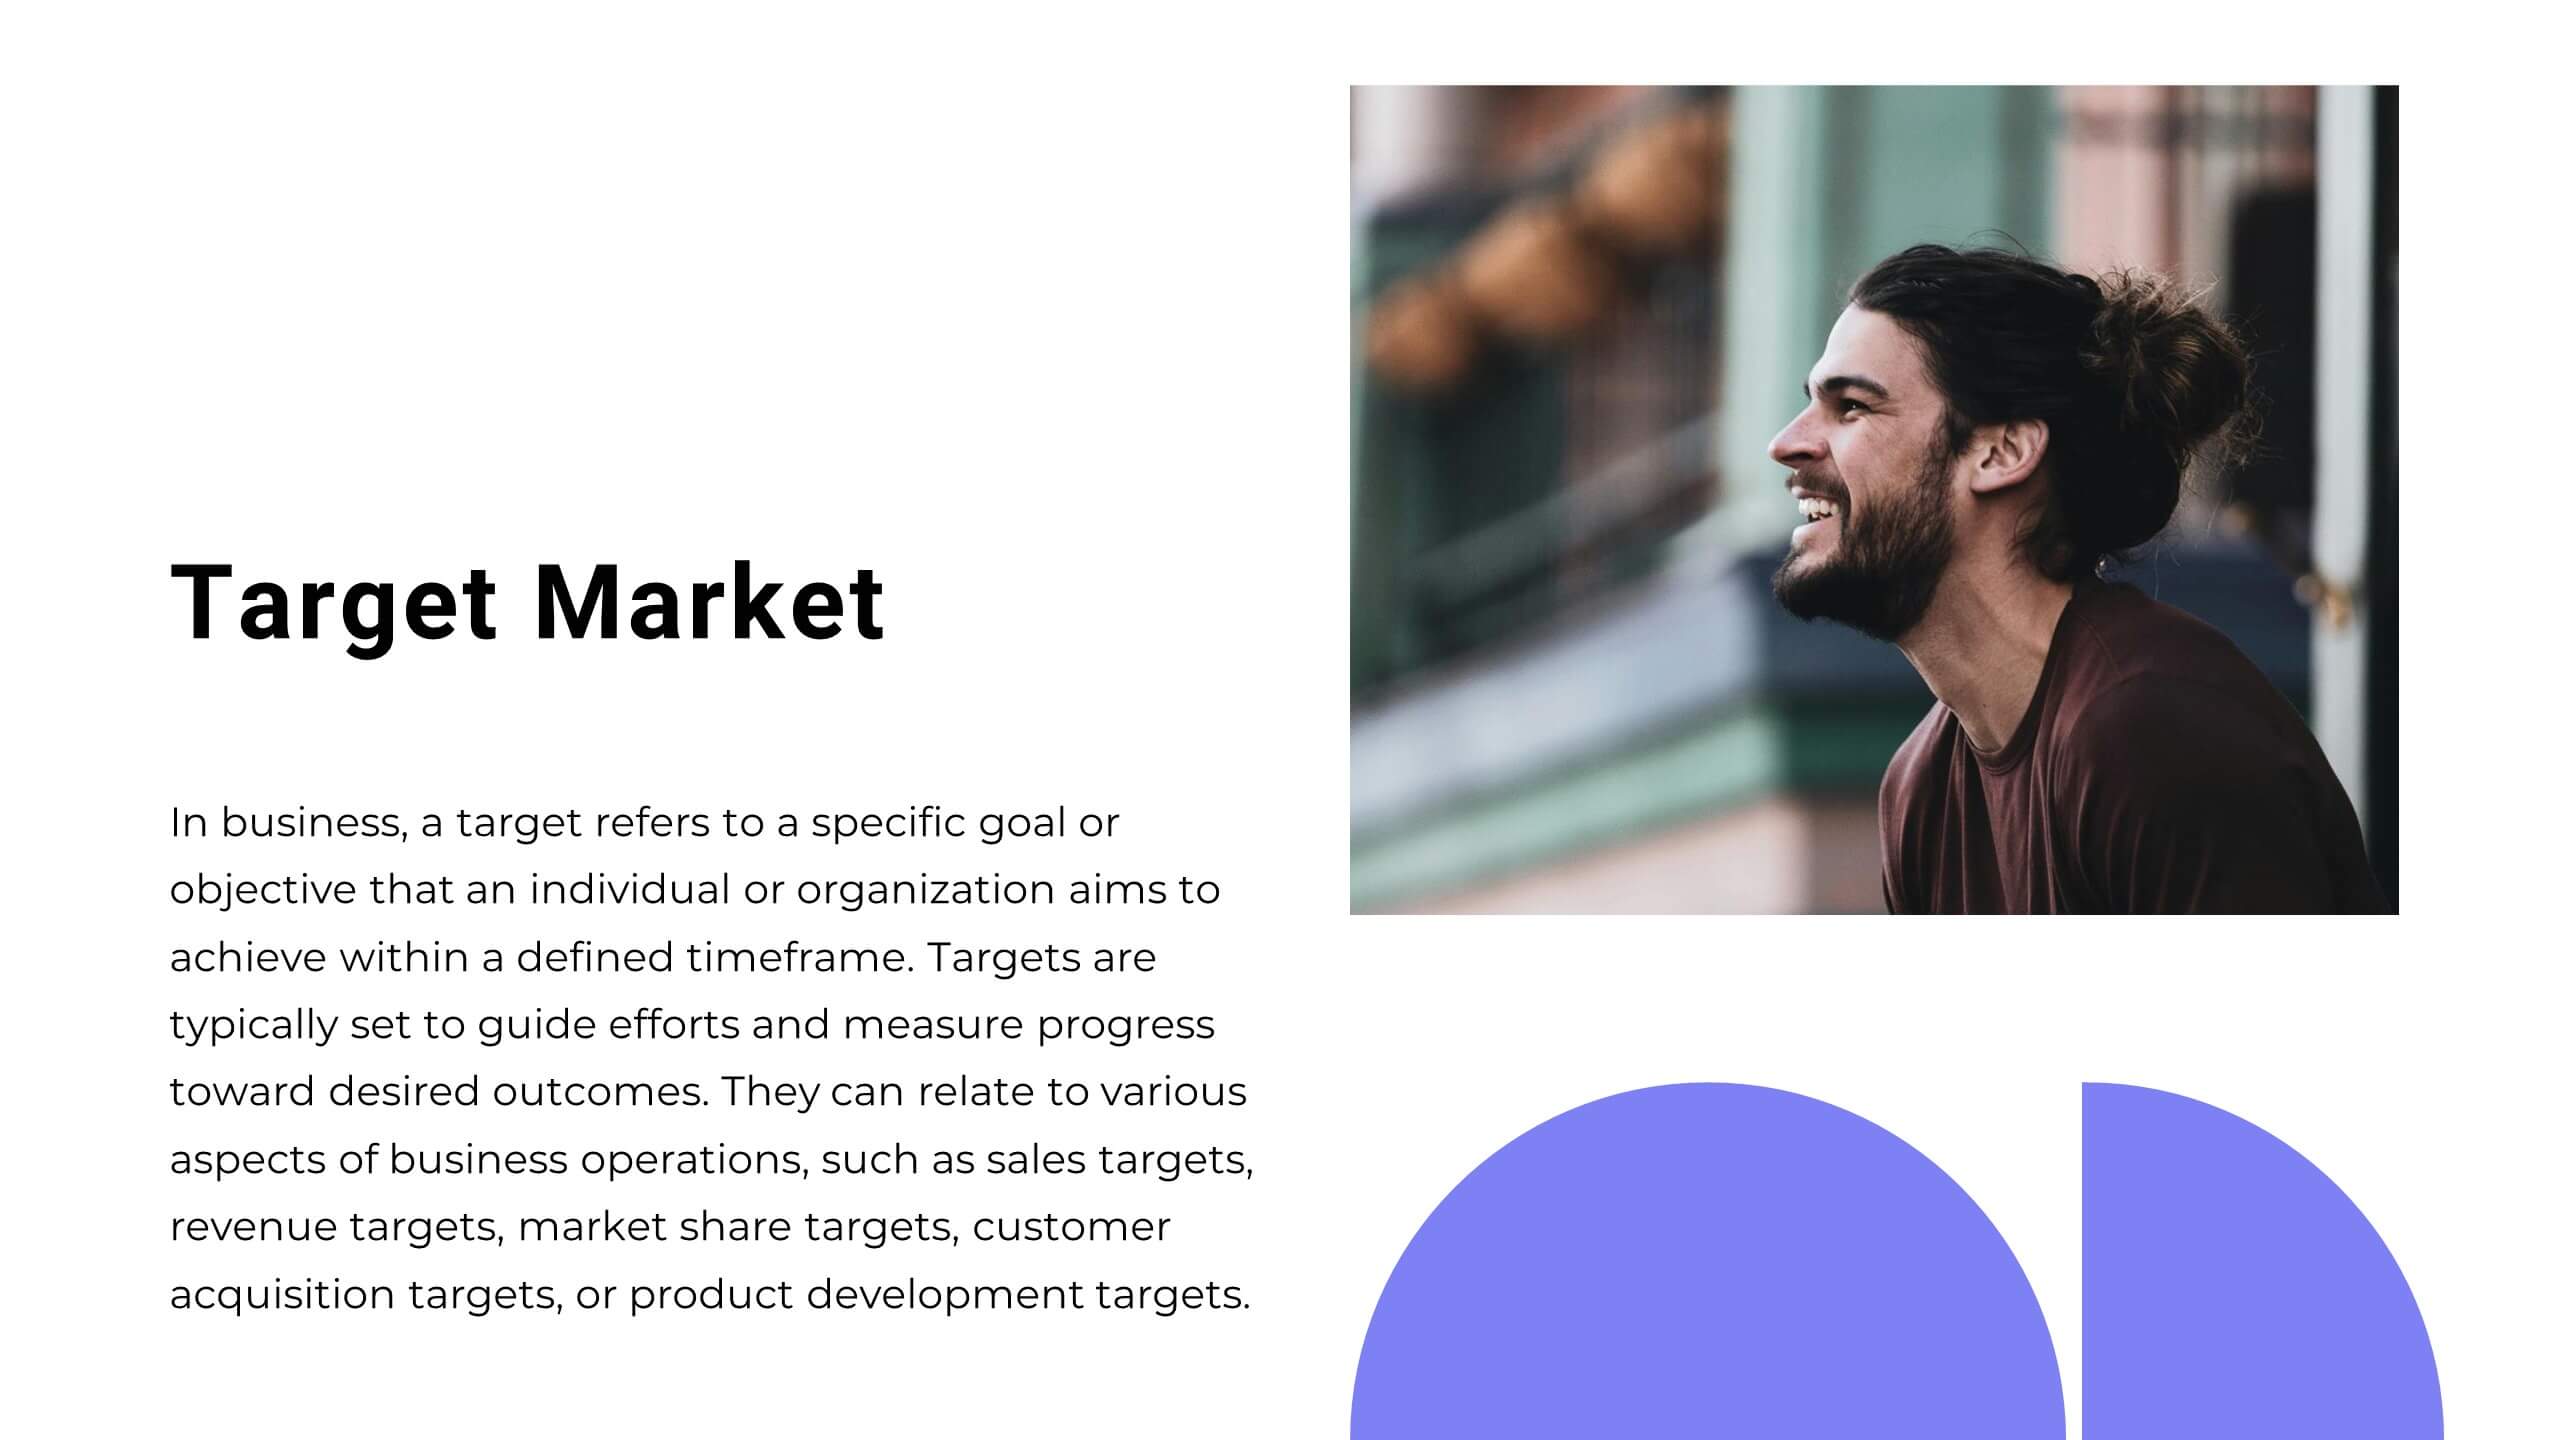
Vibrant Startup Pitch Deck Presentation
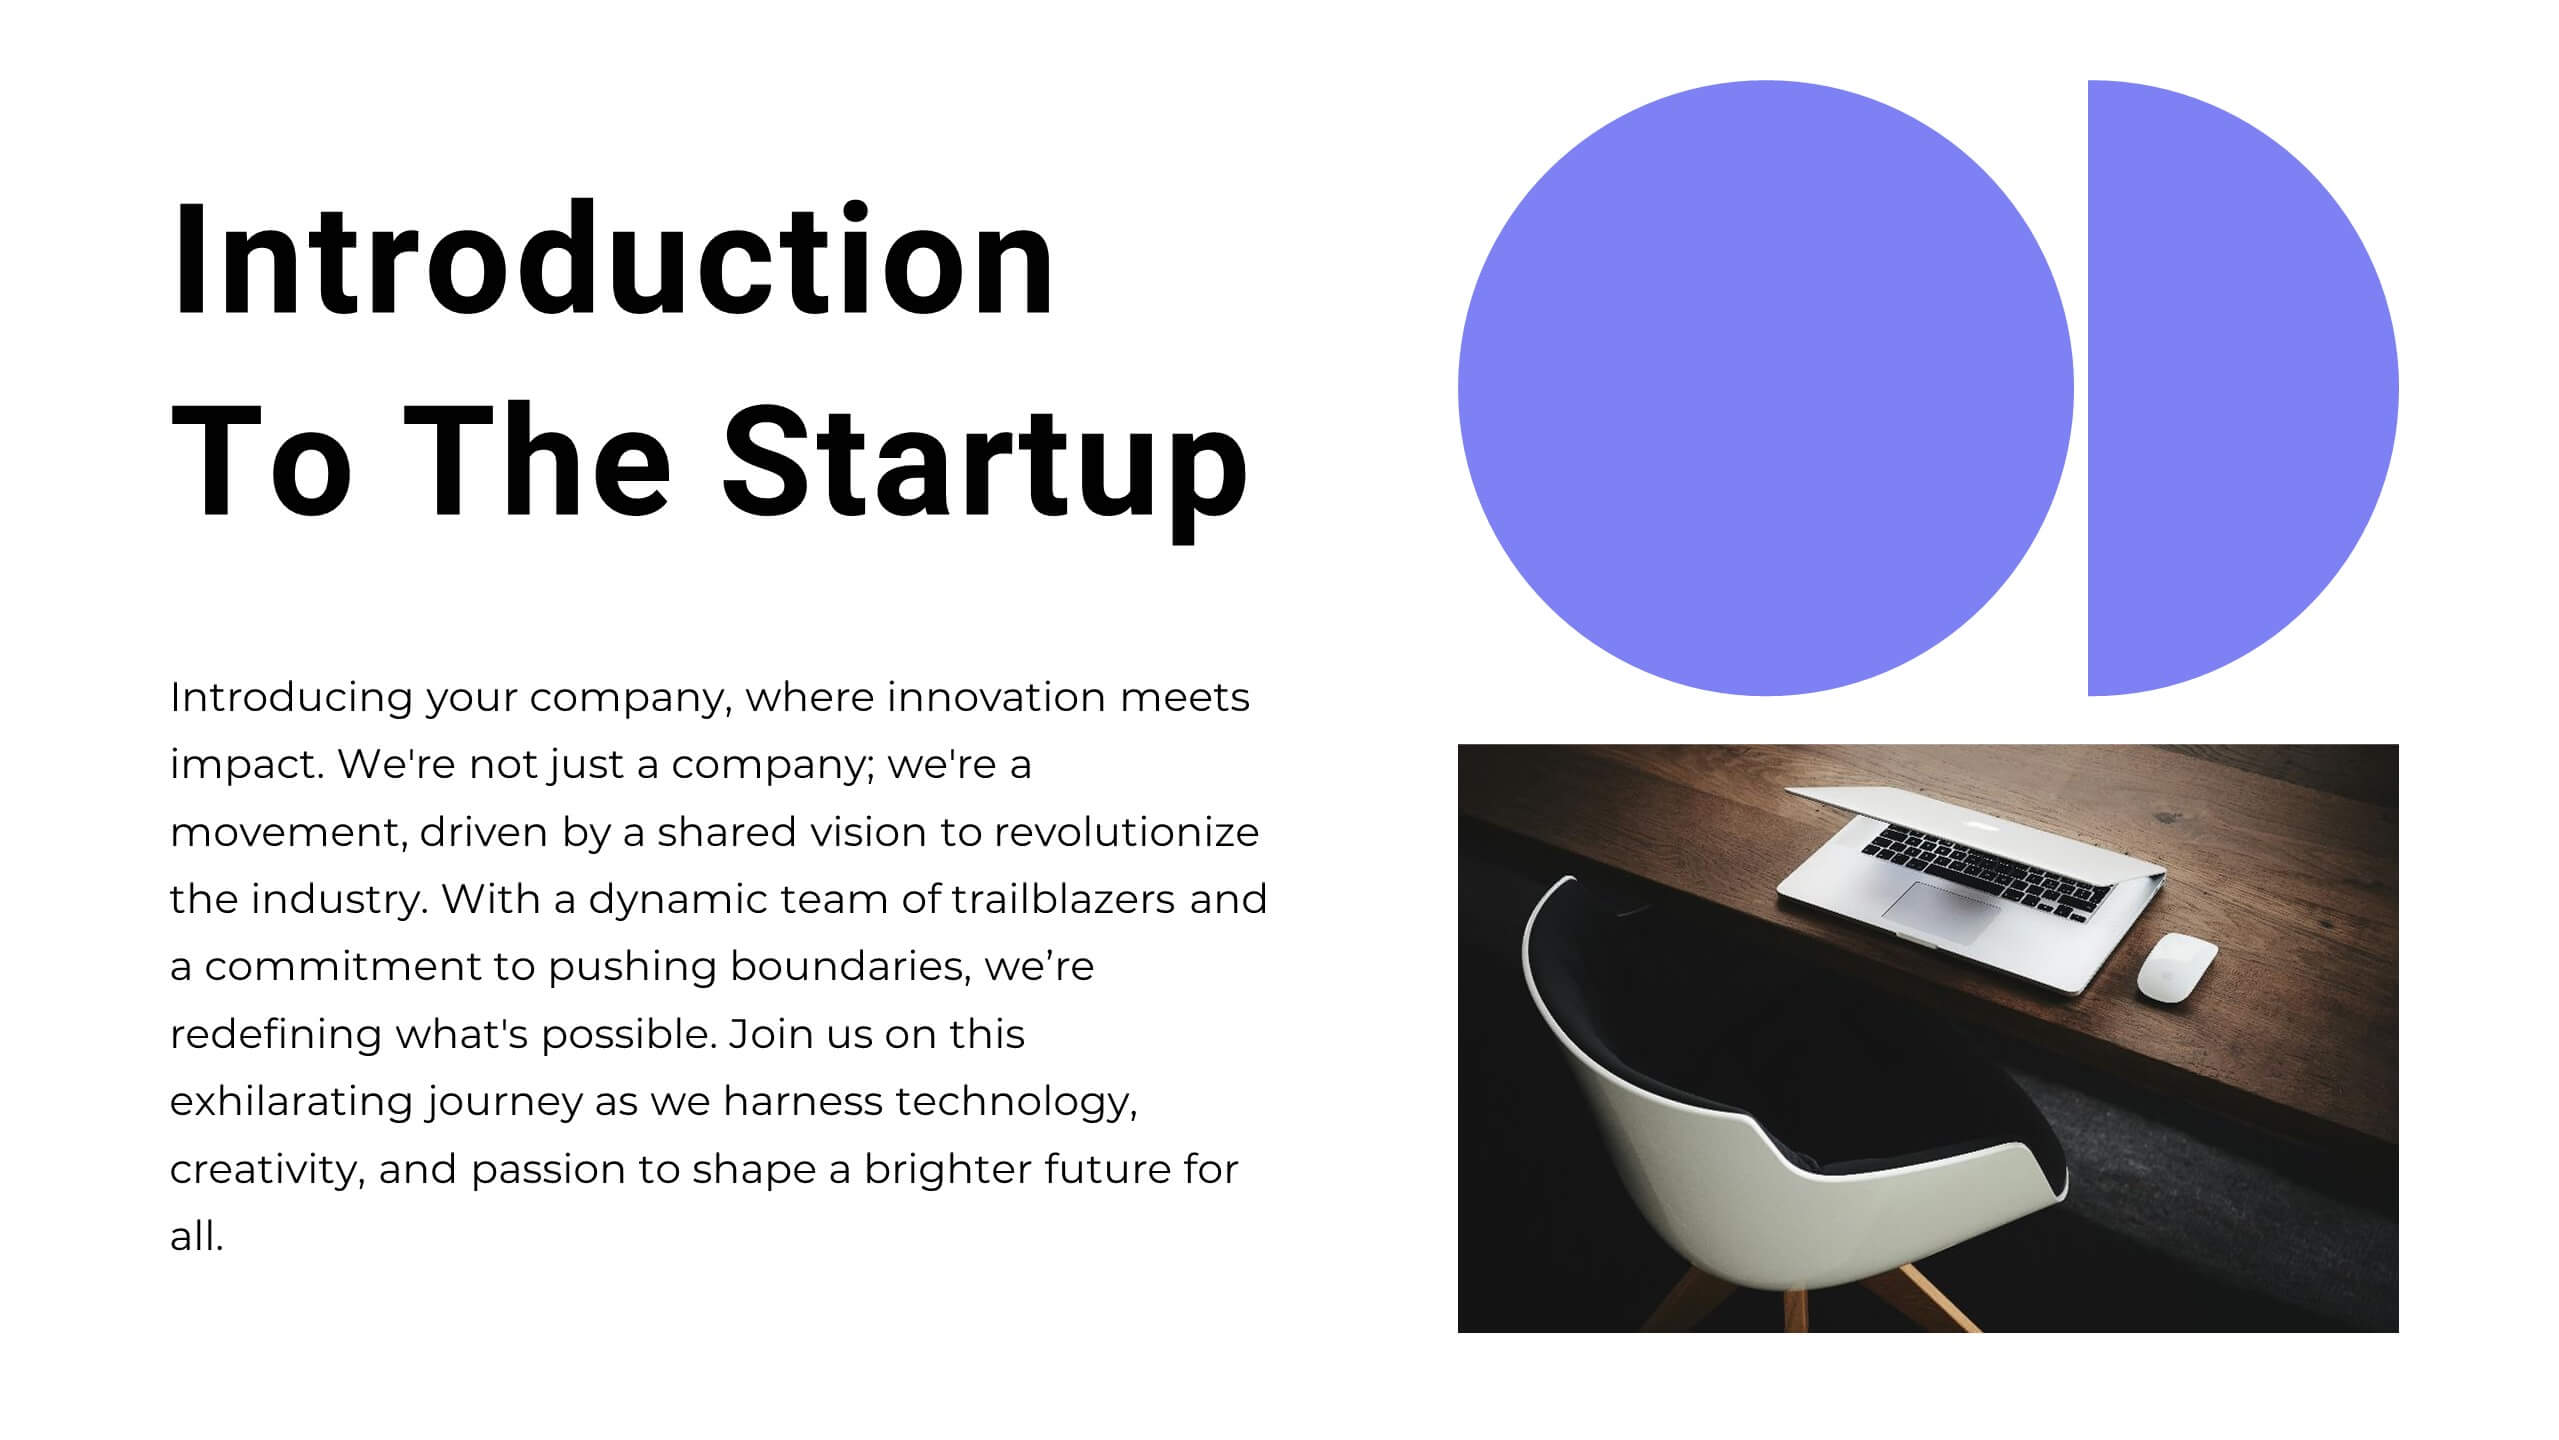
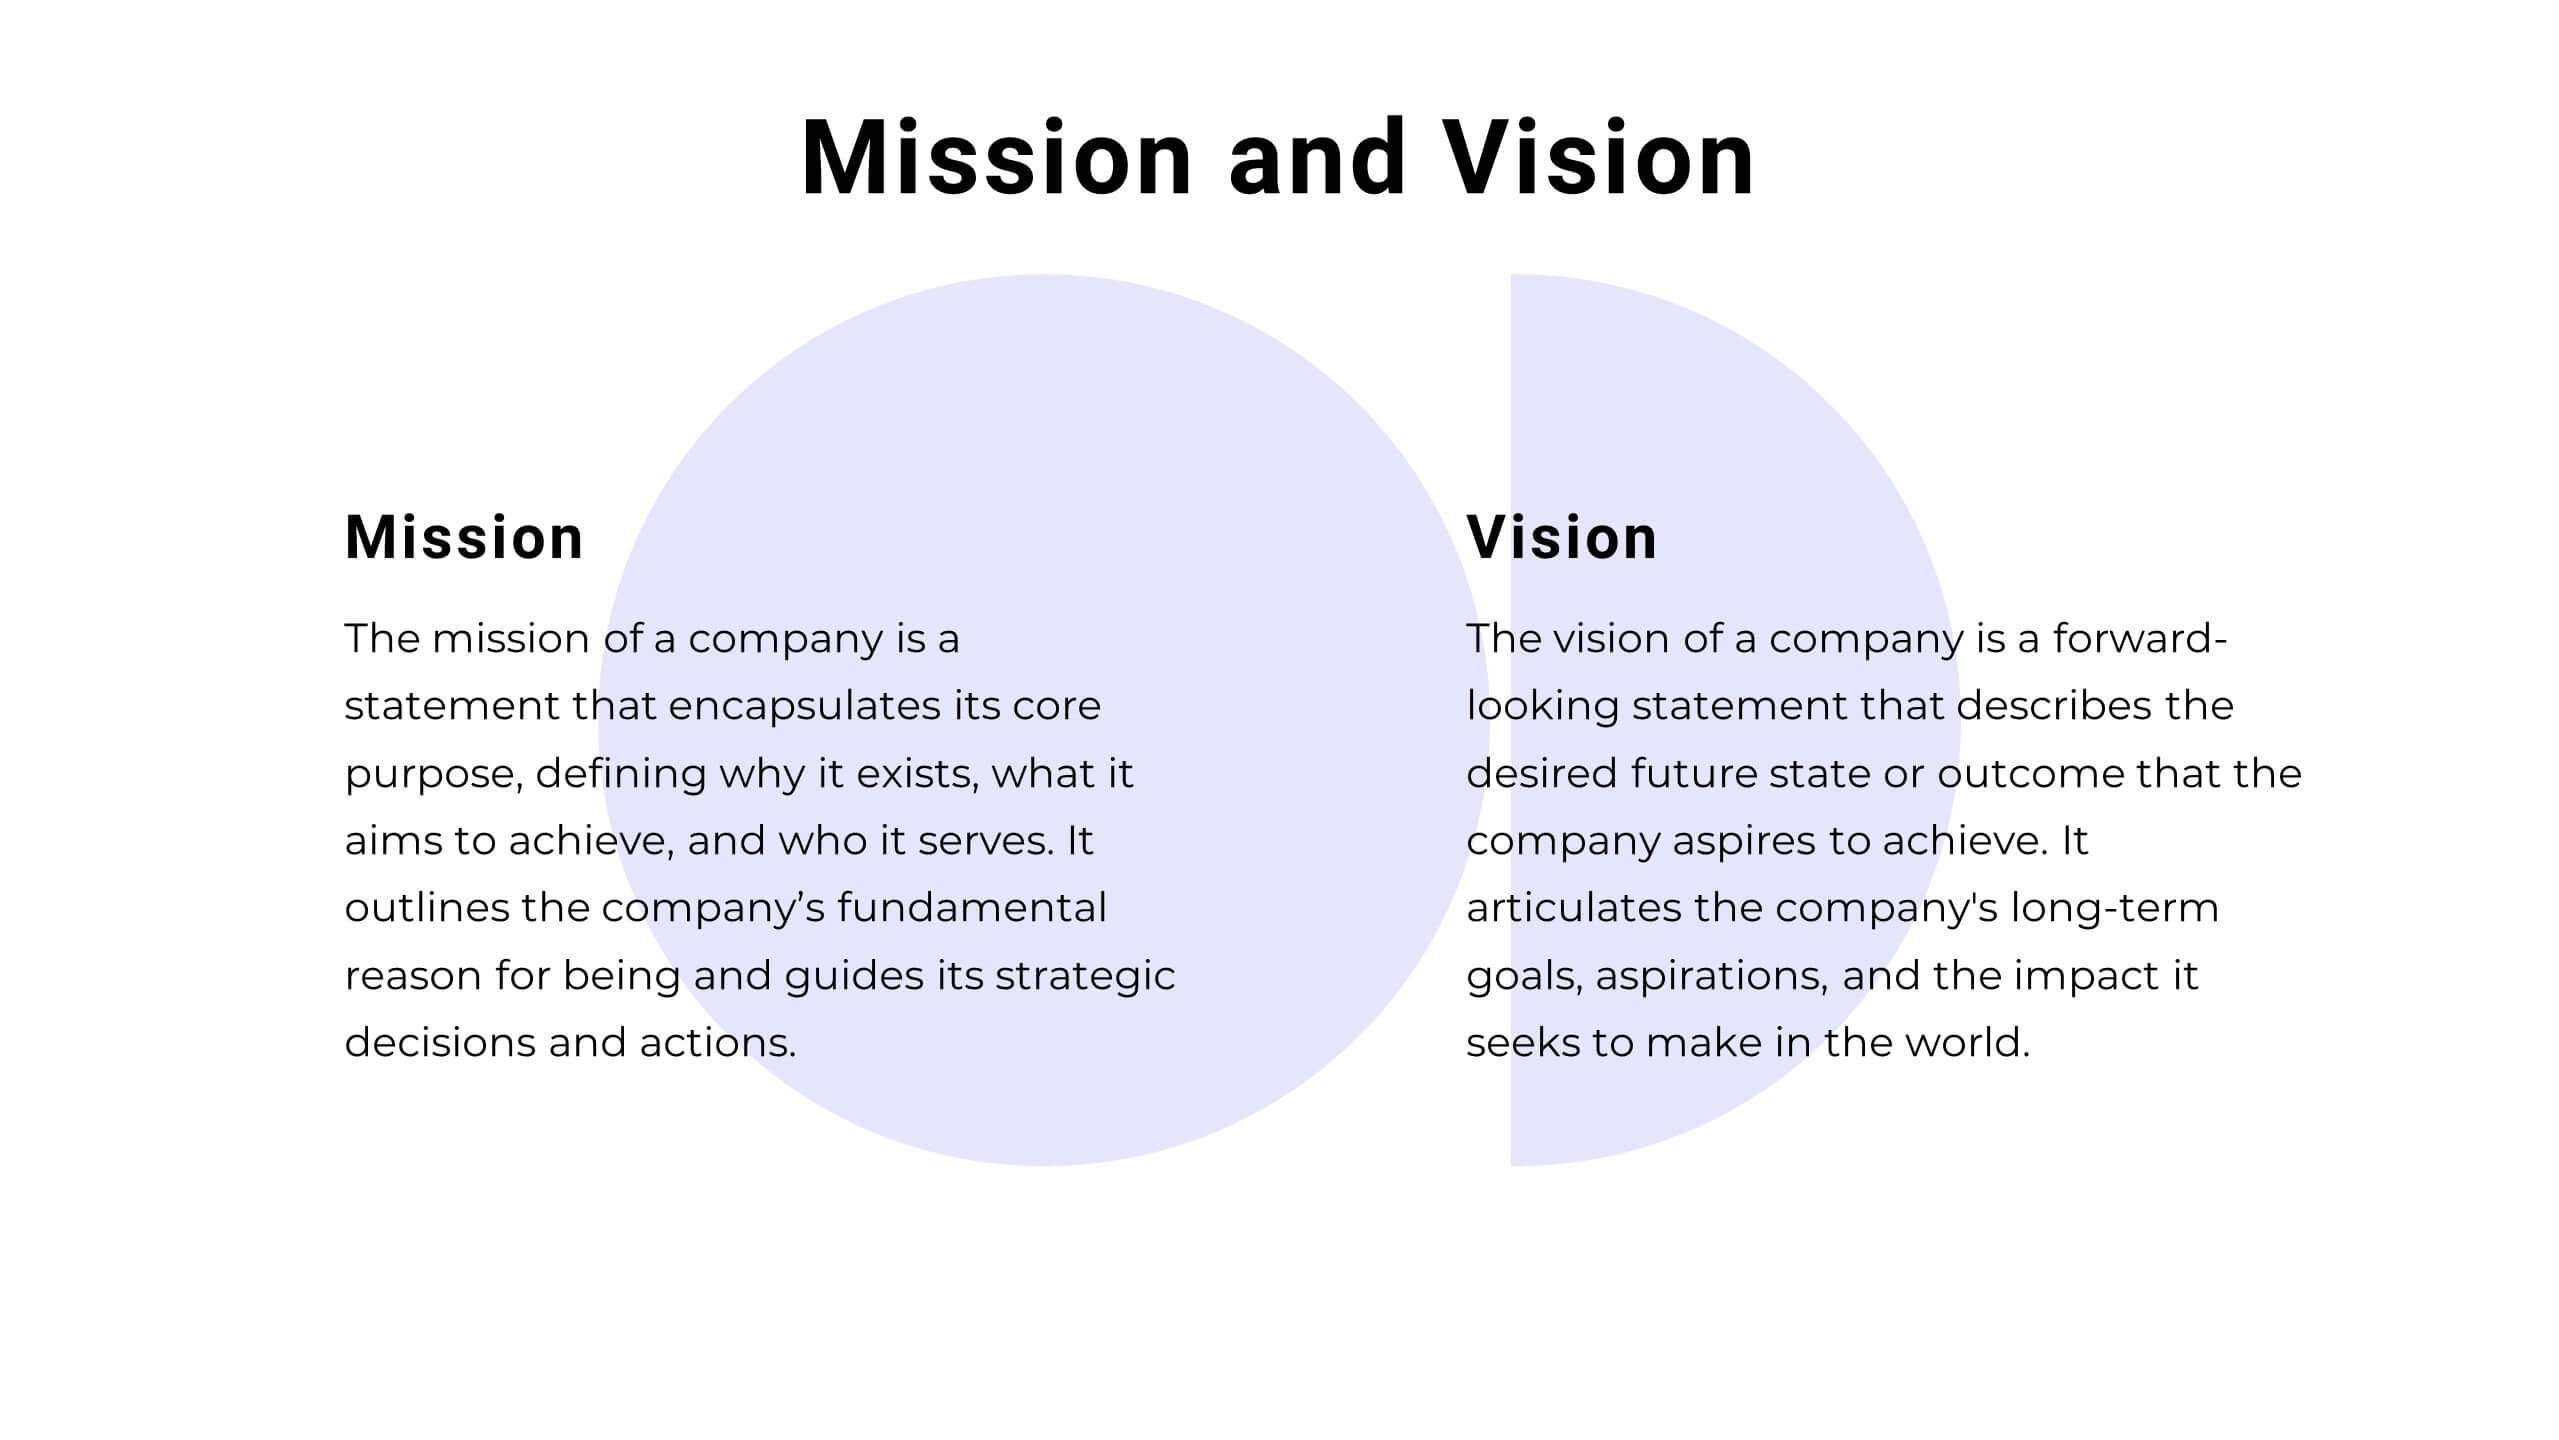
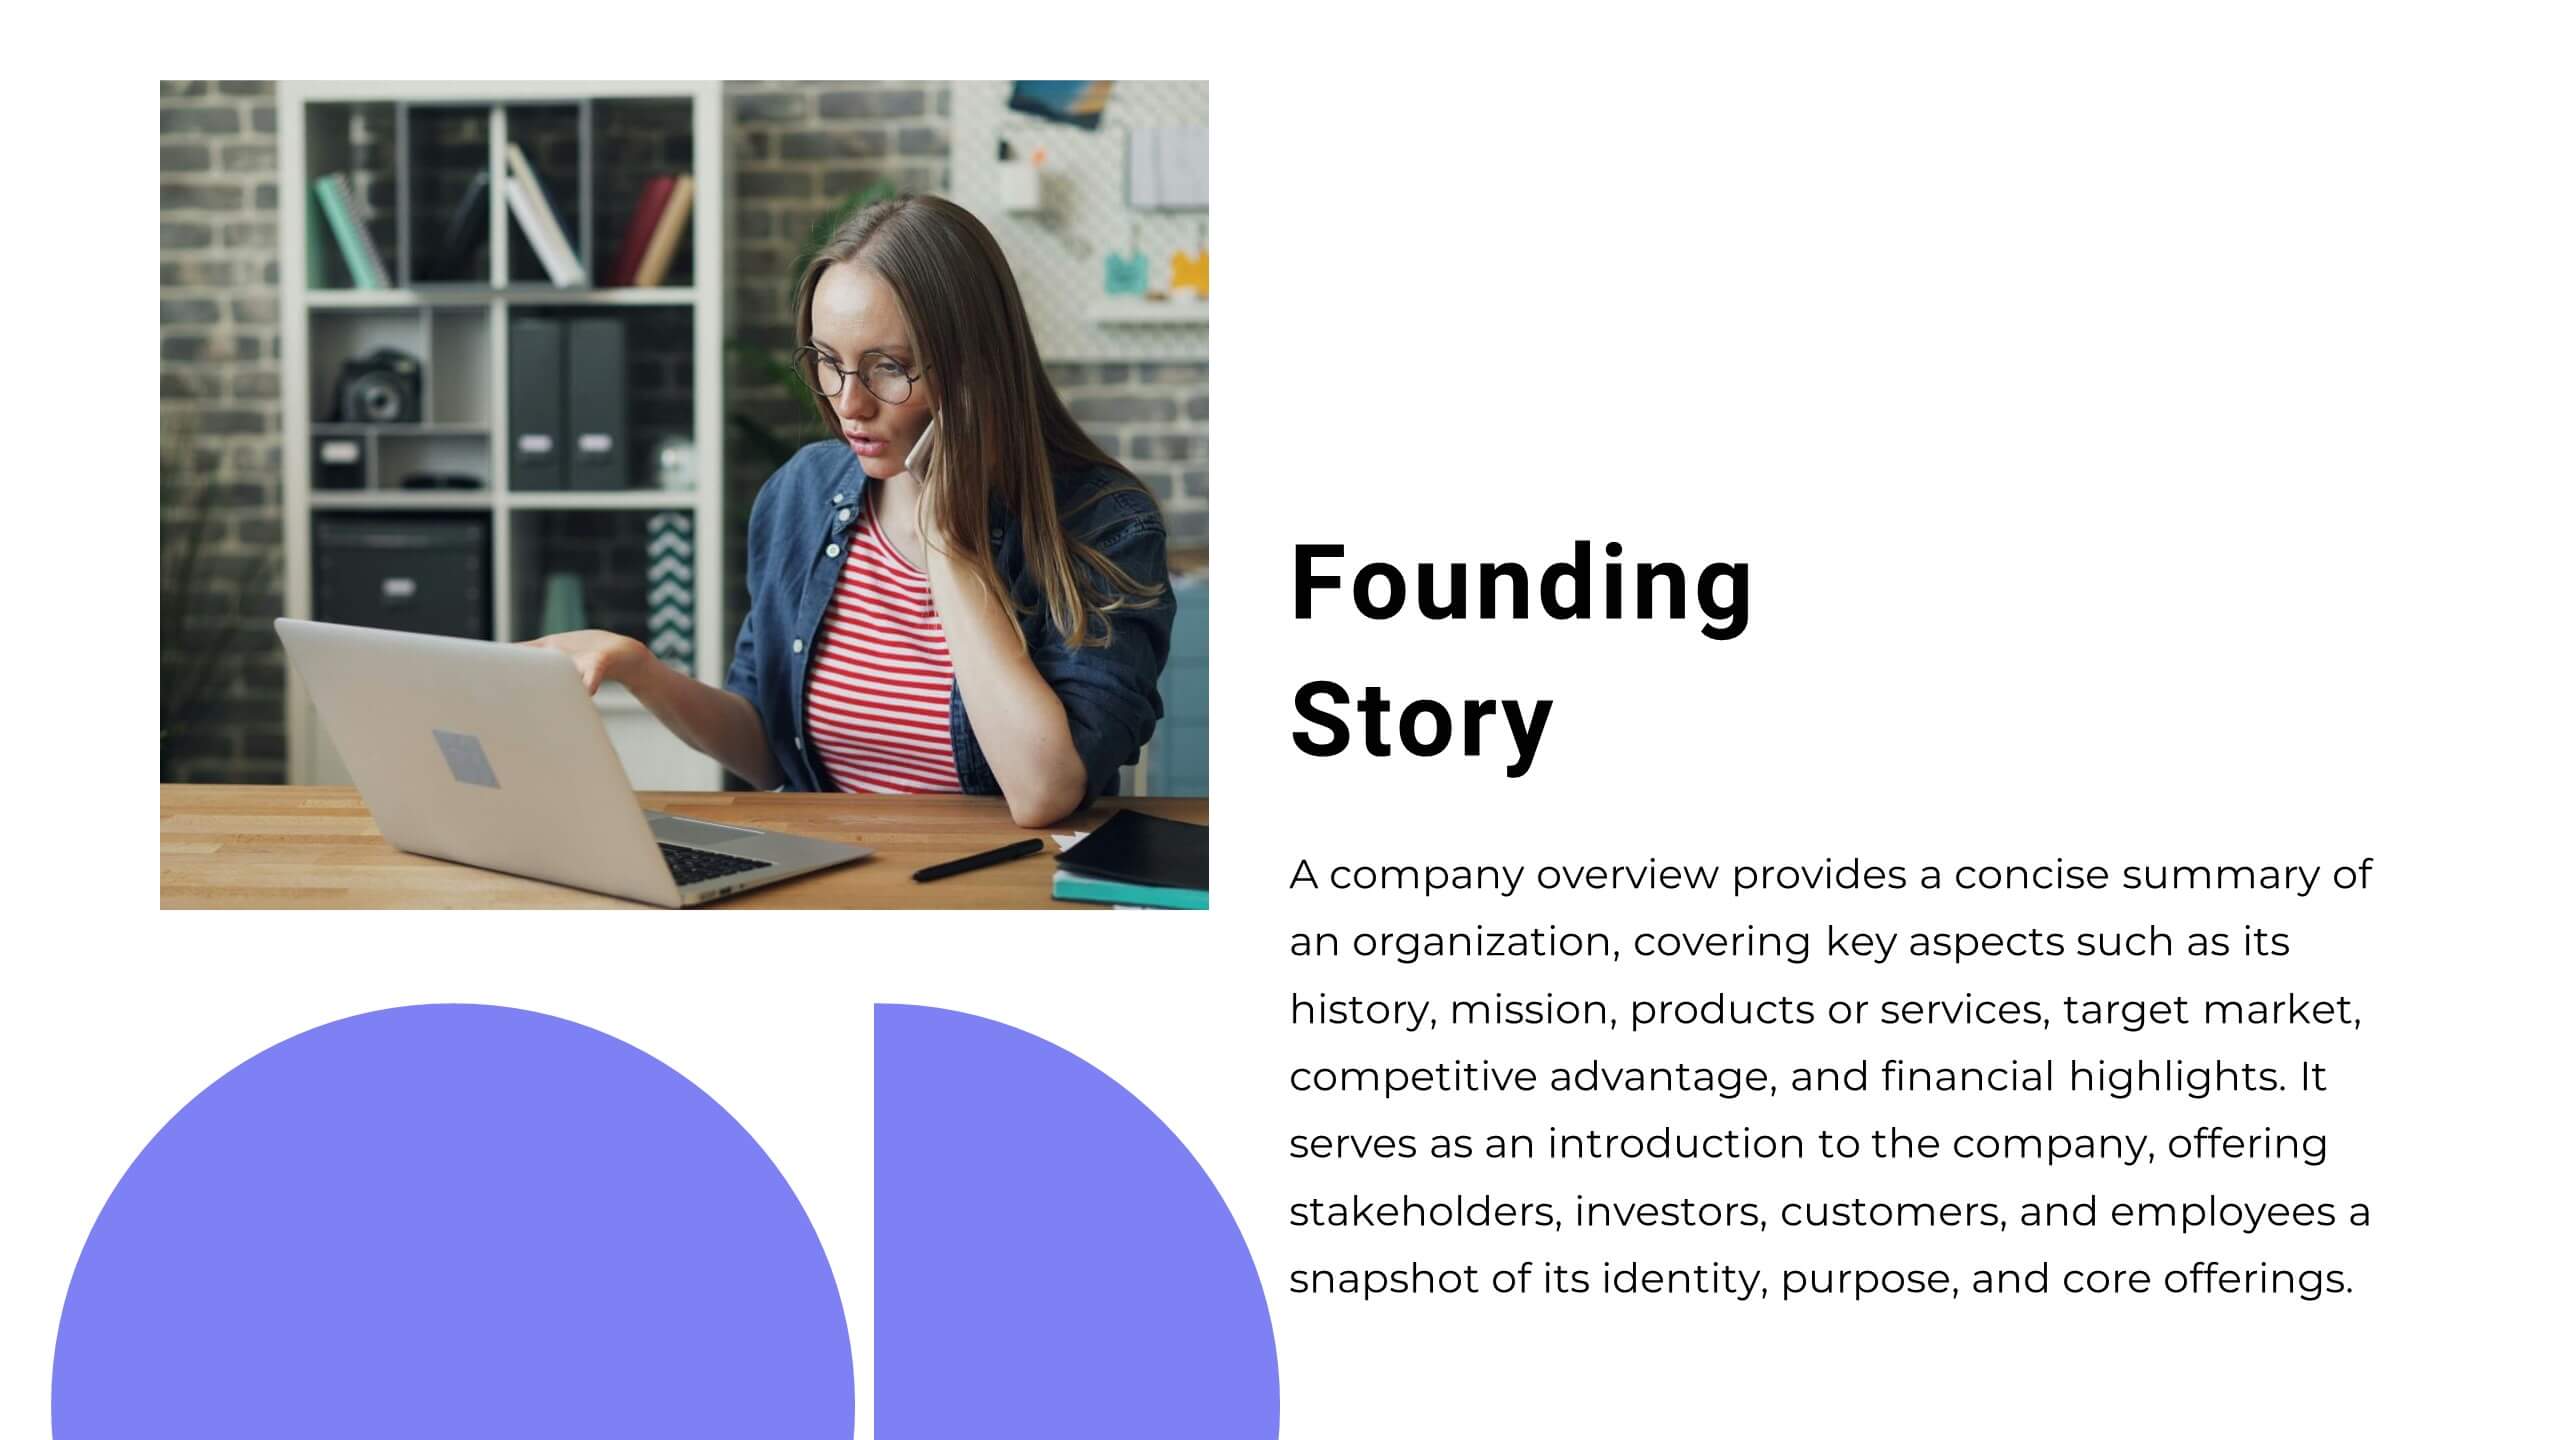
This dynamic and modern Startup Pitch Deck template is perfect for showcasing your startup's vision, strategy, and growth potential. Featuring a sleek design with bold visuals, this template guides you through key sections such as mission and vision, product/service overview, target market, and financial projections. It’s tailored to help you tell a compelling story that resonates with investors and stakeholders. The template is fully customizable in PowerPoint, Keynote, or Google Slides, ensuring you can adapt it to your specific needs and create a memorable presentation that leaves a lasting impression.


20 slides
Solstice Startup Funding Proposal Presentation
This sleek startup funding proposal deck showcases your company’s objectives, services, sales process, and pricing strategy. Perfect for pitching investors or stakeholders, its modern design ensures a professional presentation. Compatible with PowerPoint, Keynote, and Google Slides, it's ideal for making a strong impression with minimal effort.


6 slides
Safety Equipment Infographic
Safety equipment refers to various tools, devices, and gear that are designed to protect individuals from potential hazards and accidents in various environments and situations. This infographic involves presenting essential safety equipment, their uses, and benefits. With this template you can encourage your audience to prioritize the use of appropriate safety equipment. The combination of clear text, icons, and visuals will help viewers understand the significance of safety equipment and its role in preventing accidents and injuries. Compatible with Powerpoint, Keynote, and Google Slides. Choose a color scheme that aligns with safety and caution.


5 slides
Digital Marketing Infographics
Digital Marketing refers to the use of digital channels, platforms, and strategies to promote products, services, and brands to reach and engage with target audiences. These infographic templates are perfect for explaining concepts, illustrating processes, showcasing data, or comparing information. They are commonly used in digital marketing to provide information to clients, educate consumers, and promote products and services. These Infographics can be shared on social media, websites, and blogs to increase engagement and drive traffic to a brand's online presence. Compatible with Powerpoint, Keynote, and Google Slides.


5 slides
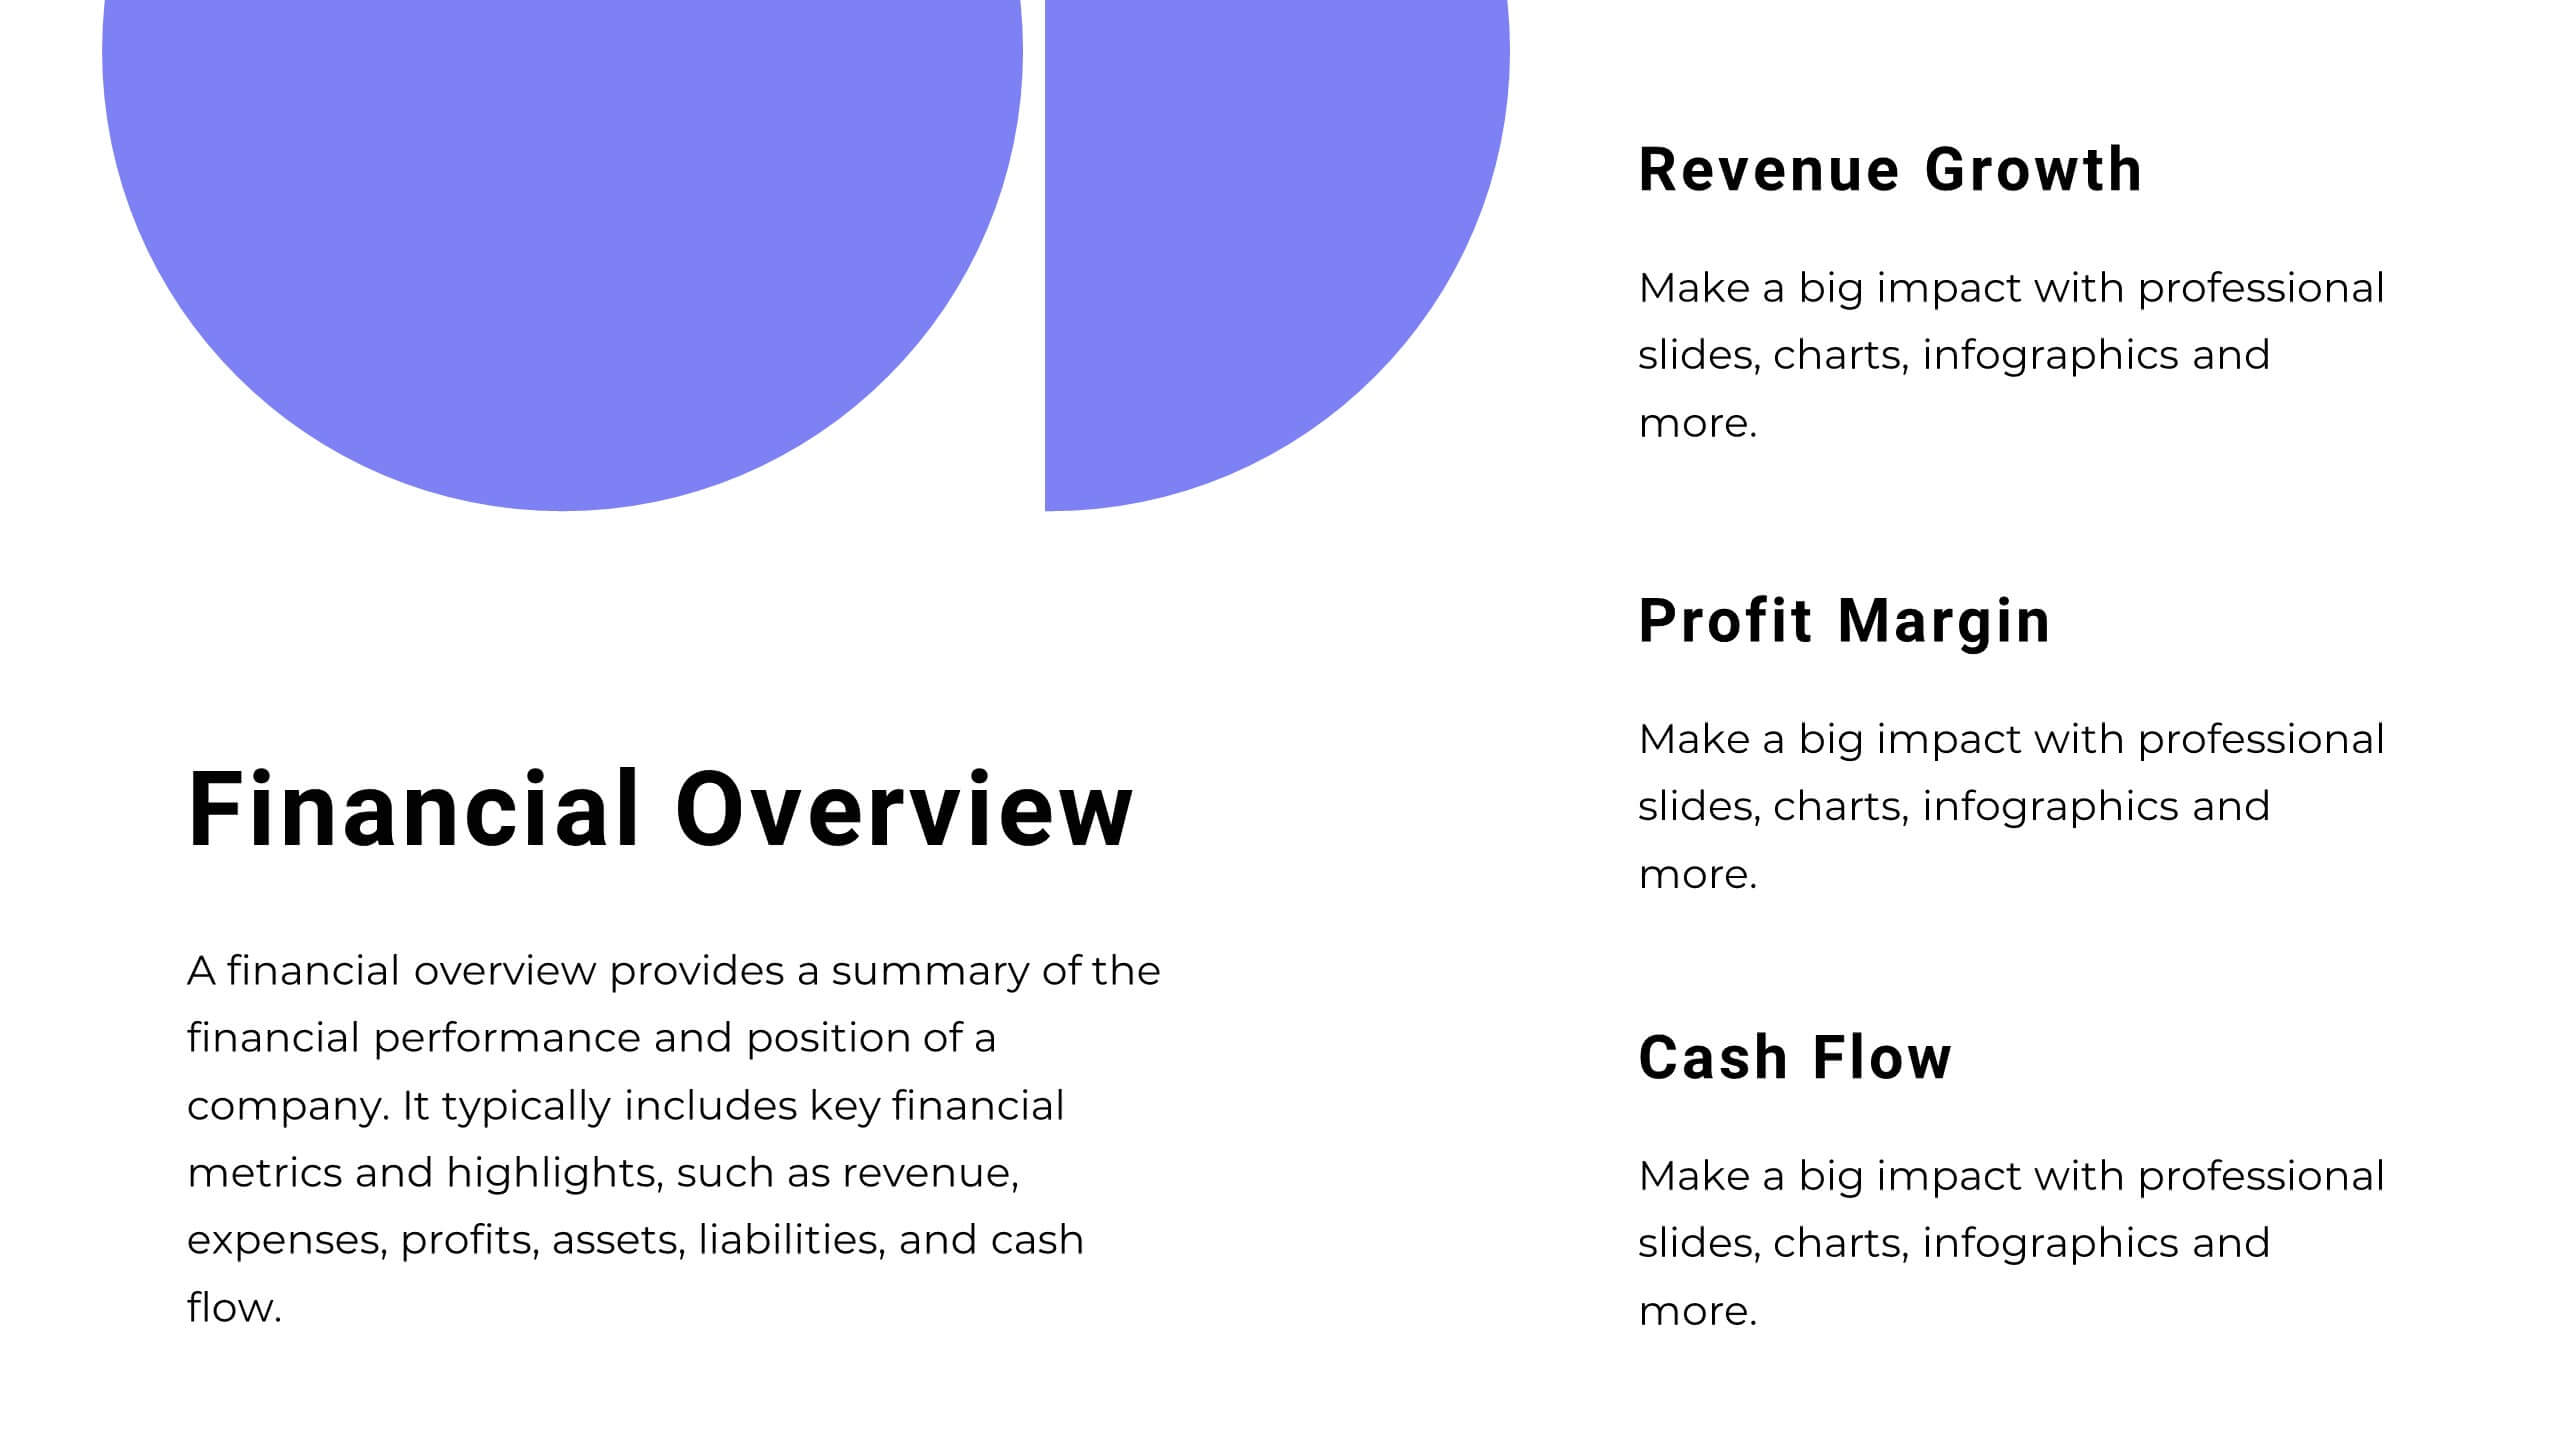
Annual Overview Report Template Presentation
Bring your yearly achievements to life with this sleek and structured layout designed for clarity and impact. Ideal for summarizing company performance, milestones, and future goals, it organizes data into easy-to-follow visuals. Fully editable and compatible with PowerPoint, Keynote, and Google Slides for a smooth presentation experience.


6 slides
Profit Threshold Break-Even Calculation Presentation
Illustrate financial performance with this profit threshold timeline. The layout spans from big loss to high profit, marking each stage with flag icons and editable labels. Ideal for break-even analysis, sales strategies, or ROI comparisons. Easily customizable in PowerPoint, Keynote, and Google Slides to match your brand’s visual identity.


21 slides
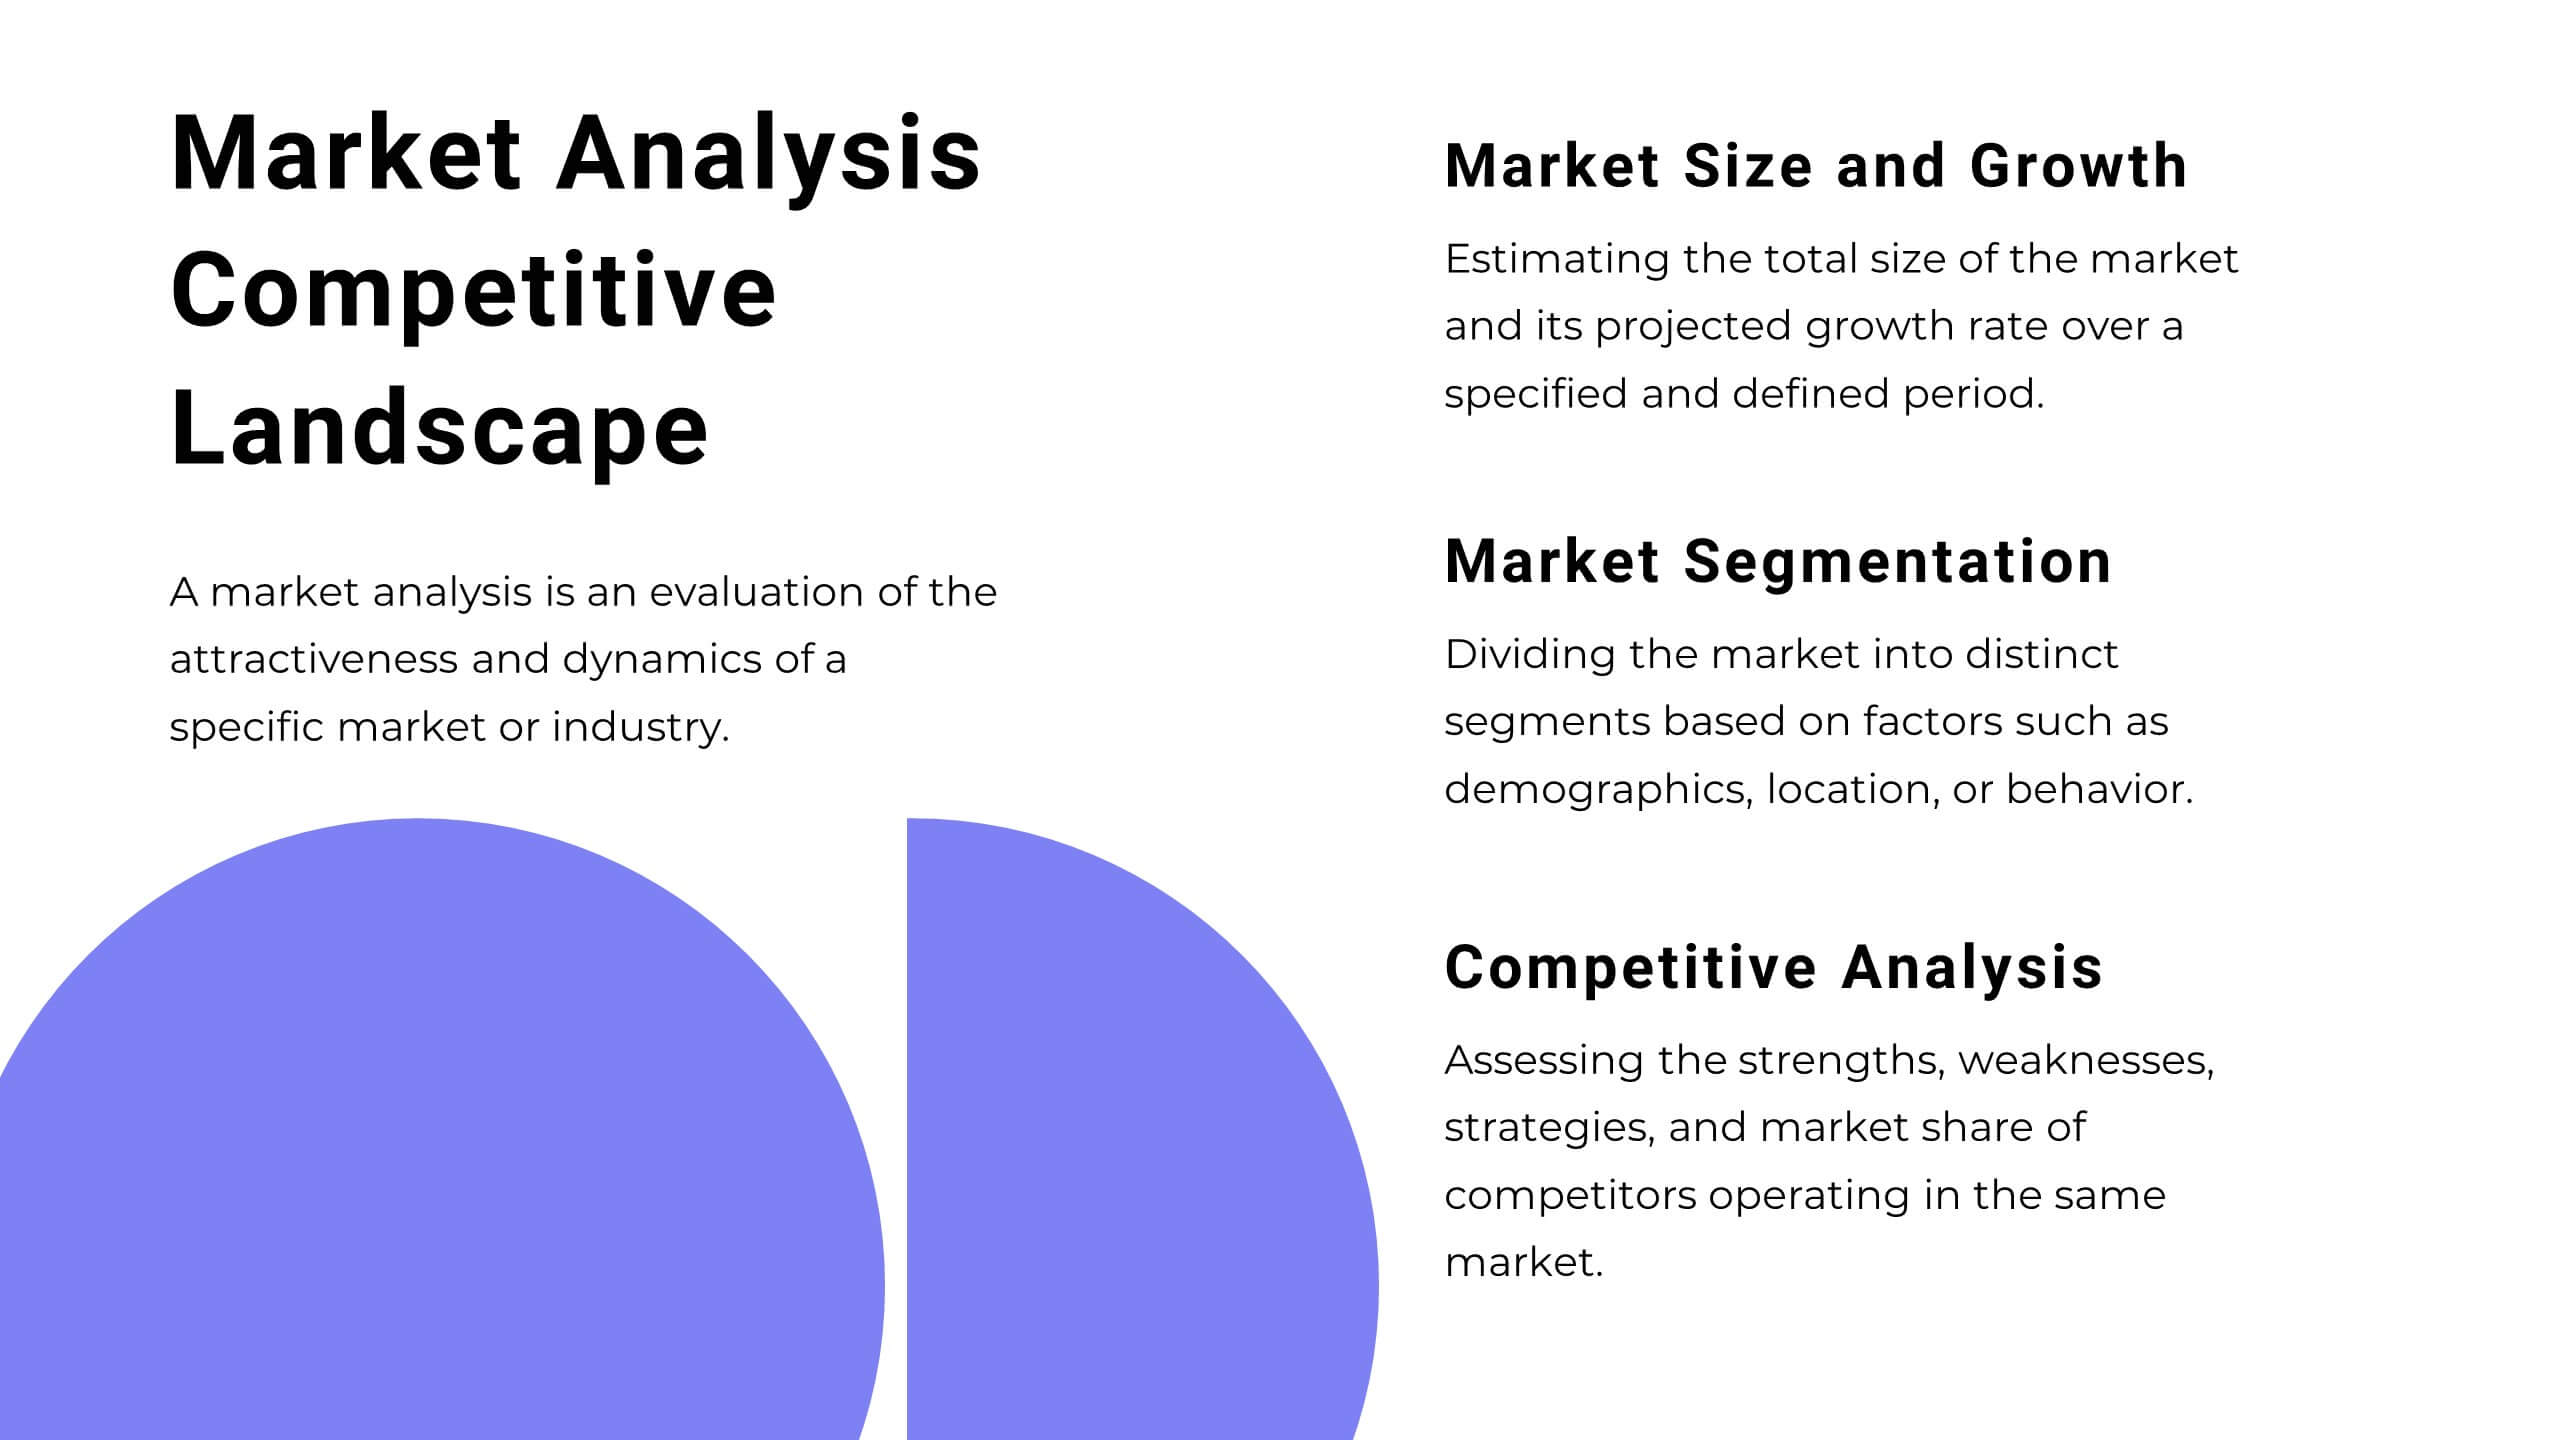
Mystorin Market Analysis Report Presentation
Present your market analysis findings with this sleek and professional report presentation template. Covering essential sections such as key highlights, performance metrics, competitor insights, and strategic initiatives, it provides a comprehensive framework for data-driven decisions. Ideal for businesses and analysts. Compatible with PowerPoint, Keynote, and Google Slides for easy customization.


7 slides
KPI Dashboard Infographic Presentation Template
A KPI (Key Performance Indicator) dashboard is a visual tool that displays important metrics and data related to a specific business or organizational goal. It allows users to track and monitor key performance indicators (KPIs) over time, making it easier to identify trends, track progress, and make data-driven decisions. This template is perfect for keeping track of important information about your business or organization. This template include a variety of charts, graphs, and tables that present information in an easy-to-understand format. Customized to track different types of data.


22 slides
Syncopate Agency Portfolio Presentation
Showcase your agency’s expertise and achievements with a professional portfolio presentation designed to captivate and inform. This versatile template is tailored for agencies looking to highlight their services, approach, and client success stories with clarity and impact. The presentation includes thoughtfully designed slides covering company mission, market analysis, creative processes, case studies, and future strategies. Utilize dedicated sections to detail campaign executions, partnership opportunities, and awards received. The layout balances aesthetic appeal with functionality, ensuring your audience remains engaged throughout your presentation. Compatible with PowerPoint, Google Slides, and Keynote, this template is fully customizable. Easily edit colors, text, and images to align with your agency's branding. Present your portfolio with confidence, leaving a lasting impression on clients, partners, and stakeholders.


5 slides
Cloud Technology Architecture Presentation
Visualize the power of modern connectivity with this clean and professional template designed to explain digital systems, cloud layers, and data flow. Ideal for tech teams and IT presentations, it simplifies complex information into clear visuals. Fully editable and compatible with PowerPoint, Keynote, and Google Slides for effortless customization.


7 slides
5G Mobile infographic Presentation
5G technology is important because it has the potential to transform the way we live, work, and interact with the world around us. This template is designed to help you create an eye catching and informative infographic on the topic of 5G technology. With this template, you can easily showcase the benefits and capabilities of 5G in an easy to understand way. This template features a vibrant and clean design, with uniquely selected color schemes and fonts to ensure that the content is visually appealing. It includes a variety of slide layouts, including text slides, images, charts and graphs!


7 slides
Pillar Points Infographic Presentation
A Pillar Infographic presents information on a specific topic or subject in a clear and organized manner. It consists of several sections or "pillars" that are interconnected and support the overall message of the infographic. In this template each pillar can be used to represent different aspects of the topic being discussed. Each section contains relevant data, statistics, and other information that illustrates the aspect. This can be used in marketing and advertising to promote products or services, as well as in education and journalism to explain complex ideas in a visually appealing way.


4 slides
Patient Care Plan and Metrics Presentation
Turn healthcare data into meaningful stories with this modern and professional presentation. Perfect for highlighting patient progress, clinical outcomes, and care efficiency, it balances visuals and data for clarity and impact. Easy to edit and fully compatible with PowerPoint, Keynote, and Google Slides for smooth customization.


19 slides
Philosium Design Strategy Proposal Presentation
Bring your creative vision to life with this sleek and structured design strategy proposal presentation. Covering key elements like concept development, wireframes, typography, and user research, this template helps you communicate a compelling design approach. Fully customizable and compatible with PowerPoint, Keynote, and Google Slides for a seamless and professional presentation experience.


10 slides
Cause and Effect Fishbone Presentation
Visualize root causes and streamline analysis with this Cause and Effect Fishbone infographic. Ideal for identifying issues across categories, it helps present logical flows clearly. Fully editable and perfect for business, strategy, or process improvement discussions. Compatible with PowerPoint, Keynote, and Google Slides for effortless customization.


6 slides
Corporation Schedule Infographics
Elevate your corporate presentations with our Corporation Schedule infographic, expertly designed for compatibility with Powerpoint, Keynote, and Google Slides. This practical and polished infographic is an exceptional resource for managers, team leads, and event coordinators planning and presenting schedules, timelines, and agendas. The infographic is structured to visually organize and communicate a corporation's schedule, making it an invaluable tool for outlining project timelines, meeting agendas, or corporate event itineraries. Its clear, concise format is specifically tailored to the business environment, where readability and quick comprehension are paramount. Integrating this infographic into your presentation will not only enhance its professional appearance but also facilitate effective time management and ensure alignment across teams. Whether you’re detailing a week-long conference schedule or outlining a project’s phases, this infographic provides a streamlined approach to sharing that information with your audience. It’s a strategic way to keep everyone informed and focused on the company's key timeframes and objectives.


5 slides
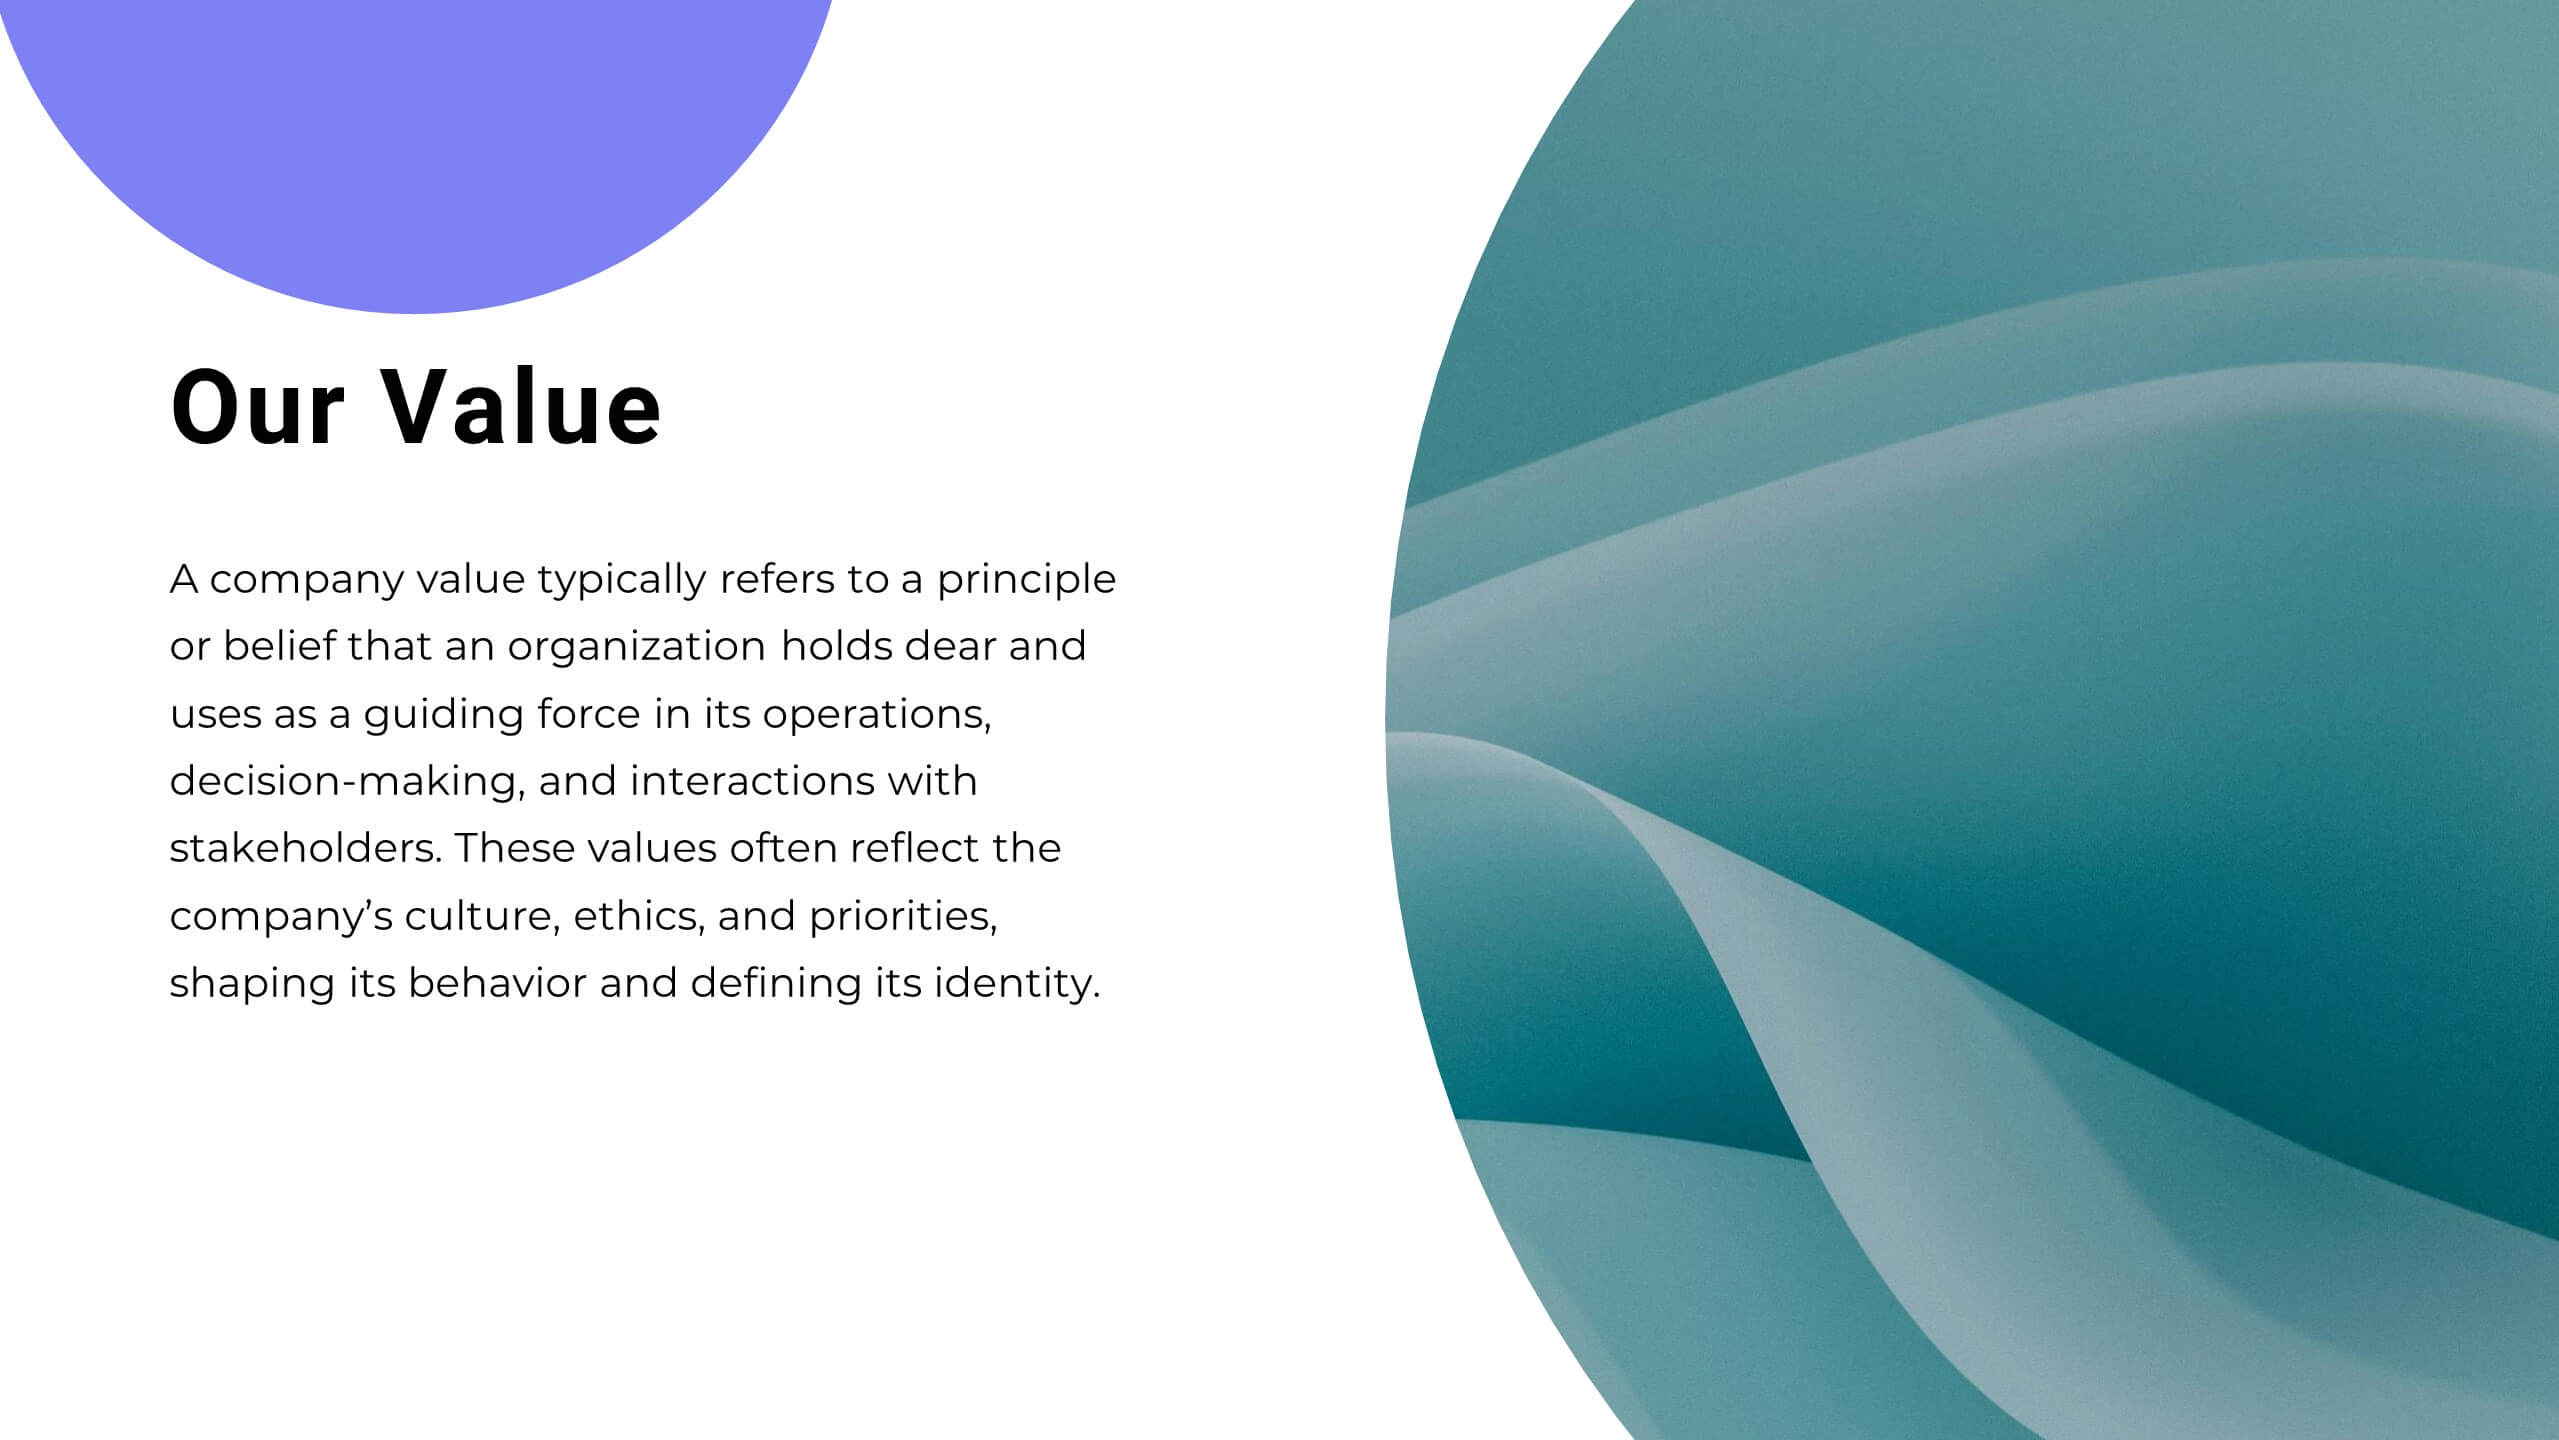
Purpose-Driven Mission and Values Presentation
Present your organization’s core purpose and guiding principles with this Purpose-Driven Mission and Values presentation. This clean, flag-style layout is perfect for showcasing five key pillars such as integrity, collaboration, or innovation. Easily customizable in Canva, PowerPoint, or Google Slides to align with your brand.