


Features
- 8 Unique slides
- Fully editable and easy to edit in Microsoft Powerpoint, Keynote and Google Slides
- 16:9 widescreen layout
- Clean and professional designs
- Export to JPG, PDF or send by email


Do you have any questions?
Recommend


7 slides
Transportation & Logistics Management Infographic
Transportation and logistics refer to the management, planning, and coordination of the movement of goods, people, and information from one place to another. This professionally crafted template is designed to guide and inspire professionals in the fast-paced domain of transportation and logistics management. Explore key concepts, strategies, and best practices that drive operational excellence and ensure seamless supply chain movements. This is compatible with Powerpoint, Keynote, and Google Slides. This infographic is your compass through the world of transportation and logistics.


7 slides
Professional Goals Infographic
Unfold the pathway to success with our professional goals infographic. Designed to help individuals and organizations visualize and track their aspirations, this infographic offers a comprehensive look at professional milestones and strategies to achieve them. The primary palette revolves around a pristine white backdrop, enhanced by accents of vibrant orange and a mix of complementary colors to distinguish different areas. Its design ensures seamless integration into PowerPoint, Keynote, or Google Slides presentations, transforming your professional goals discourse into a visually engaging experience.


5 slides
Sprint Planning and Agile Cycle Overview Presentation
Break down agile sprints with this clean, circular cycle layout. Ideal for scrum teams and product managers to illustrate sprint planning, task flow, and iterative progress. Includes five key stages with icon support. Fully customizable in PowerPoint, Keynote, and Google Slides for agile ceremonies, planning sessions, or team training.


12 slides
Corporate Sustainability Strategy Presentation
Achieve your sustainability goals with the Corporate Sustainability Strategy Presentation template. This modern, visually engaging layout helps businesses showcase their environmental, social, and governance (ESG) initiatives, sustainability roadmaps, and corporate responsibility plans. Featuring clear, structured sections, this fully customizable design is perfect for corporate leaders, consultants, and eco-conscious organizations. Compatible with PowerPoint, Keynote, and Google Slides for effortless editing and presentation.


10 slides
Corporate Growth Strategy Presentation
Elevate your corporate presentations with our "Corporate Growth Strategy Presentation" template. Designed to visually represent key growth strategies, this infographic uses a wrench graphic to symbolize the tools necessary for business expansion. Each segment of the wrench is color-coded, highlighting different strategic elements clearly and effectively. This format aids in discussing business objectives systematically, from foundational practices to advanced goals. Ideal for executives, strategists, and business analysts, this template ensures professional and coherent delivery of complex strategies. Compatible with PowerPoint, Keynote, and Google Slides, it is an indispensable tool for articulating and presenting sophisticated corporate strategies.


26 slides
Film Industry Vintage Presentation
The film industry, also known as the cinema or movie industry, refers to the collection of companies, professionals, and organizations involved in the production, distribution, and exhibition of films. This presentation template has a nostalgic design tailored for film enthusiasts, filmmakers, historians, or anyone looking to delve into the rich history of cinema. This presentation offers a visually appealing and well-curated journey through the evolution of the film industry, highlighting key milestones, iconic films, and the pioneers who shaped its development. Utilize the vintage illustrations and diagrams to illustrate film advancements.


5 slides
Hierarchical Pyramid Chart Presentation
Bring structure to your ideas with a clean, layered visual that makes complexity feel easy to navigate. This presentation helps you explain levels, priorities, and organizational breakdowns with clarity and flow. Ideal for planning, strategy, and reporting. Fully compatible with PowerPoint, Keynote, and Google Slides.


4 slides
Strategic Planning Business Framework Presentation
Sharpen your strategic vision with the Strategic Planning Business Framework presentation. This modern, radial diagram slide uses a target-and-arrow layout to symbolize precision, focus, and goal alignment across four key business areas. Each quadrant features customizable sections for initiatives, insights, or performance metrics—ideal for planning sessions, quarterly reviews, or executive briefings. The clean design and visual balance make your content easy to understand at a glance. Fully editable and compatible with PowerPoint, Keynote, and Google Slides.


6 slides
RAPID Responsibility Matrix Infographics
Efficiently manage responsibilities and tasks with our RAPID Responsibility Matrix infographic template. This template is fully compatible with popular presentation software such as PowerPoint, Keynote, and Google Slides, allowing you to easily customize it to meet your specific project needs. The RAPID Responsibility Matrix infographic template offers a structured framework for defining roles and responsibilities within your team or organization. Whether you're a project manager, team leader, or simply looking to streamline workflows, this template provides a user-friendly platform to create clear and concise matrices for your projects. Optimize your project management processes with this SEO-optimized RAPID Responsibility Matrix infographic template, thoughtfully designed for clarity and ease of use. Customize it to assign and communicate responsibilities effectively, ensuring smooth collaboration and project success. Start crafting your personalized infographic today!


4 slides
Sales and Reach Across Asia Map Presentation
Visualize your company’s market presence with the Sales and Reach Across Asia Map Presentation. Featuring clean markers, color-coded regions, and icon-labeled highlights, this template helps you clearly showcase key sales zones, distribution channels, or growth markets across Asia. Perfect for business reviews, expansion pitches, and performance updates. Fully editable in PowerPoint, Keynote, Google Slides, and Canva.


10 slides
4-Step Business Process Presentation
Present your ideas with clarity and impact using this clean, structured layout made for professionals who value organization and design. Perfect for outlining strategies, steps, or lists, it keeps your message focused and engaging. Easily customizable and fully compatible with PowerPoint, Keynote, and Google Slides for polished results.


7 slides
Female Anatomy Infographic
Anatomy is the branch of biology that focuses on the structure and organization of living things. Step into a world of discovery with our infographic template, this is an enlightening visual guide that celebrates the intricate beauty and functionality of the female body. This infographic is designed to educate and empower, offering a clear and artistic representation of the anatomy that defines women. This template will take your audience through an educational journey through the various systems that make up a woman's body. This is fully customizable and compatible with Powerpoint, Keynote, and Google Slides.


7 slides
Chart Comparison Infographic Presentation
Chart Comparison is the process of comparing different charts or graphs to identify similarities. It involves analyzing multiple sets of data by visually presenting them in charts. Use this template to show the comparison of various charts and how things look when they are compared. This template will help you create a professional Infographic presentation that highlights the key differences between data sets. Each chart can have it's own color, so you can use any color you want. You can also add text in the chart with your own content, and edit in Powerpoint, Keynote, or Google Slides.


4 slides
Surface vs Depth Model Iceberg Presentation
Uncover the unseen with this Surface vs Depth Model Iceberg presentation. Designed to highlight the contrast between visible factors (15%) and underlying elements (85%), this layout is ideal for business analysis, user behavior, or strategic planning. Fully editable in Canva, PowerPoint, and Google Slides for seamless customization.


5 slides
Performance Progress and Achievements Presentation
Showcase your team’s accomplishments and growth over time with this visually engaging bar chart layout. Each performance level is color-coded for clarity and paired with space for concise descriptions. Ideal for reporting KPIs, quarterly wins, or business milestones. Fully customizable in PowerPoint, Keynote, and Google Slides.


5 slides
Strategic Blue Ocean Shift Presentation
Dive into bold new thinking with a slide that makes strategic transformation feel clear, focused, and actionable. This presentation breaks down key decisions that help teams shift from competitive pressure to value innovation, making complex choices easy to visualize and present. Fully compatible with PowerPoint, Keynote, and Google Slides.

20 slides
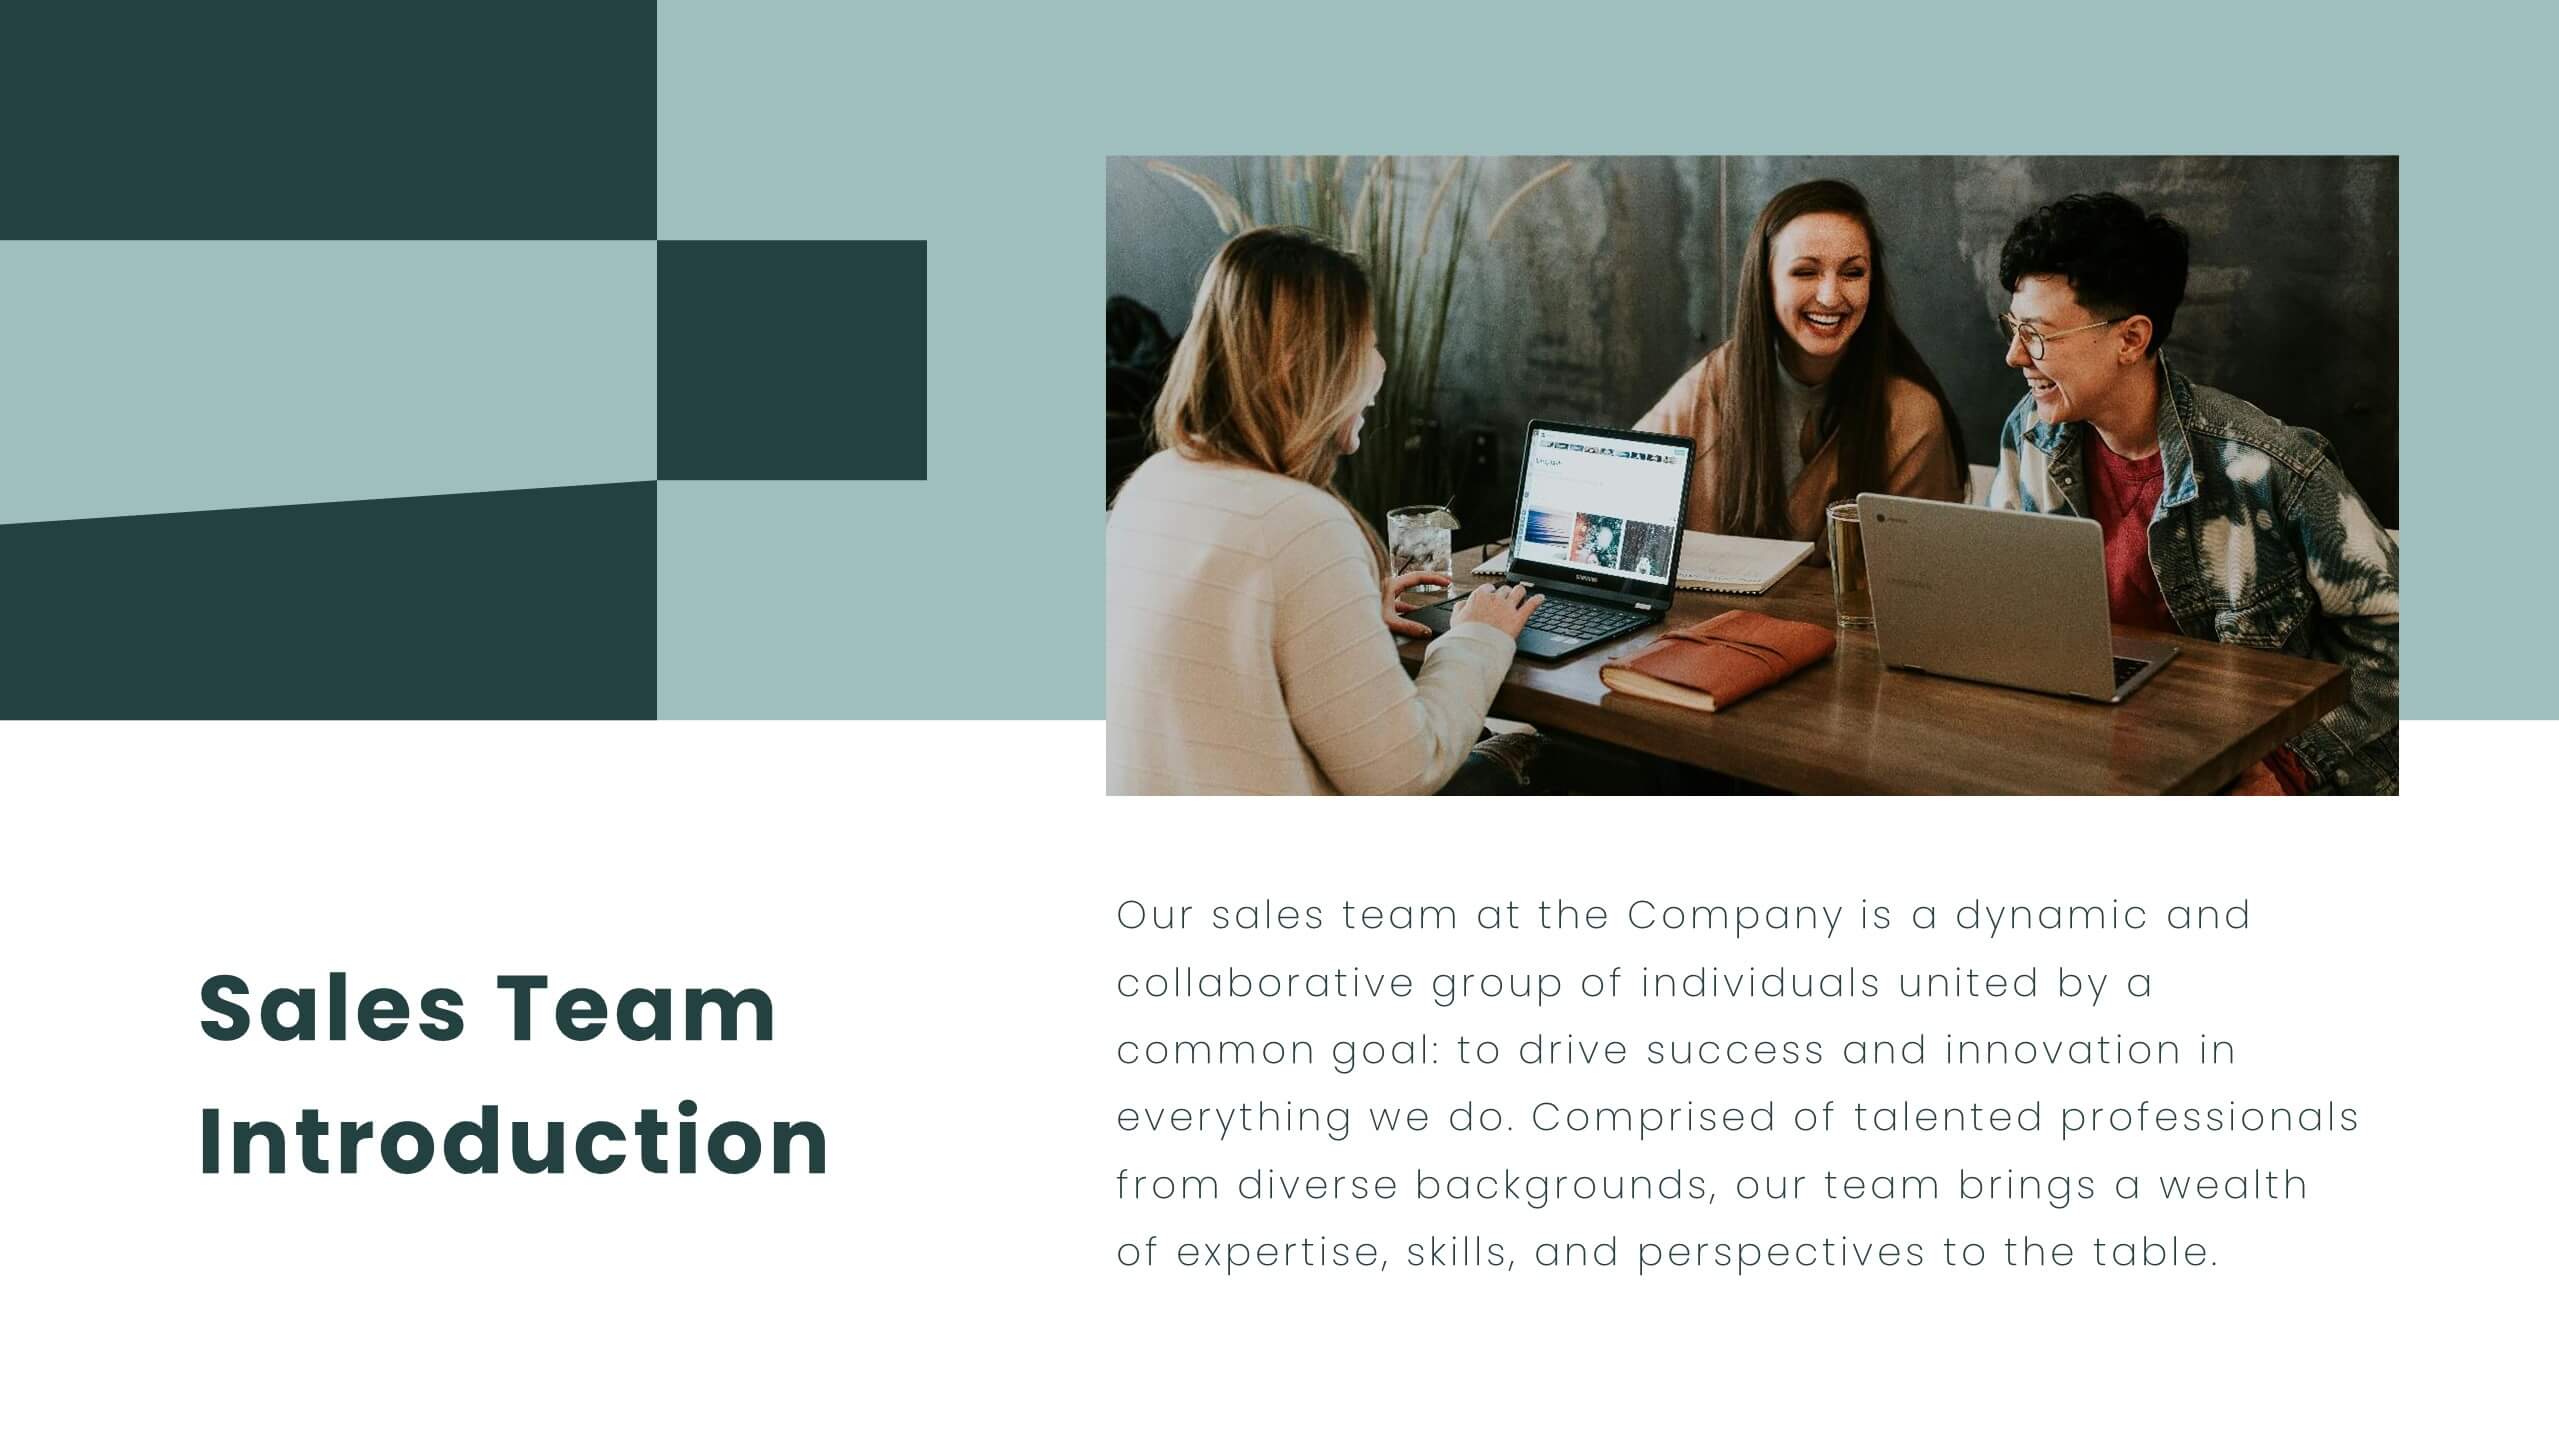
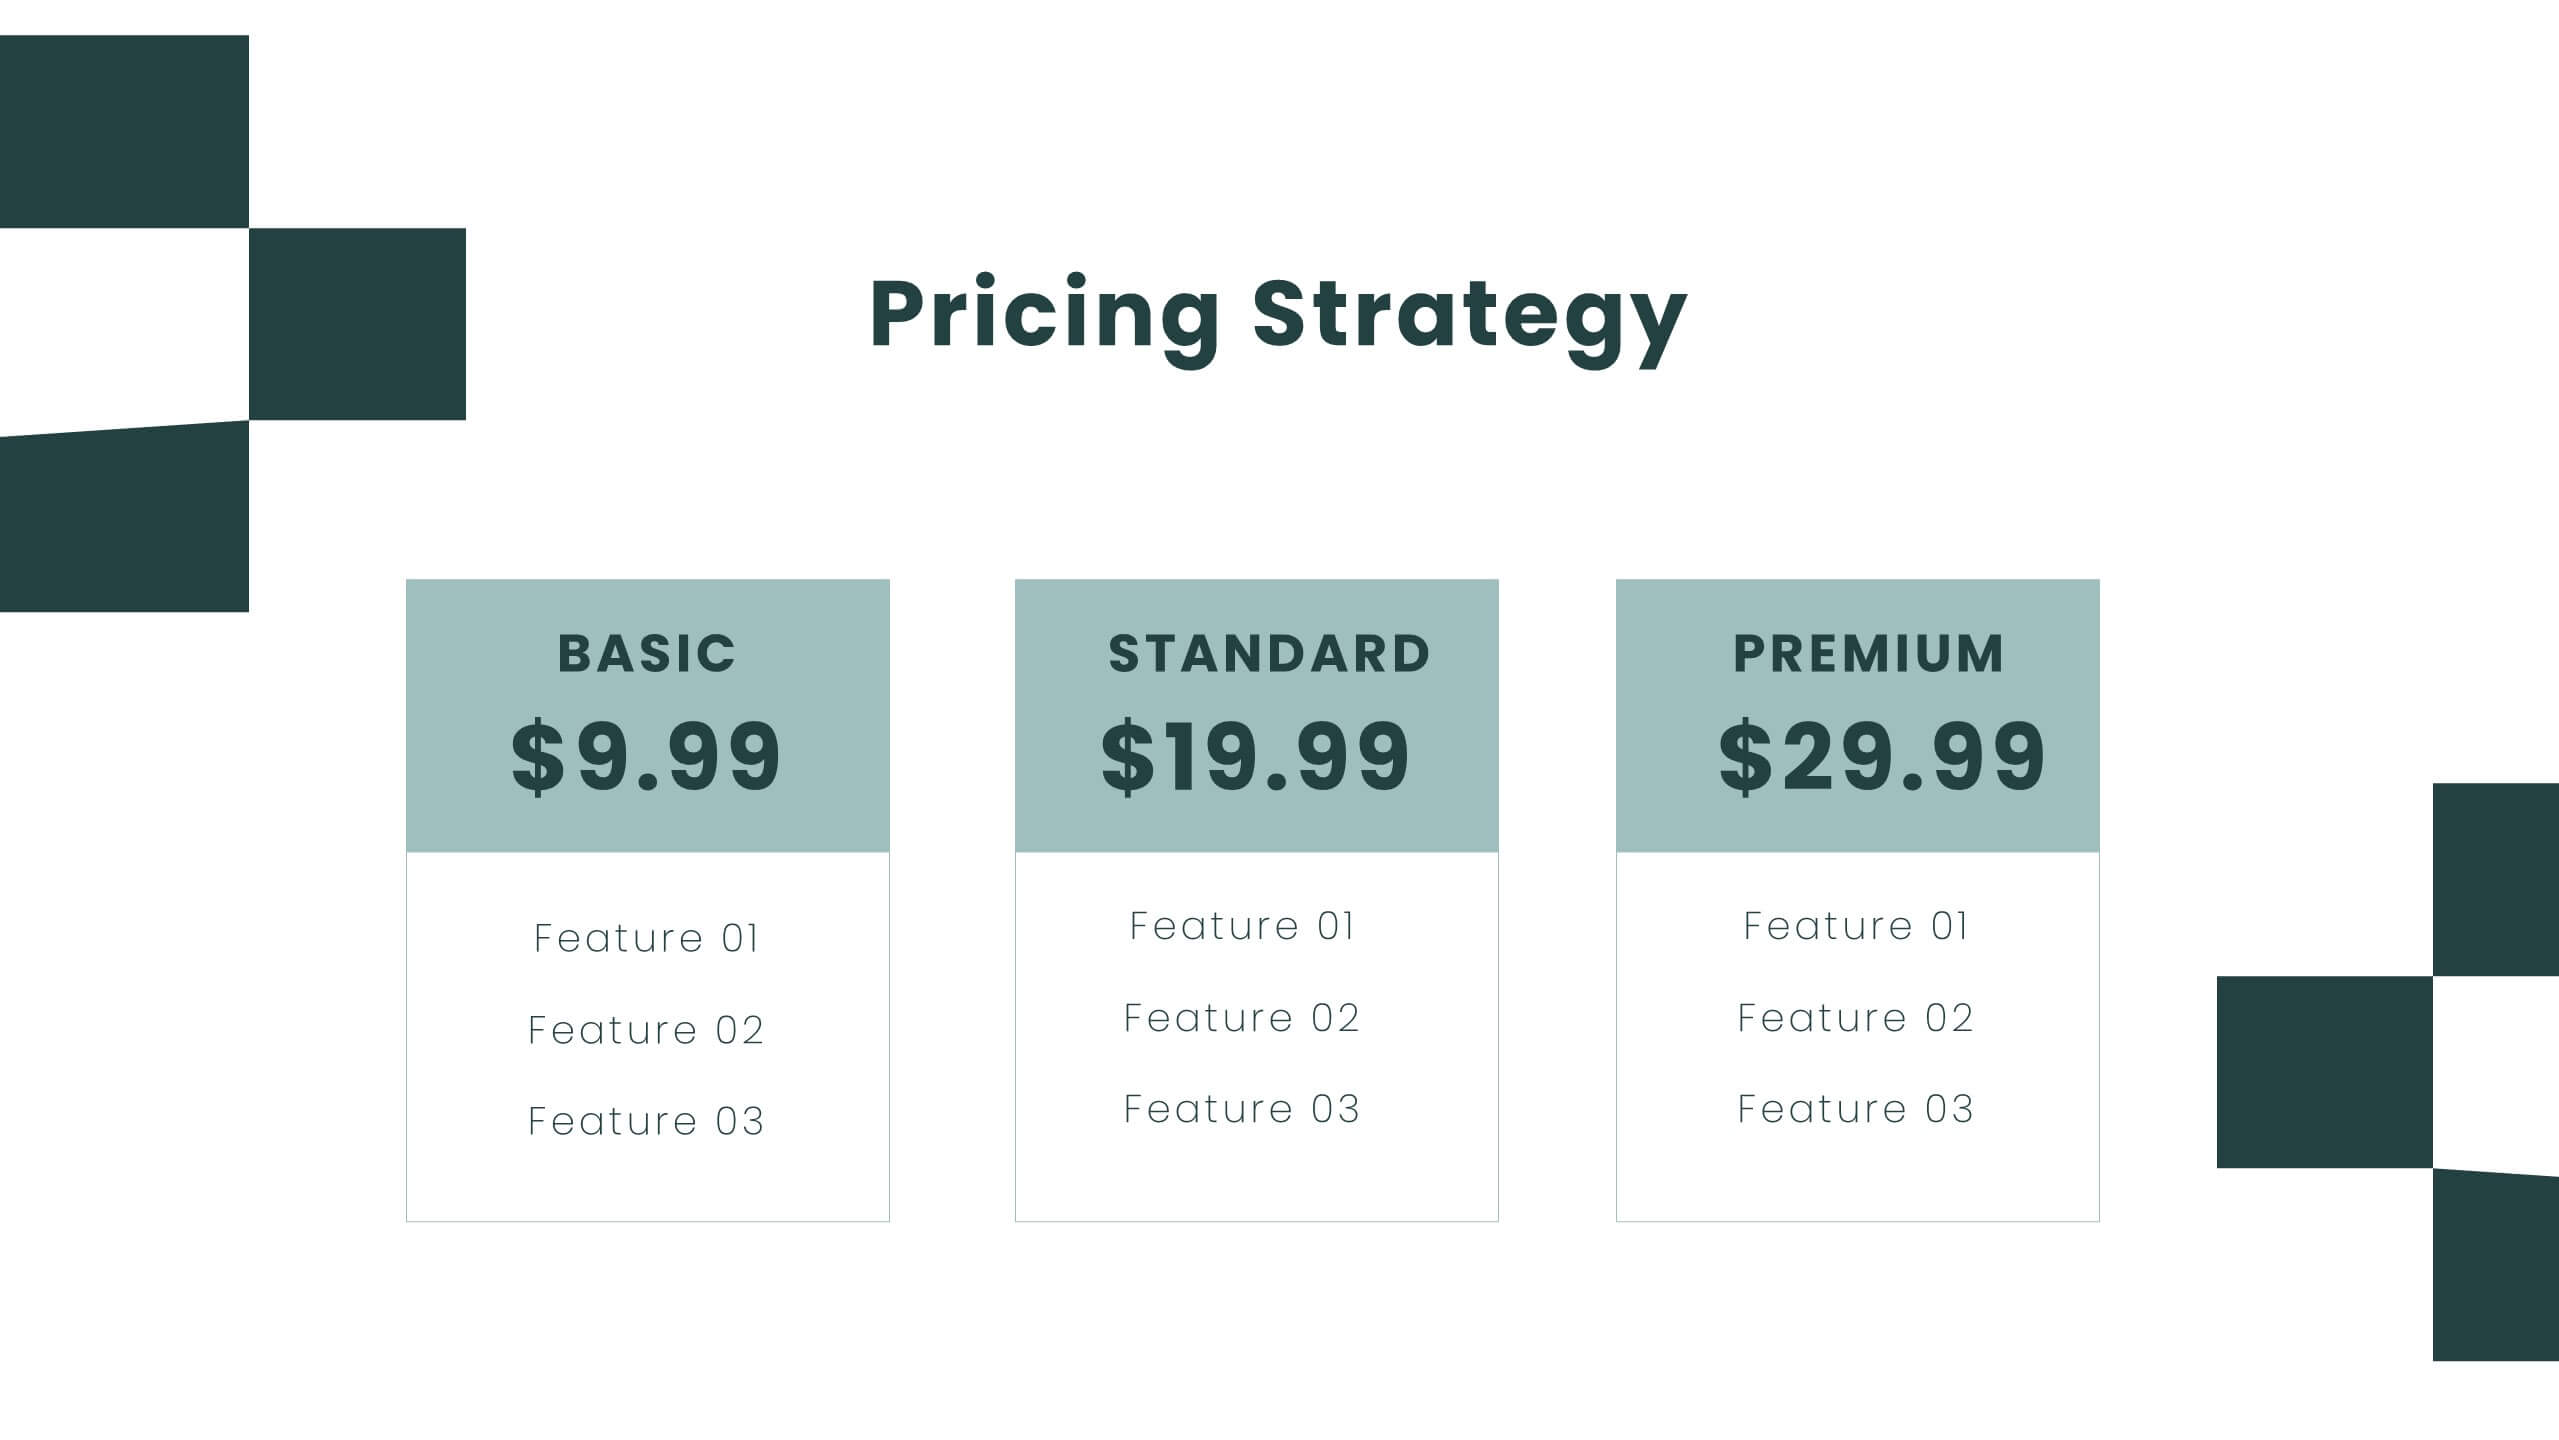
Radiant Sales Proposal Presentation
Elevate your pitch with this polished sales proposal template! Perfect for presenting company overviews, product/service details, and pricing strategies, it includes slides for competitive analysis and customer testimonials. Impress your audience with clear visuals and structured content. Compatible with PowerPoint, Keynote, and Google Slides for seamless presentations on any platform.