


Features
- 5 Unique slides
- Fully editable and easy to edit in Microsoft Powerpoint, Keynote and Google Slides
- 16:9 widescreen layout
- Clean and professional designs
- Export to JPG, PDF or send by email


Do you have any questions?
Recommend


5 slides
Strategic Budget Planning Forecasting Presentation
For strategic financial management, our Strategic Budget Planning Forecasting template provides a clear visual guide for balancing income and expenses. Ideal for financial planners, it simplifies quarter-by-quarter planning with dynamic charts, ensuring clarity and precision in forecasting financial outcomes. Fully compatible with PowerPoint, Keynote, and Google Slides, it's a versatile tool for any financial presentation or workshop.


6 slides
Sales Summary Infographic
Enhance your business presentations with our Infographic Templates! Designed specifically for professionals aiming to deliver impactful data insights, this collection provides an array of slides tailored to articulate complex information effortlessly. Crafted to showcase performance metrics, analyze market trends, and outline strategic directions, these templates turn data into narratives. Featuring unique designs ranging from sophisticated circular diagrams to innovative hexagonal lists and visually engaging photo integrations, each slide ensures your data is both comprehensive and compelling. You can customize colors and text to seamlessly align these designs with your corporate identity, enhancing brand consistency across all communications. Ideal for use in PowerPoint, Google Slides, and Keynote, these templates serve as essential tools for marketers, team leaders, and analysts. They facilitate clearer understanding, promote informed decision-making, and boost presentation impact, making them invaluable in any professional setting.


20 slides
Mythion Business Idea Pitch Deck Presentation
Communicate your business vision with clarity and impact using this comprehensive pitch deck presentation template. Perfect for entrepreneurs, startups, and innovators, this template is designed to help you effectively present your idea to investors, stakeholders, or partners. Cover every essential aspect of your business journey with slides dedicated to the problem statement, solutions, market overview, and target audience. Showcase your business model, revenue projections, and unique selling proposition with visually appealing layouts. Highlight your marketing strategy, growth projections, and funding requirements to build a strong, persuasive case. Fully customizable and compatible with PowerPoint, Google Slides, and Keynote, this template allows you to tailor each slide to suit your business identity and goals. Whether you're pitching a new idea or seeking investment, this template ensures you present with professionalism and confidence.


6 slides
Project Governance Plan Presentation
Bring clarity and energy to your workflow with this engaging presentation that visually breaks down key steps, responsibilities, and milestones in a structured process. Its clean layout helps audiences quickly understand project priorities and decision paths. Perfect for strategy meetings and stakeholder updates. Fully compatible with PowerPoint, Keynote, and Google Slides.


20 slides
Legacy Product Launch Presentation
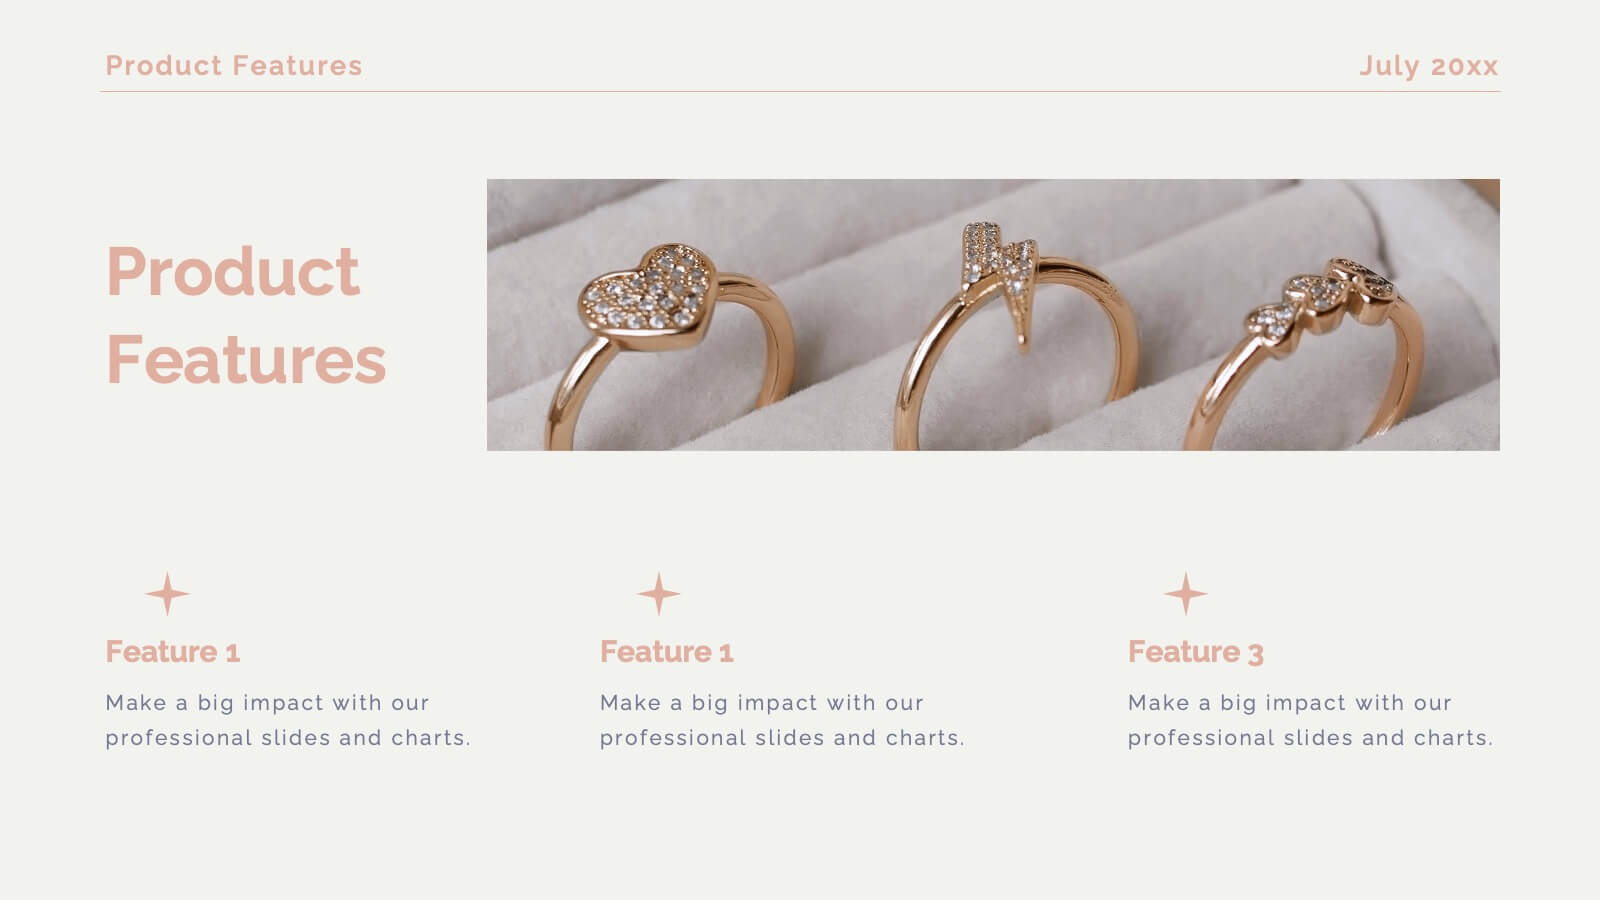
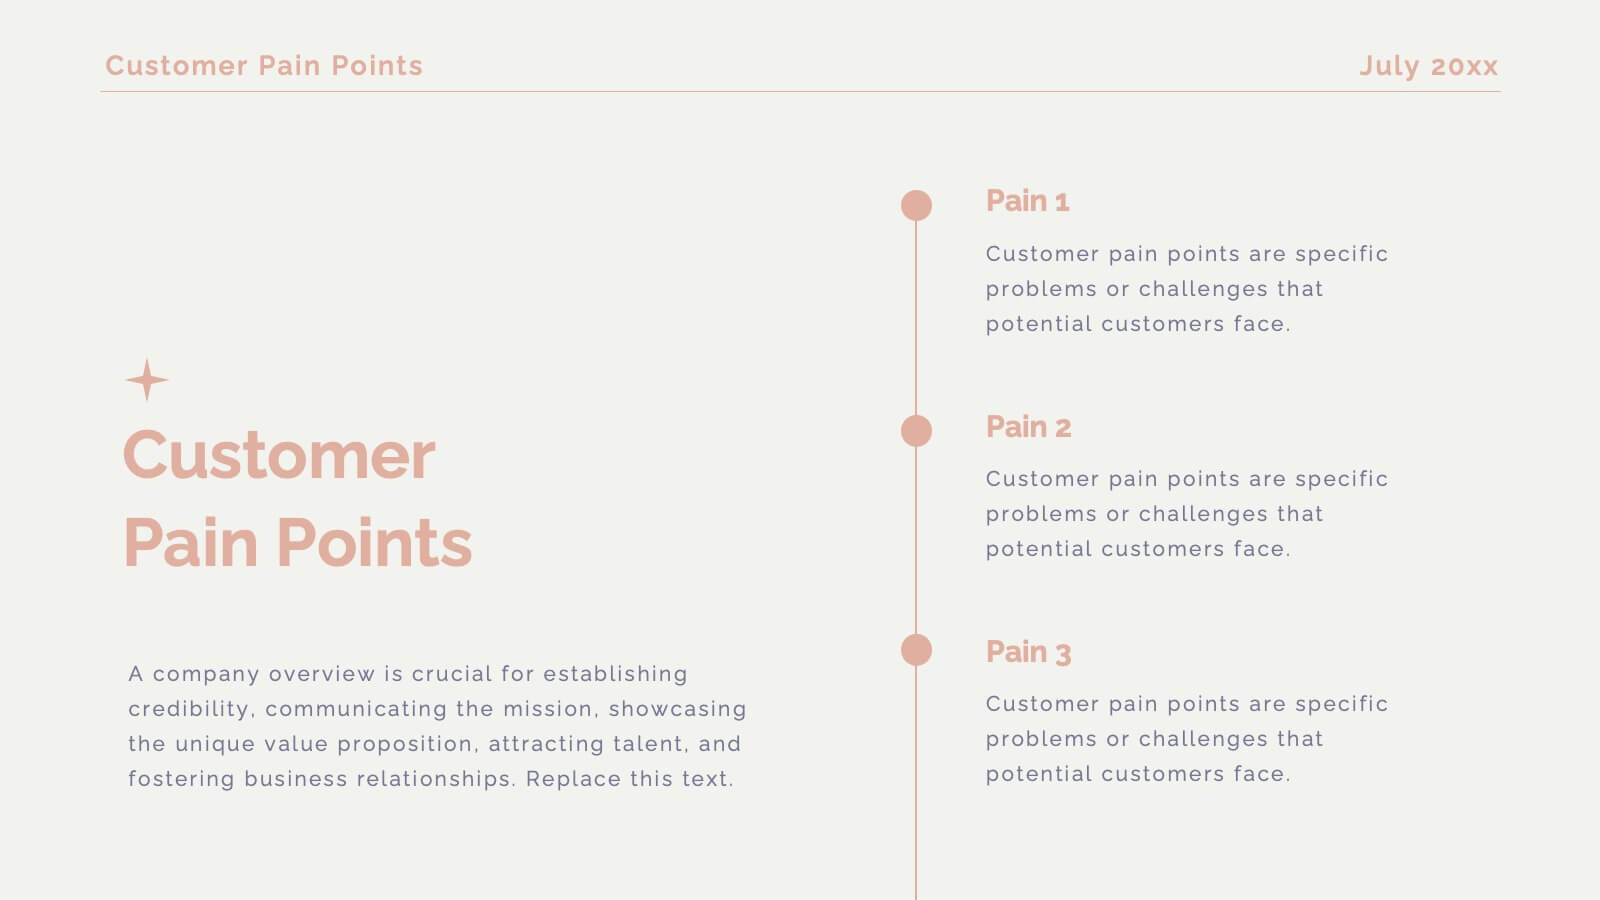
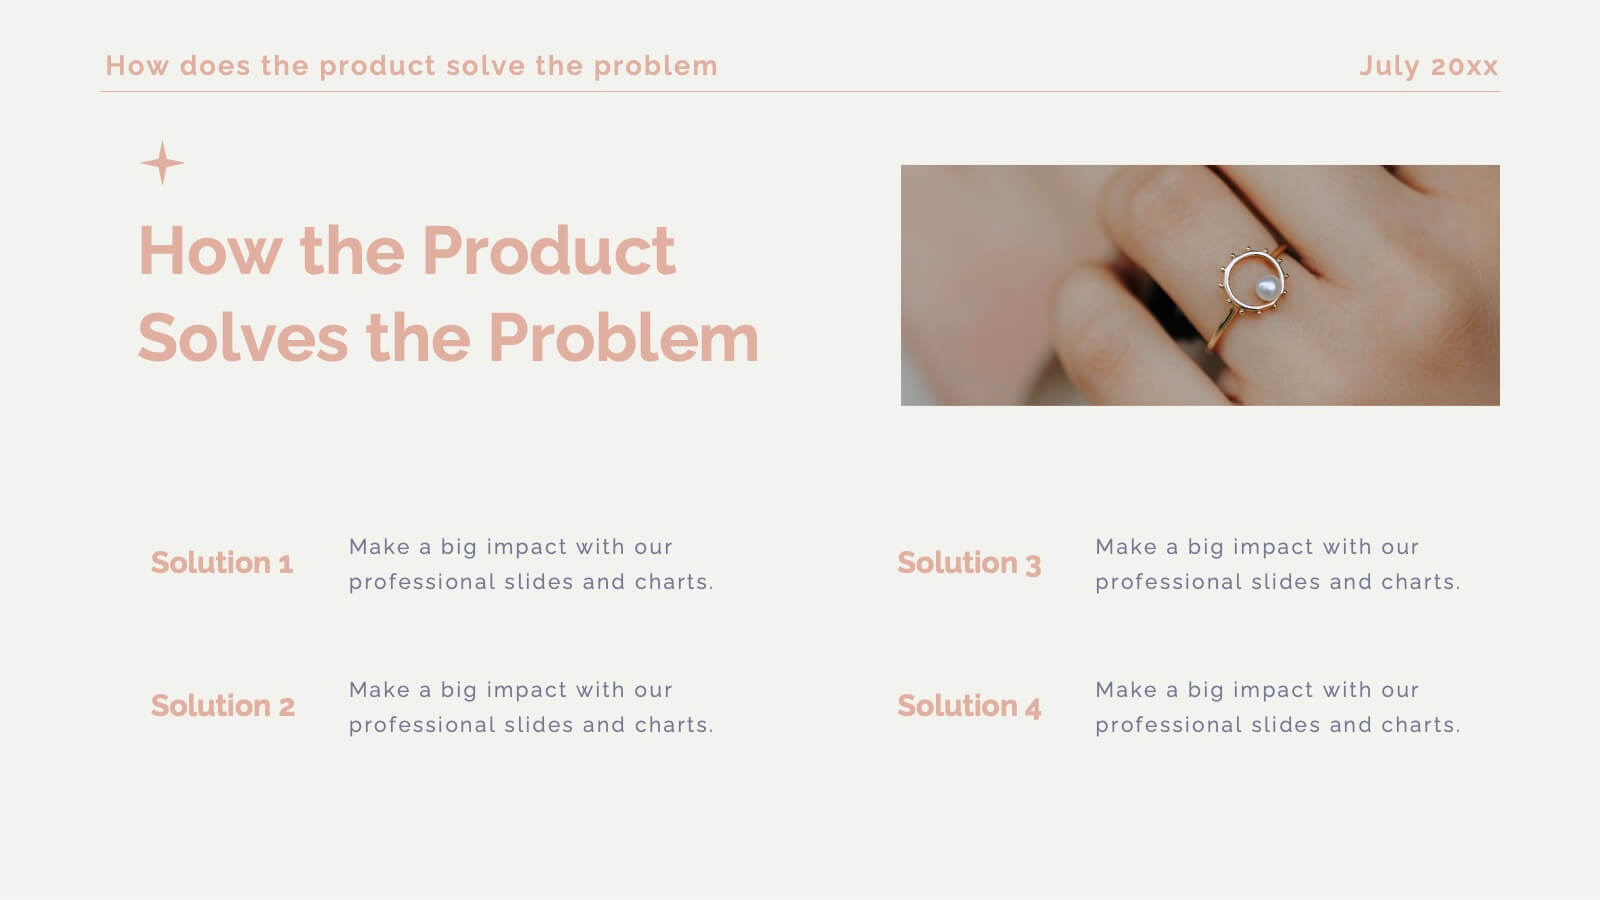
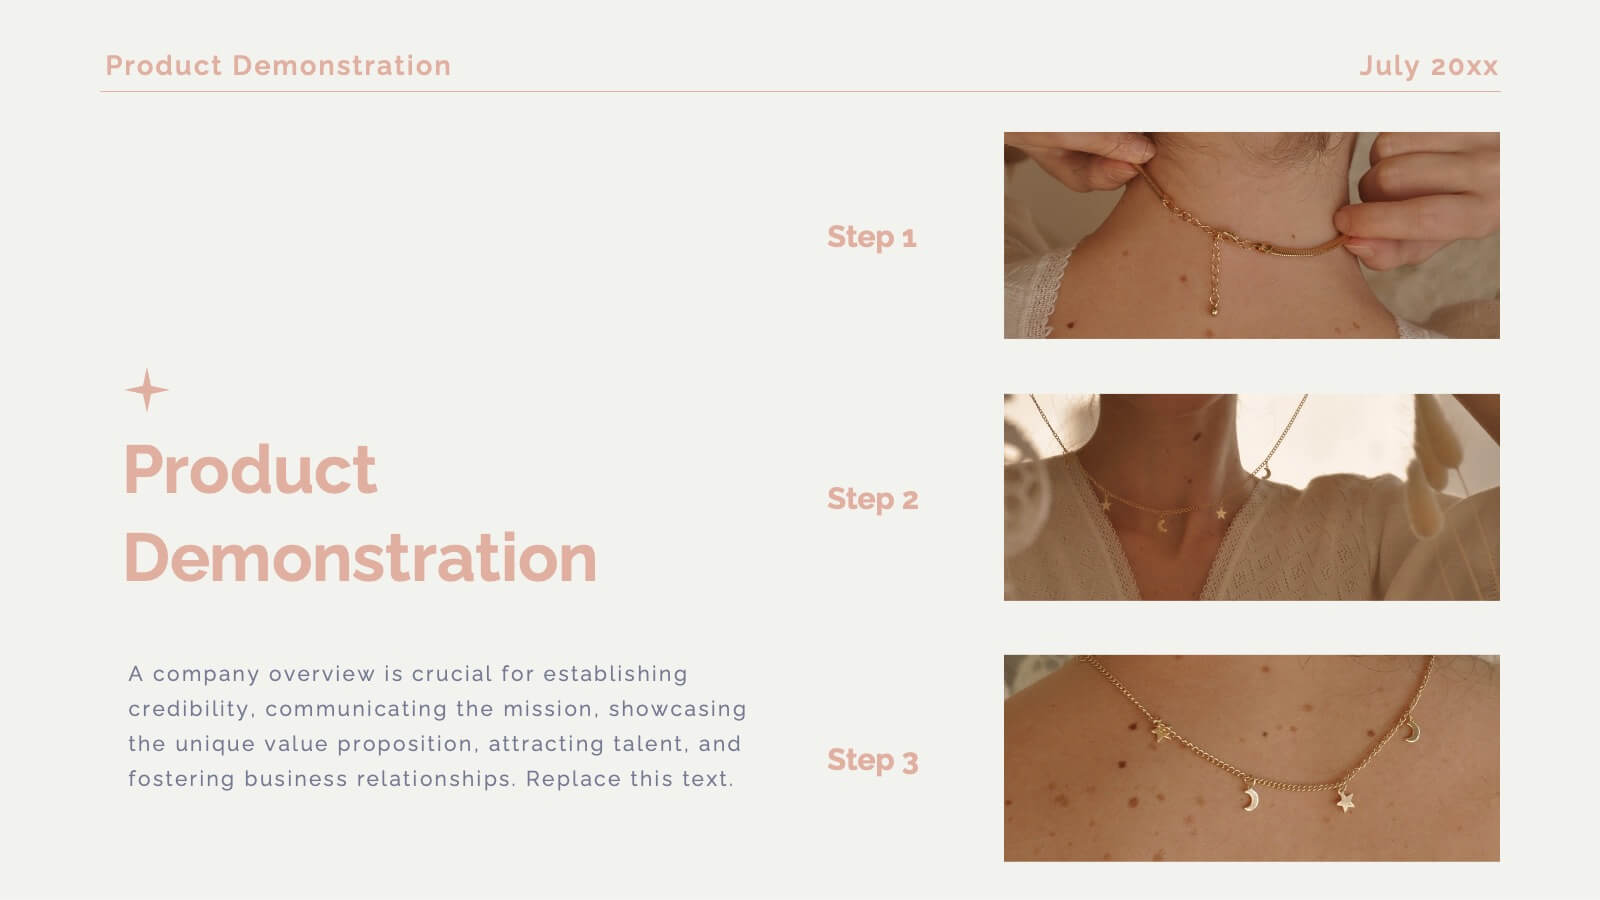
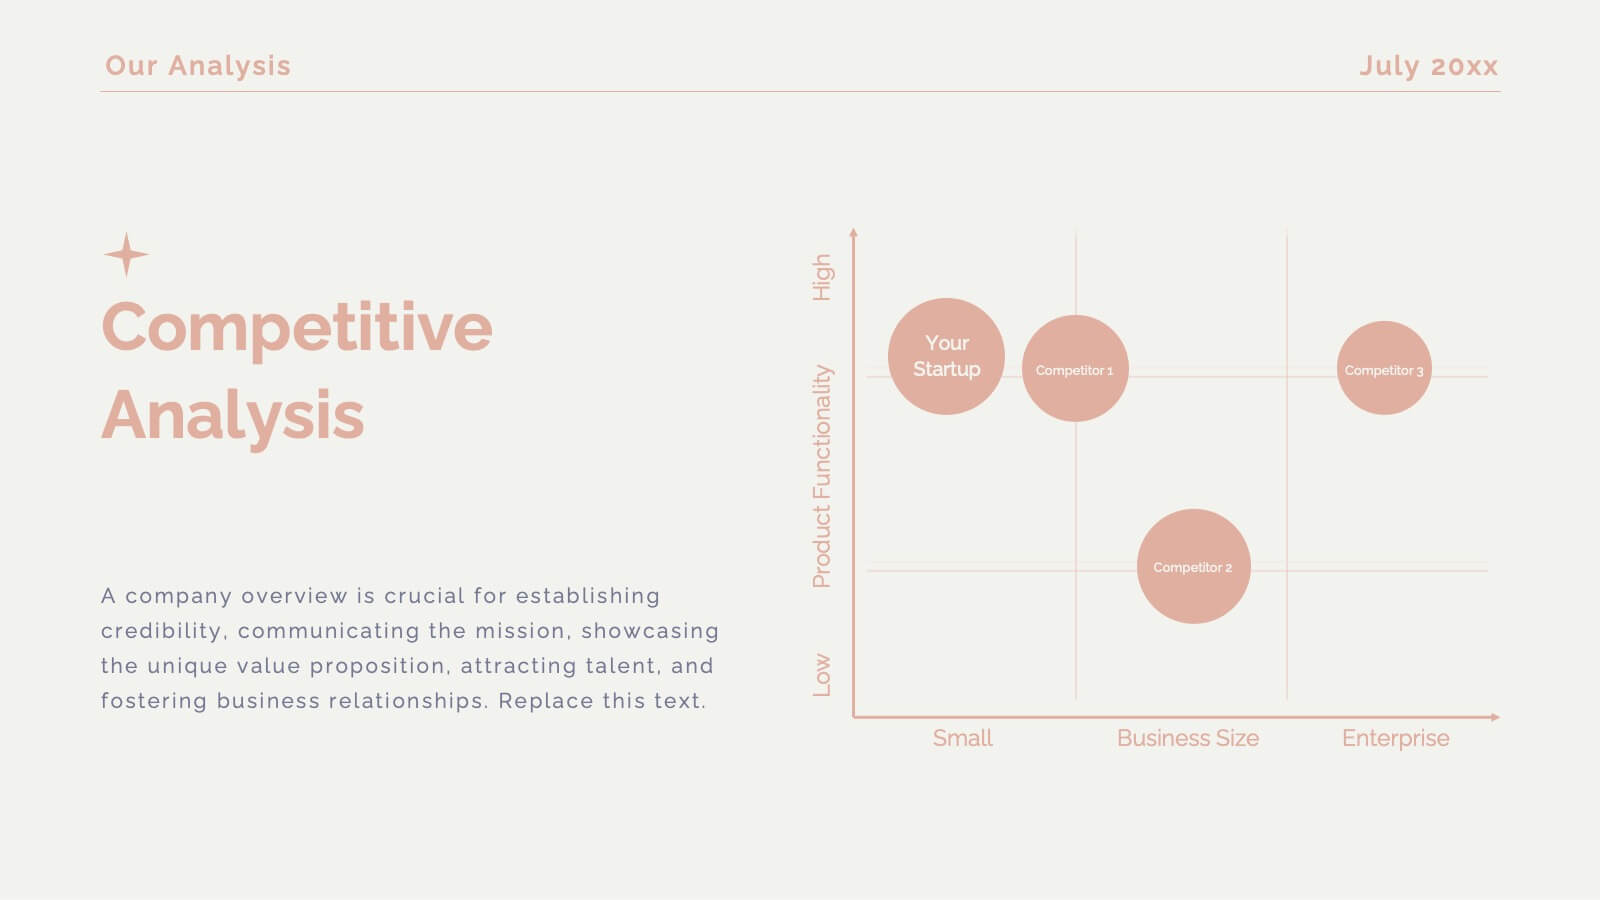
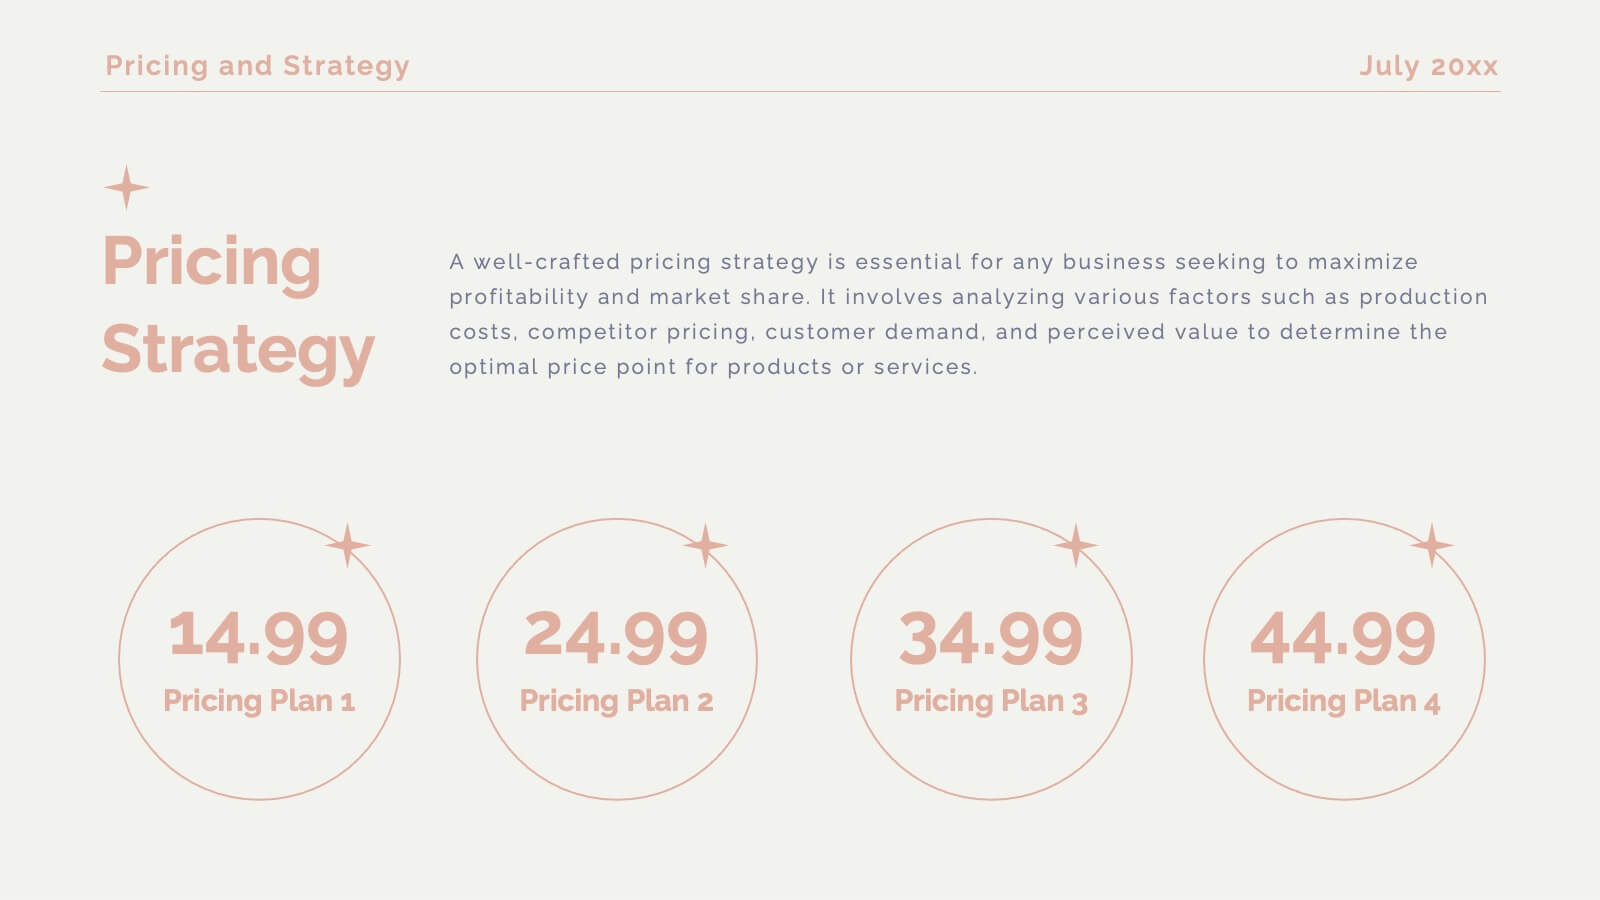
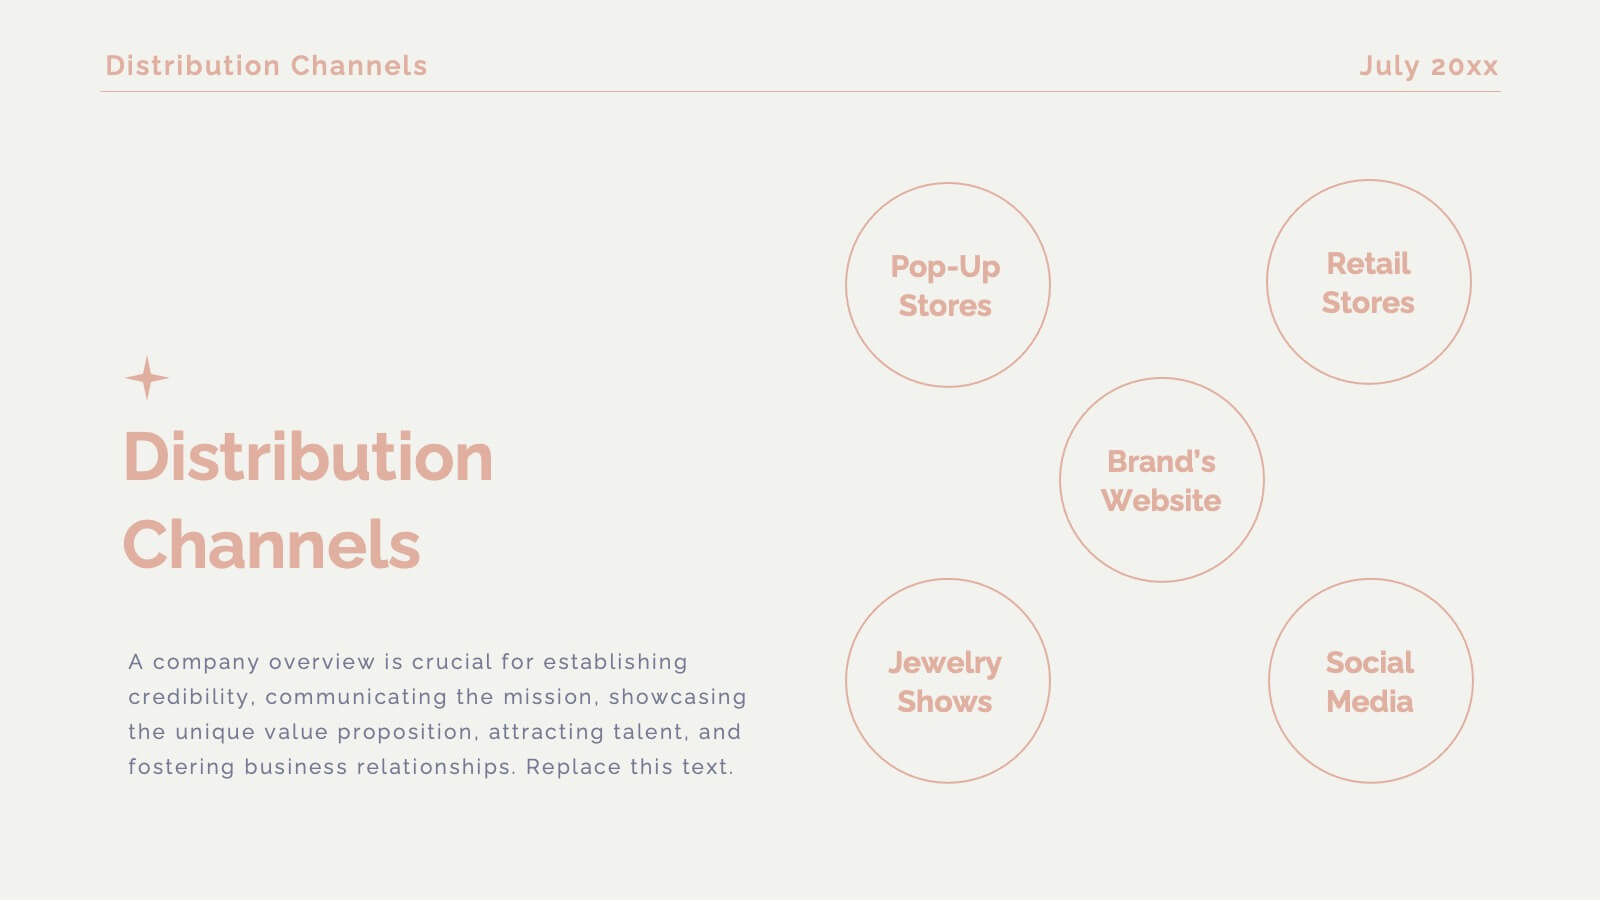
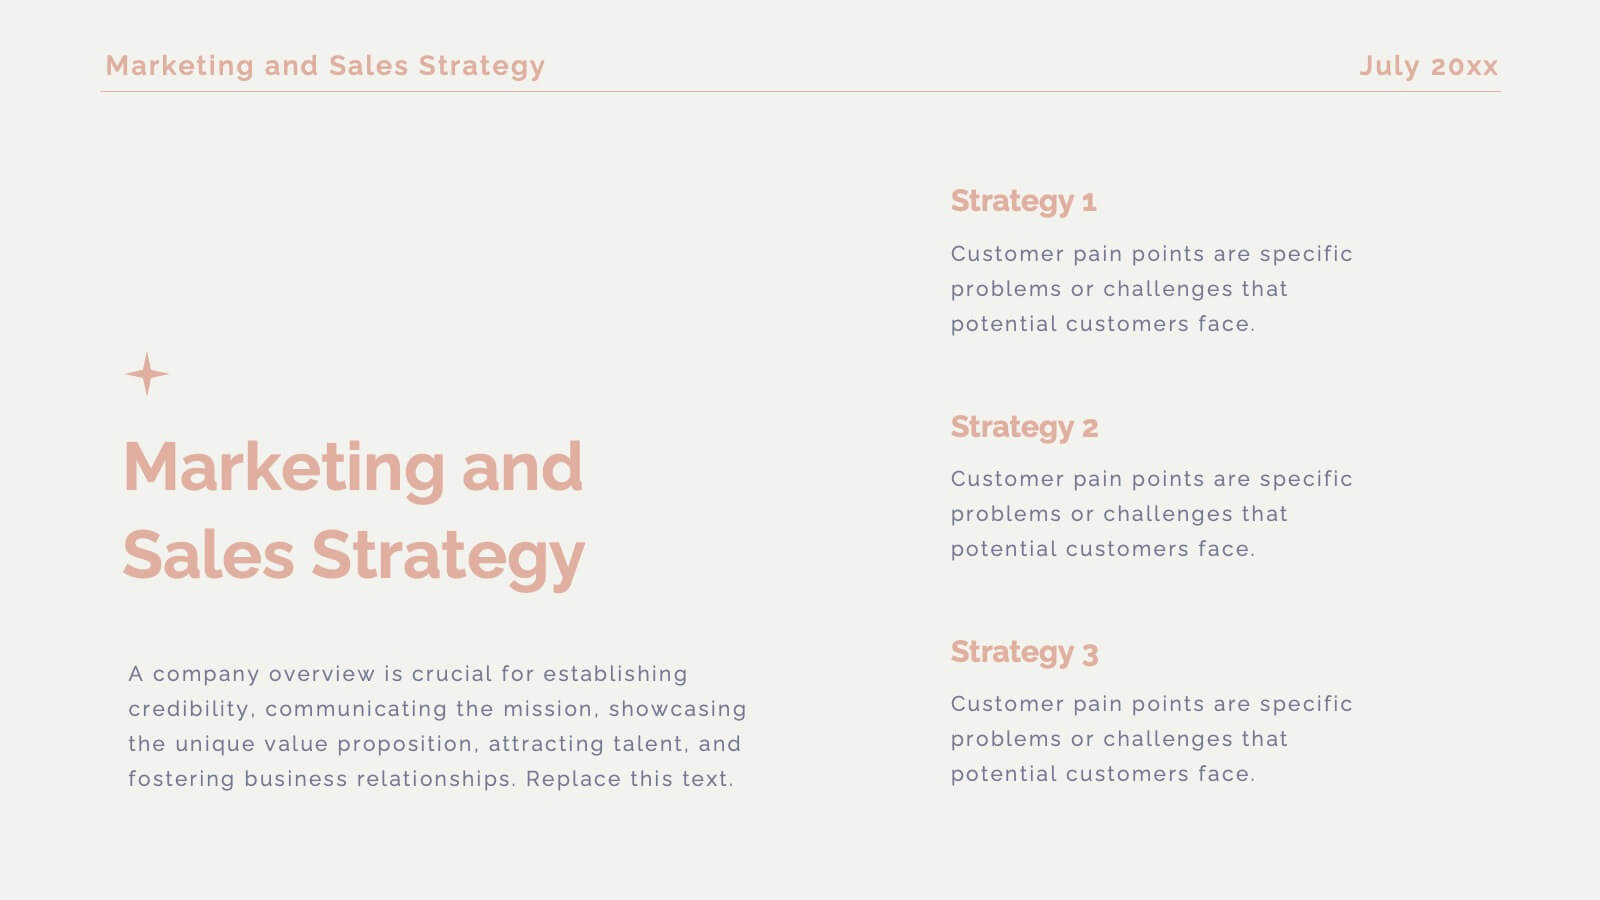
Get ready to unveil your product with a stunning and sophisticated launch template designed to captivate and convert! This template offers everything you need to present your product in the most compelling way possible, from an inviting welcome slide to an in-depth company overview that sets the stage for your brand’s story. The sleek design highlights key product features, unique selling propositions, and a thorough competitive analysis that positions your product as the market leader. With sections dedicated to customer pain points, solutions, and a powerful product demonstration, this template ensures your audience understands the value and impact of your offering. It also includes critical details like pricing strategy, distribution channels, and manufacturing processes, giving a full picture of your product’s journey from concept to market. Compatible with PowerPoint, Keynote, and Google Slides, this template is your ultimate tool for a successful product launch that leaves a lasting impression!


5 slides
Interlocking Puzzle Infographic Presentation
Visually connect ideas with the Interlocking Puzzle Infographic. This design is perfect for illustrating processes, relationships, and key concepts that fit together seamlessly. Whether you're presenting business strategies, project workflows, or educational content, this template enhances clarity and engagement. Fully customizable and compatible with PowerPoint, Keynote, and Google Slides.


7 slides
Project Proposal Infographic
Enhance your project presentations with our Project Proposal Templates, designed to outline your project comprehensively and engage stakeholders effectively. These templates provide a structured way to present every aspect of the project, from the scope and objectives to the resources and timelines, ensuring all key elements are covered. Each slide is crafted with a professional design, featuring a cohesive green color scheme that not only adds visual appeal but also aids in the organization of information. The templates include various sections such as project background, key objectives, project scope, implementation steps, and projected benefits, which are essential for outlining a clear and detailed project plan. Ideal for project managers, business analysts, and team leaders, these templates can be fully customized to match the specifics of your project, allowing for the addition of text, charts, and graphics as needed. Whether for internal reviews or external pitches, these slides will help you articulate your vision and strategy effectively, fostering clarity and facilitating decision-making.


5 slides
Corporate Staff Introduction and Bios Presentation
Introduce your team with clarity using the Corporate Staff Introduction and Bios Presentation. This layout is perfect for showcasing employee names, titles, photos, and brief bios in a professional format. Ideal for company overviews, internal communications, or onboarding decks. Fully editable in PowerPoint, Canva, and Google Slides.


6 slides
United States Coronavirus Map
A United States Coronavirus Map is a graphical representation that displays the spread of the coronavirus (COVID-19) across the United States. This infographic template may use different colors, shades, or symbols to indicate the severity of COVID-19 cases in different areas. Darker colors may represent higher case numbers, while lighter colors may represent lower case numbers. These maps are valuable tools to track the progression of the virus, identify hotspots, and make informed decisions related to public health. This can also help raise awareness about the importance of preventive measures and promote data-driven strategies to control the spread.


8 slides
Healthcare Data Analysis Presentation
The "Healthcare Data Analysis Presentation" template offers a streamlined visual representation ideal for communicating complex healthcare data insights effectively. Designed with clarity in mind, it features sleek graphics symbolizing medical elements and clear percentage tags that quantify data in an immediately understandable way. This template facilitates the presentation of key data such as patient outcomes, treatment efficacy, or operational efficiency within healthcare settings. Its visual simplicity makes it an excellent choice for healthcare professionals and administrators who need to convey detailed statistics and results to stakeholders, ensuring that the key points are easily digestible and actionable.


6 slides
Tiered Pricing Plan Layout Presentation
Clearly compare features across your service levels with this Tiered Pricing Plan Layout Presentation. Ideal for showcasing Basic, Regular, and Premium options in a side-by-side table with checkmarks and pricing. Great for SaaS, product subscriptions, or membership tiers. Fully editable in Canva, PowerPoint, Google Slides, and Keynote.


20 slides
Team Meeting Presentation
Streamline your team meetings with this professional presentation template, designed in striking purple tones. It covers all essential aspects from agenda setting to feedback collection, ensuring efficient and effective communication. Compatible with PowerPoint, Google Slides, and Keynote, this template is perfect for keeping your team aligned and focused.


4 slides
Home Design and Architecture Presentation
Showcase Home Design and Architecture with this layered house-themed presentation template. This stacked structure layout effectively illustrates key concepts such as floor planning, architectural elements, space optimization, and construction insights. Ideal for architects, interior designers, and real estate developers, this template helps communicate design strategies and structural layouts with clarity. Fully customizable and compatible with PowerPoint, Keynote, and Google Slides.


4 slides
Regional Business Focus on Asia Presentation
Showcase your company’s strategic footprint with the Regional Business Focus on Asia Presentation. This clean, icon-labeled map layout helps illustrate key markets, logistics routes, or development hubs across Asia. Ideal for business expansion plans, investment updates, or regional performance overviews. Fully editable in PowerPoint, Keynote, Google Slides, and Canva.


10 slides
Hospital Services Overview Presentation
Bring your healthcare message to life with a clean, modern layout that makes complex hospital services easy to understand. This presentation helps you outline key departments, care processes, and essential service details with clarity and confidence. Designed for smooth communication in medical settings, it works seamlessly in PowerPoint, Keynote, and Google Slides.


6 slides
Target Audience Demographics Presentation
The "Target Audience Demographics" presentation employs an innovative spiral chart design to display key demographic data in an engaging and easy-to-understand format. Each segment of the spiral represents a different demographic characteristic with percentages clearly marked, enabling quick insights into audience composition. This design is well-suited for marketing presentations or any scenario where understanding audience segments is crucial. The placeholders are conveniently set up to add specific details or insights, making the template not only visually appealing but also highly functional for strategic planning and audience analysis.


8 slides
SWOT-Based Competitive Analysis
Clearly map your organization’s strengths, weaknesses, opportunities, and threats with this dynamic infographic layout. Ideal for strategic planning sessions, this template uses a continuous loop to show interconnection between internal and external factors. Fully editable in PowerPoint, Keynote, and Google Slides.