


Features
- 4 Unique slides
- Fully editable and easy to edit in Microsoft Powerpoint, Keynote and Google Slides
- 16:9 widescreen layout
- Clean and professional designs
- Export to JPG, PDF or send by email


Do you have any questions?
Recommend


7 slides
Cyber Security Consultant Infographic
Dive into the realm of cyber safety with our cyber security consultant infographic. With a color palette that reflects the technological and serious nature of the domain – blue for trust and black for professionalism – this infographic is a representation of the role and responsibilities of a cyber security consultant. The design employs sleek icons that symbolize various cyber security elements. Ideal for IT professionals, and institutions providing training on cyber security. Compatible with PowerPoint, Keynote, and Google Slides, it promises versatility and ease of use. This ensures that the complex world of cyber security is made accessible.


8 slides
Card Services Comparison Layout Presentation
Highlight key differences in financial products with this Card Services Comparison Layout Presentation. Featuring a sleek smartphone-centered design, this template allows you to clearly compare up to three card types or financial service features. Perfect for fintech presentations, banking pitches, or product feature breakdowns. Fully customizable in PowerPoint, Keynote, and Google Slides.


12 slides
Customer Demographics Map Presentation
Showcase customer demographics effectively with our "Customer Demographics Map Presentation" template. This infographic is crafted to display the geographical distribution of customer data across the United States, using a color-coded map for clarity. Each state is marked to represent varying metrics like age, income, or product preference, facilitating easy visual comparisons and insights into market trends. Ideal for marketers, business analysts, and data scientists, this template simplifies complex demographic data for strategic presentations. It enhances understanding of customer bases and market segmentation. Compatible with PowerPoint, Keynote, and Google Slides, it's essential for detailed demographic analysis in any professional presentation.


4 slides
Buyer Persona and Market Segmentation Presentation
Visualize ideal customer types with this engaging buyer persona template. Showcase personality traits, goals, brand affinities, and bios in a stylish format with tropical-inspired accents. Ideal for market segmentation, branding, and campaign alignment. Fully editable in PowerPoint, Keynote, and Google Slides to match your marketing strategy and presentation tone.


4 slides
Cost Comparison Analysis Chart Presentation
Turn your price evaluations into something visually compelling with this sleek and modern layout. Perfect for showcasing product features, service packages, or market comparisons, it simplifies decision-making with a clear side-by-side design. Fully editable and compatible with PowerPoint, Keynote, and Google Slides for effortless customization.


2 slides
App Interface Device Preview Presentation
Display your mobile app design with this sleek interface preview layout. Centered around a realistic smartphone mockup, this template includes four surrounding sections for text or key features. Ideal for pitch decks or product demos, it's fully editable in PowerPoint, Keynote, or Google Slides to match your brand.


6 slides
North America Sales Distribution Presentation
Showcase regional performance clearly with the North America Sales Distribution Presentation. This slide combines a clean bar chart and a regional map to help visualize sales data across key areas. Ideal for performance reviews, strategy meetings, or investor updates. Fully editable in Canva, PowerPoint, and Google Slides.


14 slides
IT Service Operations Strategy
Simplify complex IT operations into an intuitive visual strategy. This slide features a dynamic radial flow diagram and labeled segments to illustrate service components, support tiers, or incident flows. Perfect for IT managers, consultants, and teams aligning service delivery with business goals. Fully editable in PowerPoint, Keynote, or Google Slides


26 slides
Remote Work Strategies Presentation
Enhance your team's flexibility with our Remote Work Strategies presentation template, designed for use with PowerPoint, Keynote, and Google Slides. This template is an invaluable asset for team leaders, HR professionals, and business consultants dedicated to cultivating a productive remote work culture. Our template is tailored to provide an in-depth analysis of remote work best practices, offering slides that cover essential strategies for communication, collaboration, and project management in a virtual environment. It also includes insights on setting up a successful home office, maintaining work-life balance, and leveraging technology for seamless remote operations. With customizable elements, you can illustrate the advantages of remote work, share success stories, and provide actionable tips to maximize team efficiency from afar. This template is SEO-optimized to ensure your presentation reaches those seeking to optimize their remote work operations and foster a thriving digital workplace.


7 slides
Academic Year Schedule and Class Structure Presentation
Organize your school week with clarity using the Academic Year Schedule and Class Structure Presentation. Perfect for teachers, school coordinators, and academic planners, this timetable slide helps map out subjects and activities across days and periods. Fully customizable in PowerPoint, Keynote, Google Slides, and Canva for seamless editing.


5 slides
SMART Objectives Slide Presentation
Kick your planning into gear with a bold, structured layout that makes goal-setting feel energetic and achievable. This presentation helps you outline clear objectives, track progress, and communicate strategy with a clean, organized flow designed for teams and leaders. Fully compatible with PowerPoint, Keynote, and Google Slides.


5 slides
Science Branches Infographics
Science is a vast and diverse field that encompasses several branches or disciplines, each focusing on different aspects of the natural world, physical phenomena, and the study of living organisms. These infographic templates are perfect for presenting the diverse fields of science and their significant contributions to our understanding of the world. Use these infographics to deliver a presentation on science education, scientific research, or the interdisciplinary nature of science. This template will help you visually communicate the information, engage your audience, and create an impactful presentation experience.


22 slides
Eclipse Graphic Design Project Plan Presentation
Develop a winning marketing strategy with this dynamic template. Dive into current trends, consumer behavior, and innovative techniques. Perfect for social media, influencer marketing, and data-driven campaigns. Fully compatible with PowerPoint, Keynote, and Google Slides.


20 slides
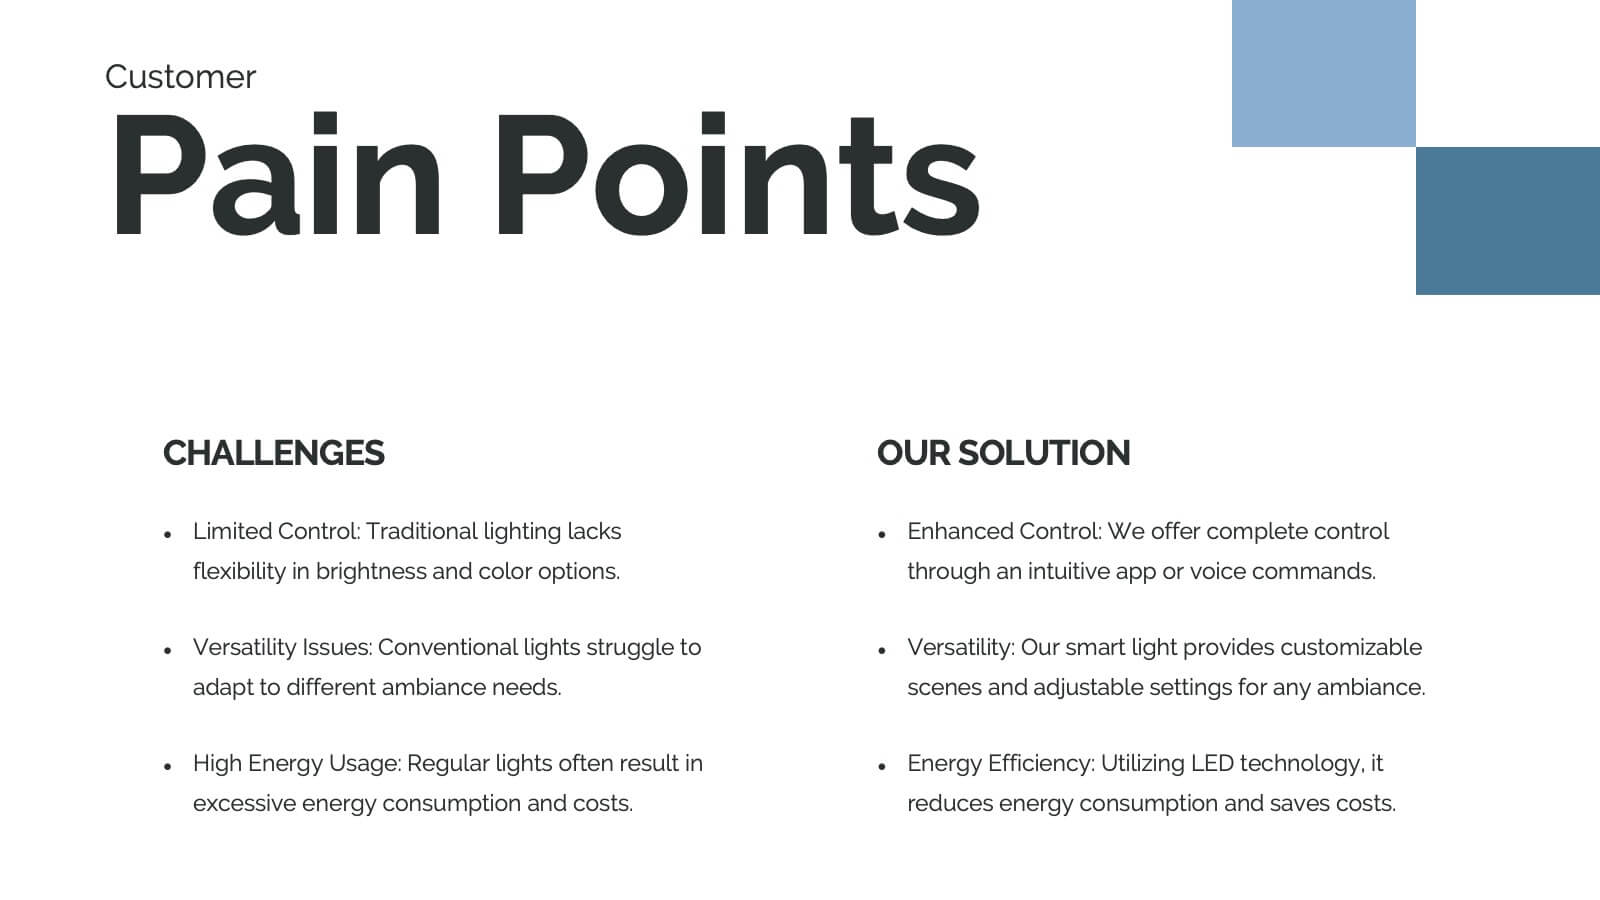
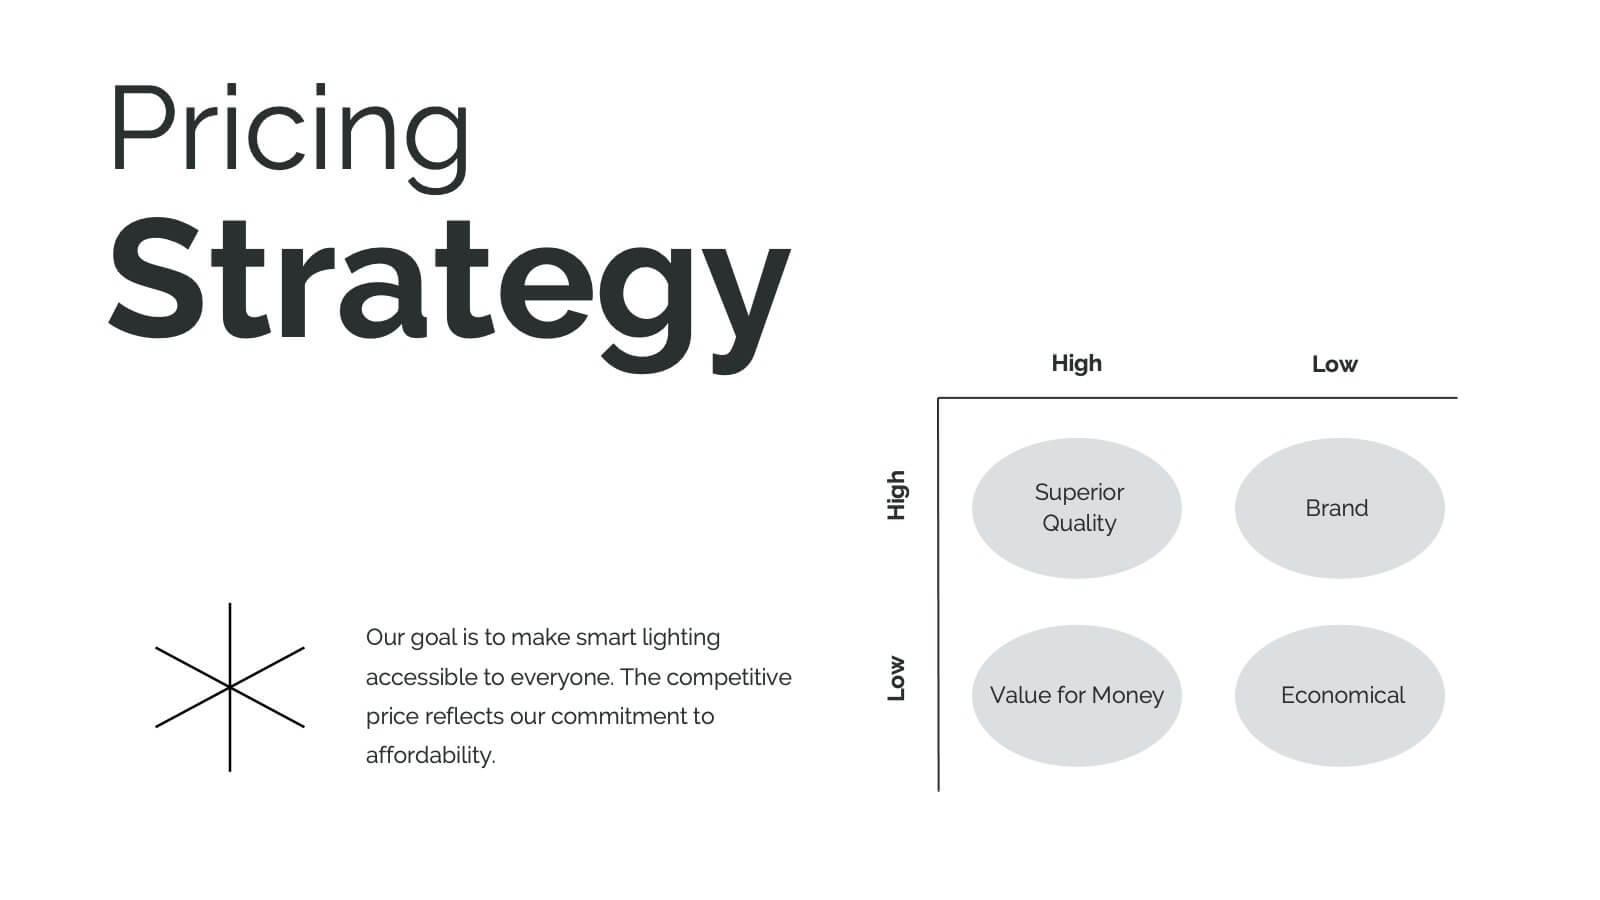
Hydra Product Launch Presentation
Unveiling your latest product has never been easier or more captivating! This comprehensive presentation template covers every aspect of your product's journey—from launch to competitive analysis. Engage your audience with detailed slides on features, target analysis, and pricing strategy. Seamlessly compatible with PowerPoint, Keynote, and Google Slides for maximum flexibility and impact.


7 slides
Media Table Infographic Presentation
A Table Infographic is a type of visual infographic that presents complex information in a clear and easy-to-understand way, using rows and columns to display data. Add a new and modern look to your next project with this infographic table template. This template uses a cool blue color scheme on a white background, making this an engaging presentation that will make sure your data tells a story. This infographic features a table layout with title slides and seven unique table layout options that you can easily customize. This template is compatible with Powerpoint, keynote and Google Slides.


4 slides
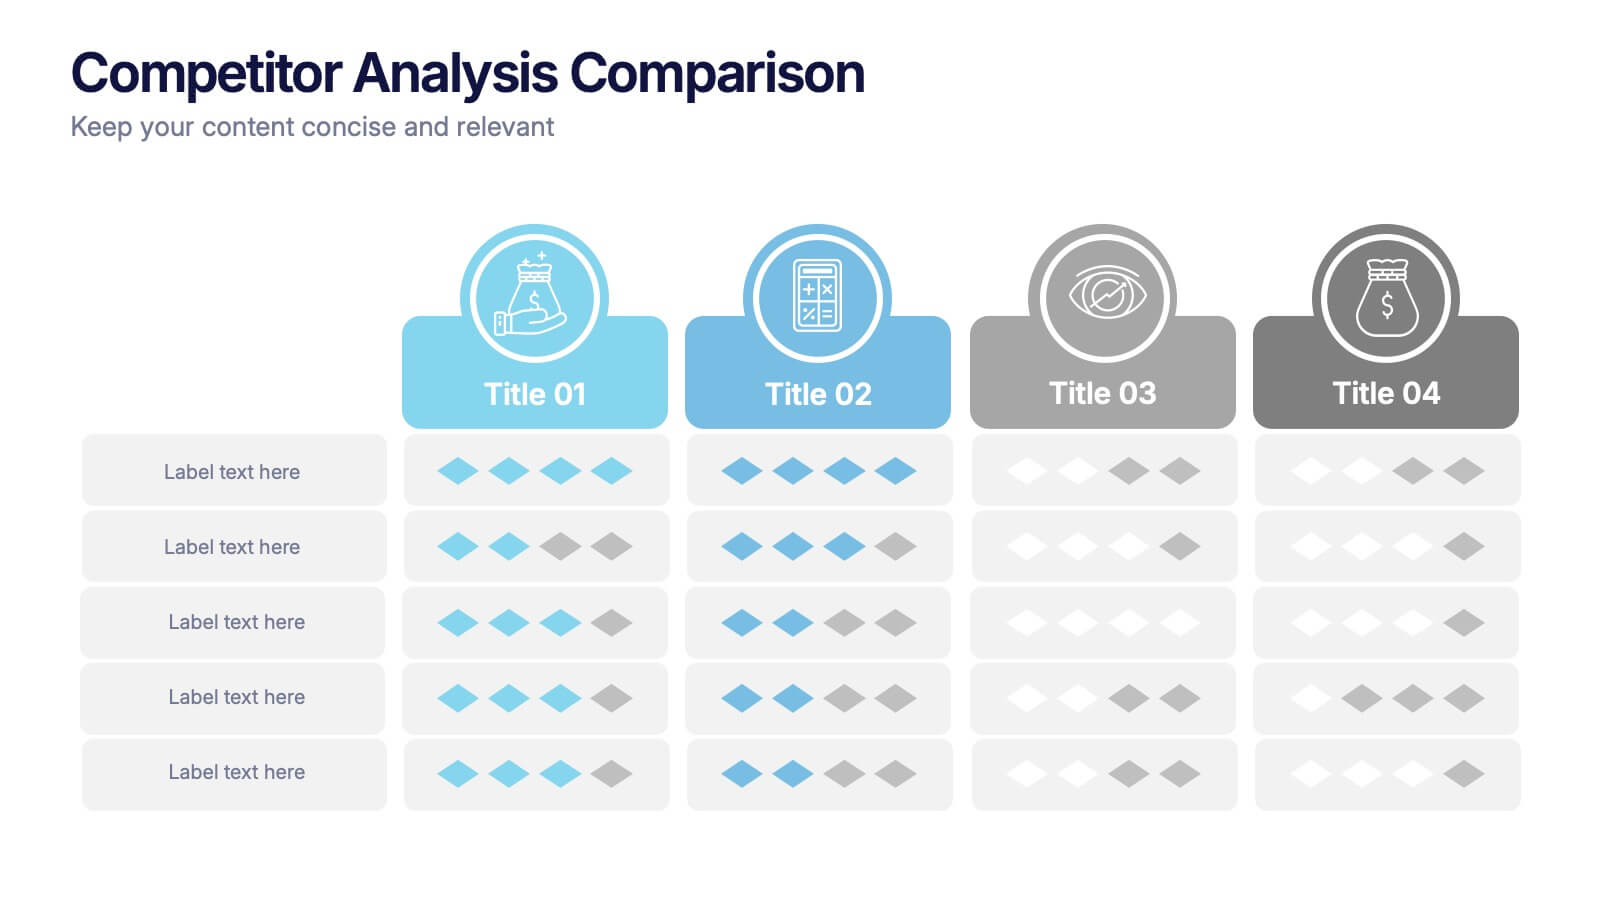
Competitor Analysis Comparison Presentation
Quickly evaluate strengths and weaknesses across your market landscape with this Competitor Analysis Comparison Presentation. Featuring clean tables, icons, and rating visuals, it's ideal for highlighting where your brand stands out. Fully editable in PowerPoint, Keynote, and Google Slides.


4 slides
Employee and Team Performance Analysis
Visualize individual and team contributions with this clear and structured performance analysis template. Showcase key metrics, employee growth, and team achievements using easy-to-read layouts and progress indicators. Ideal for HR reports, performance reviews, and team evaluations. Fully editable in PowerPoint, Keynote, and Google Slides.