


Features
- 4 Unique slides
- Fully editable and easy to edit in Microsoft Powerpoint, Keynote and Google Slides
- 16:9 widescreen layout
- Clean and professional designs
- Export to JPG, PDF or send by email


Do you have any questions?
Recommend


6 slides
Green Energy and Ecology Presentation
Ignite your audience’s curiosity with a clean, modern layout that brings eco-friendly ideas to life. This presentation helps you explain renewable energy concepts, sustainability benefits, and environmental impact in a clear, structured way that feels fresh and inspiring. Fully compatible with PowerPoint, Keynote, and Google Slides.


20 slides
Aether Marketing Research Report Presentation
The Marketing Research Report Presentation Template offers a sleek design with 20 fully customizable slides, ideal for presenting in-depth marketing insights. This template features sections for industry analysis, consumer behavior, emerging technologies, and marketing trends like SEO, social media, and influencer strategies. It also highlights e-commerce trends, personalization, sustainability, and storytelling techniques. The modern black-and-gold gradient aesthetic adds sophistication, making it perfect for professional reports. Compatible with PowerPoint, Keynote, and Google Slides, this template ensures a polished and engaging presentation experience.


22 slides
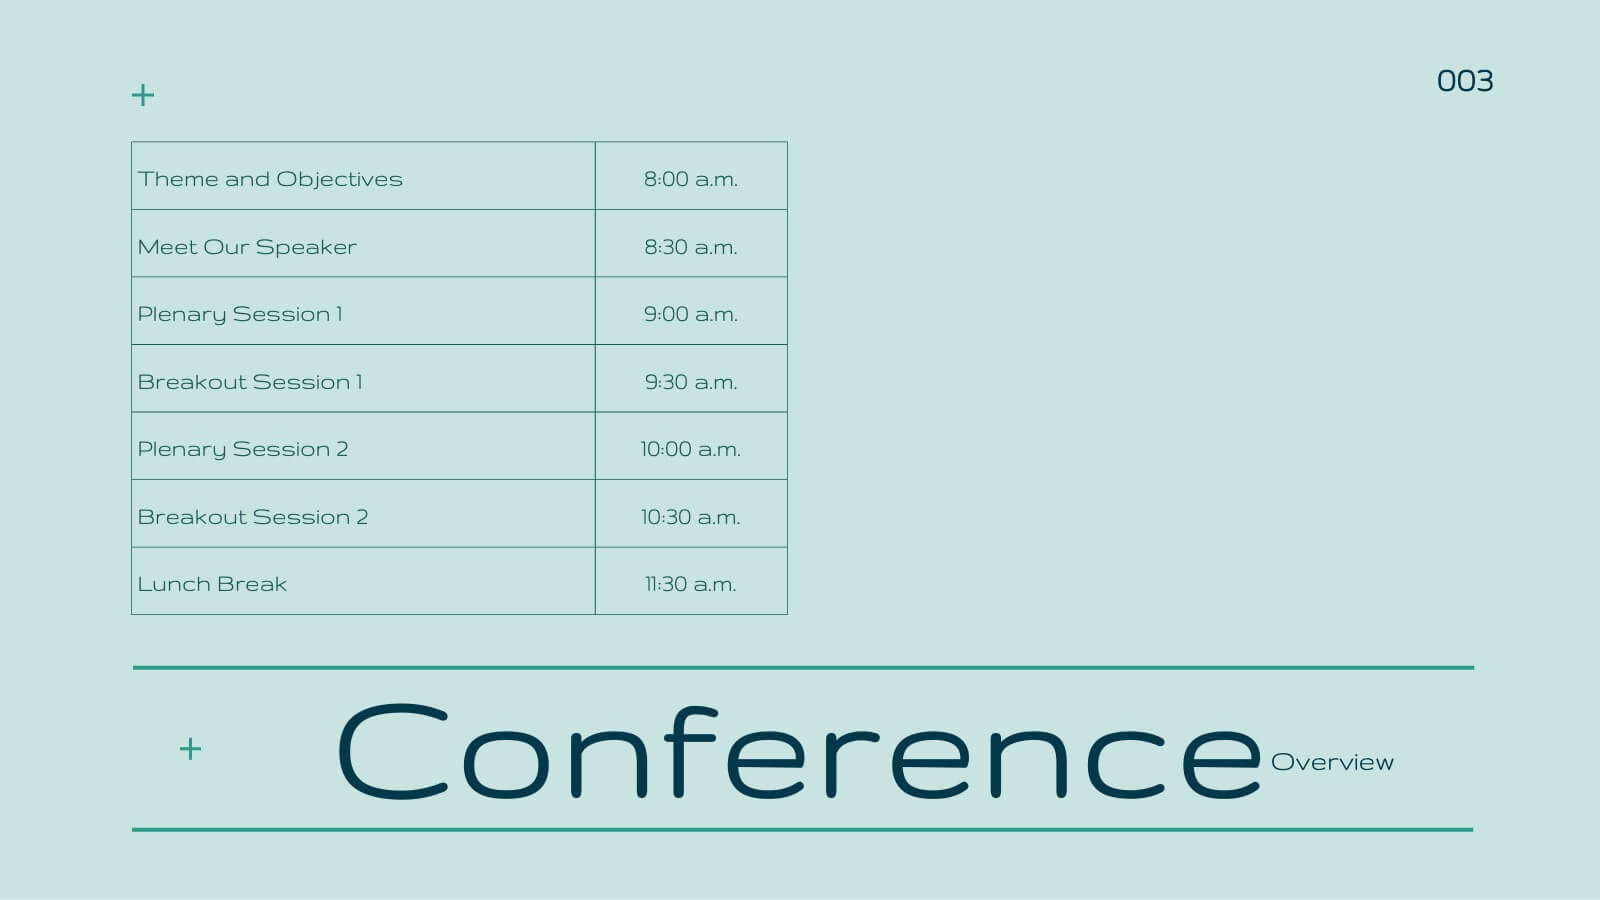
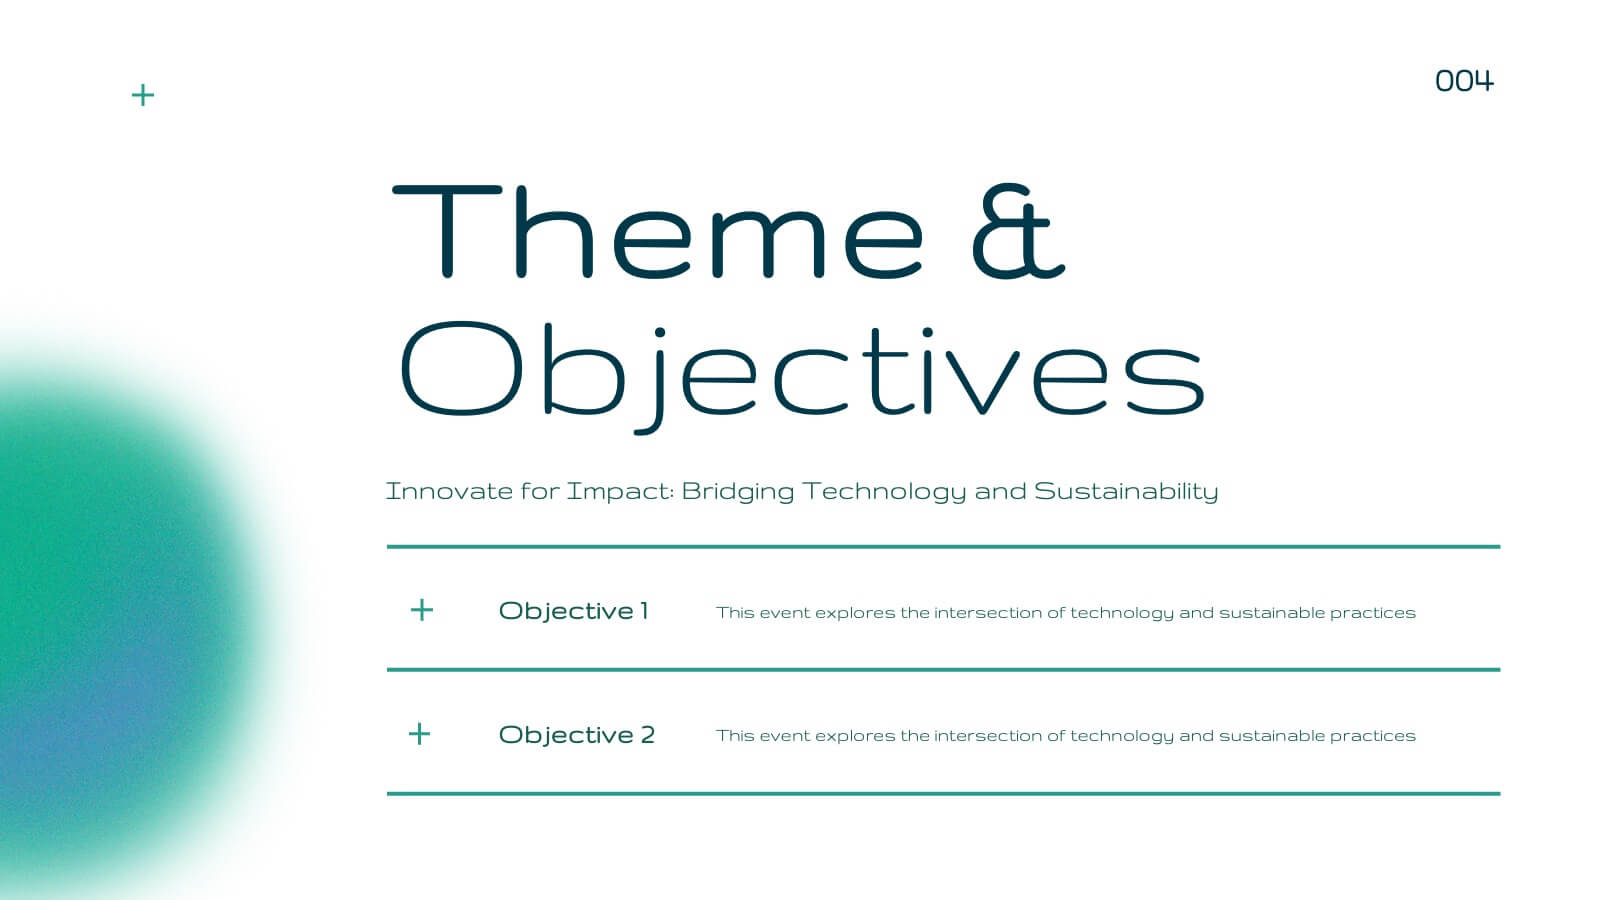
Blaze Business Operations Plan Presentation
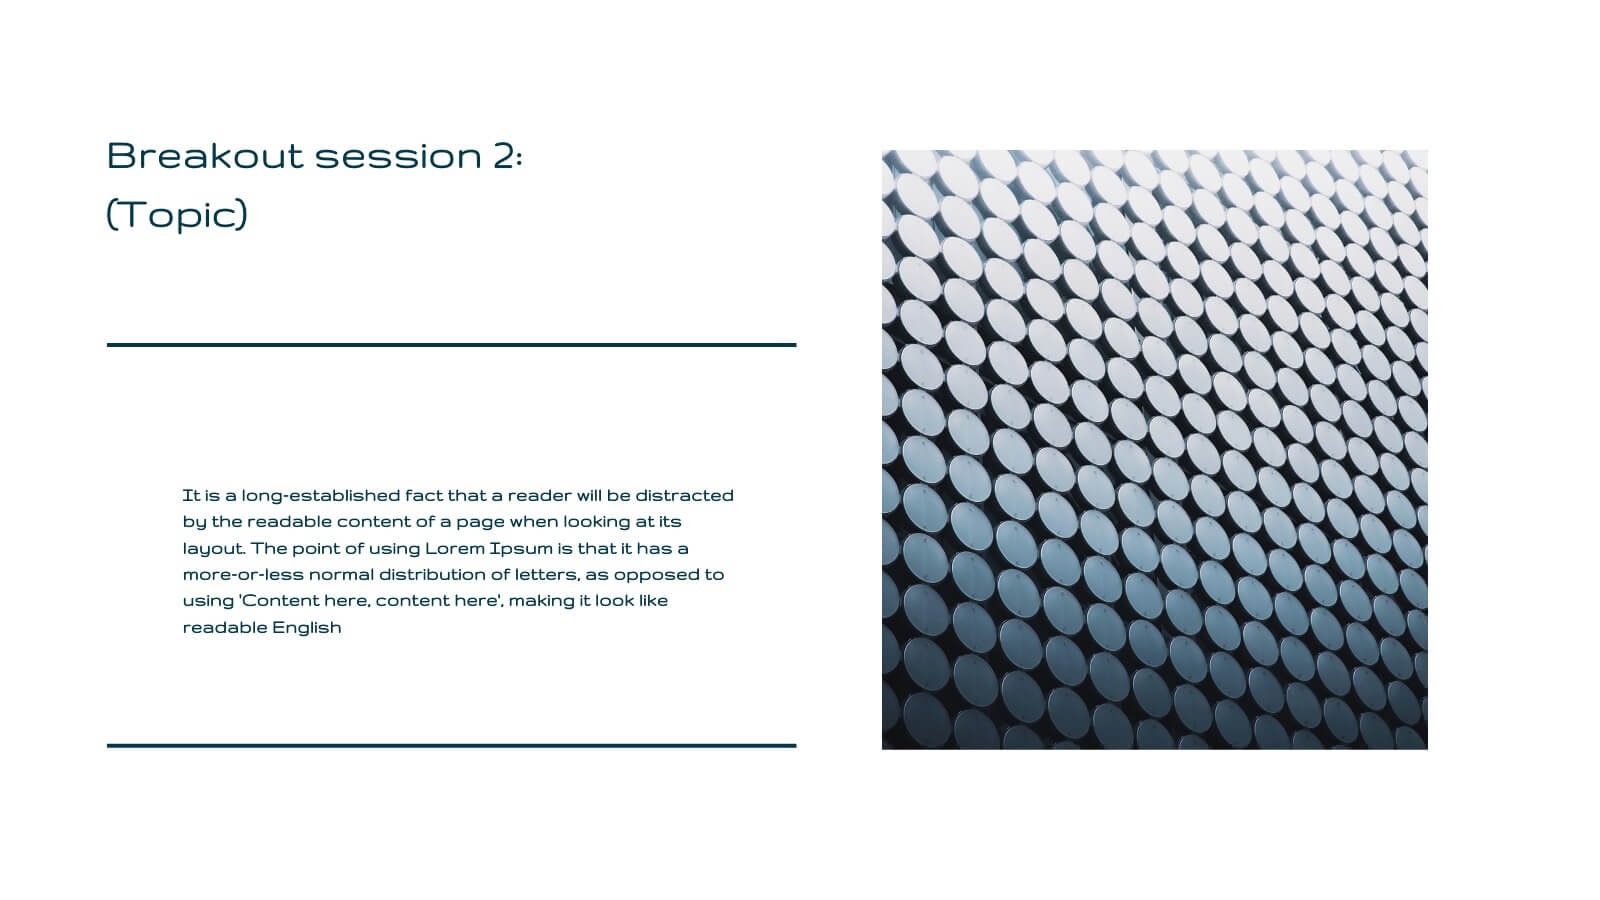
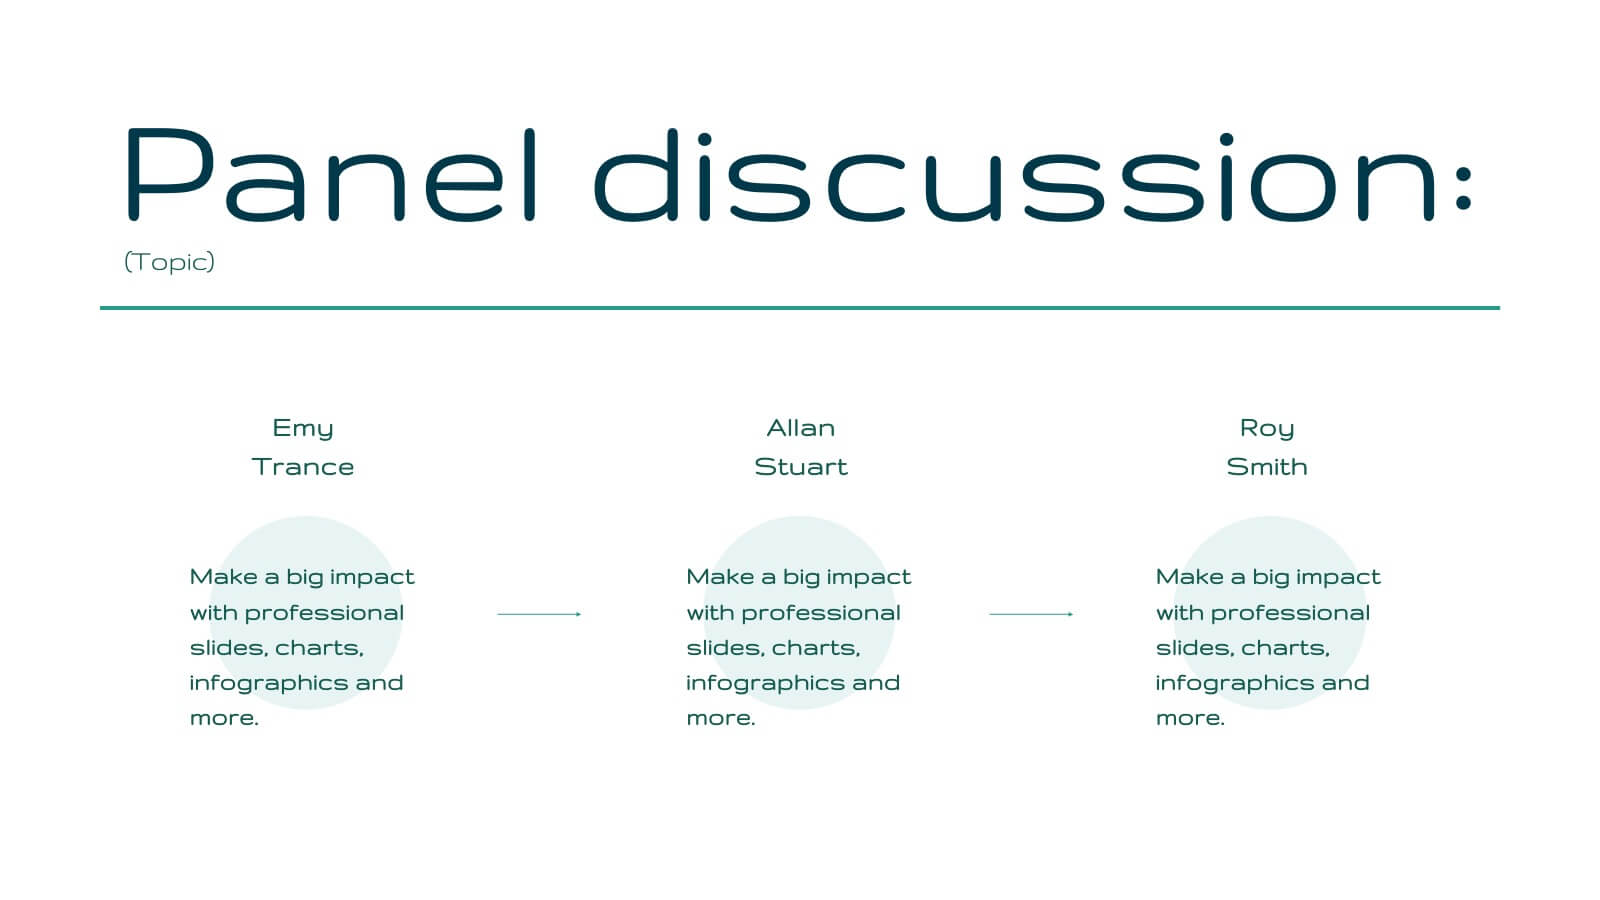
Elevate your business presentations with this elegant, modern template designed for comprehensive business operations. Perfect for covering themes, objectives, workshops, and panel discussions, it ensures a professional and engaging delivery. The clean design and structured layout enhance clarity and impact. Compatible with PowerPoint, Keynote, and Google Slides, it’s versatile for any platform.


4 slides
AIDA Marketing Funnel Slide Presentation
Capture attention from the very first slide with a bold, structured layout that turns each stage of your message into a clear, engaging flow. This presentation helps simplify complex decision paths and guide viewers through each step with ease. Fully editable and compatible with PowerPoint, Keynote, and Google Slides.


6 slides
Bubble Map Ideas Infographics
Visualize your ideas creatively with our Bubble Map Ideas infographic template. This template is fully compatible with popular presentation software like PowerPoint, Keynote, and Google Slides, allowing you to easily customize it to brainstorm and organize your concepts using a bubble map format. The Bubble Map Ideas infographic template offers a visually engaging platform to brainstorm and categorize ideas, concepts, and relationships in a structured and visually appealing manner. Whether you're a creative thinker, project manager, or educator, this template provides a user-friendly canvas to create informative presentations and visualizations of your ideas. Elevate your idea generation and organization with this SEO-optimized Bubble Map Ideas infographic template, thoughtfully designed for clarity and ease of use. Customize it to map out your ideas, prioritize them, and identify key connections, ensuring that your creative process becomes more organized and productive. Start crafting your personalized infographic today to bring your ideas to life.


7 slides
Project Introduction Infographic
Effortlessly introduce your projects with our collection of project introduction slide templates, tailored for clear and effective communication. These templates are ideal for providing an overview of project goals, scopes, and deliverables, ensuring all key points are conveyed to stakeholders efficiently. Each template features a modern design, incorporating sleek graphics and bold text to highlight critical information, making them perfect for kickoff meetings, client presentations, or internal reviews. The layouts are carefully structured to guide the audience through the introduction process, including the presentation of team members, project timelines, and expected outcomes. Fully customizable to fit your specific project needs, these templates allow you to modify colors, fonts, and imagery to align with your brand identity and project requirements. Utilize these professionally designed slides to make a compelling case for your project, engaging your audience right from the start.


7 slides
Cyber Security Consultant Infographic
Dive into the realm of cyber safety with our cyber security consultant infographic. With a color palette that reflects the technological and serious nature of the domain – blue for trust and black for professionalism – this infographic is a representation of the role and responsibilities of a cyber security consultant. The design employs sleek icons that symbolize various cyber security elements. Ideal for IT professionals, and institutions providing training on cyber security. Compatible with PowerPoint, Keynote, and Google Slides, it promises versatility and ease of use. This ensures that the complex world of cyber security is made accessible.


10 slides
Business Scaling Strategy Presentation
Achieve rapid growth with the Business Scaling Strategy Diagram. This professional template helps you visualize key steps, strategic phases, and milestones for scaling a business effectively. Designed for entrepreneurs, executives, and consultants, this slide ensures a clear and structured presentation of your expansion strategy. Fully customizable and compatible with PowerPoint, Keynote, and Google Slides.


8 slides
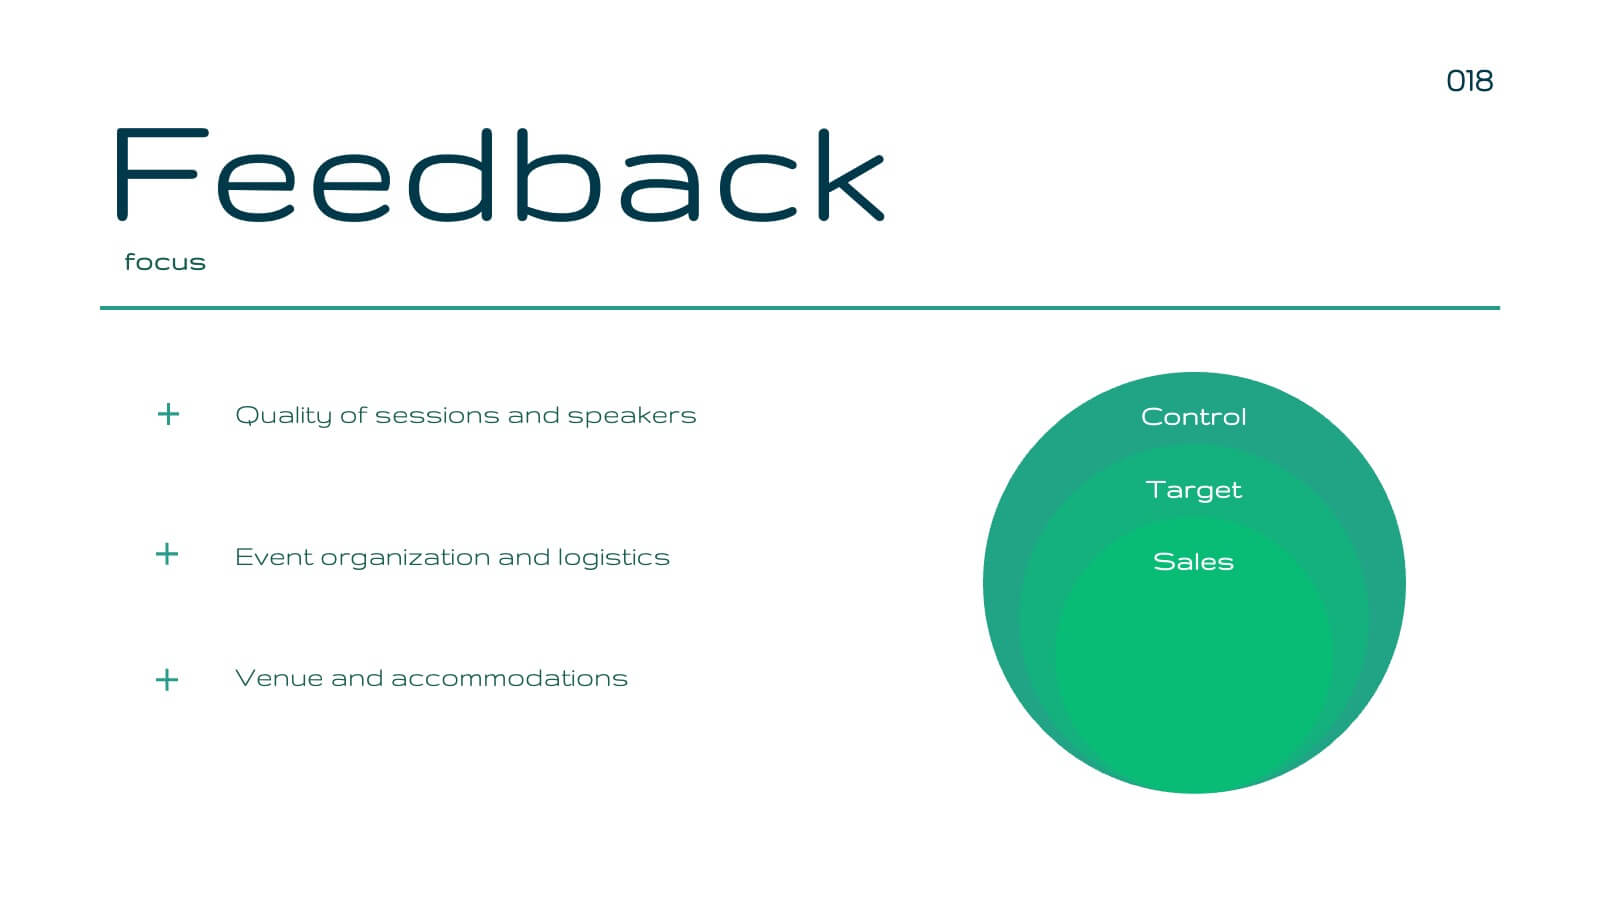
Market Segmentation Customer Profile Presentation
Define Your Ideal Customer with Market Segmentation! The Market Segmentation Customer Profile template is designed to visually categorize customer demographics, behaviors, and needs. Featuring a clean, professional layout with a circular segmentation design, this template helps businesses analyze target audiences, refine marketing strategies, and improve customer engagement. Ideal for marketers, sales teams, and business analysts, this PowerPoint, Keynote, and Google Slides-compatible template is fully editable, allowing you to tailor insights and key data points effortlessly.


4 slides
Executive Data Overview Dashboard Presentation
Drive informed decision-making with the Executive Data Overview Dashboard Presentation. This sleek, data-centric slide layout features clean blocks for KPIs, progress percentages, and simple bar or donut charts—ideal for summarizing business insights, performance metrics, or operational updates. Fully editable in PowerPoint, Keynote, and Google Slides, it's designed for clarity, speed, and high-level reporting.


5 slides
Competitive Strategy with Five Forces Presentation
Effectively visualize Porter’s Five Forces with this dynamic funnel-style infographic. Ideal for breaking down buyer power, supplier power, competitive rivalry, threats of substitution, and new entrants in a clear, engaging format. Perfect for consultants, strategists, and educators. Fully editable in PowerPoint, Keynote, and Google Slides.


4 slides
Business Cycle Diagram Overview Presentation
Illustrate your business processes with this modern cycle diagram template. Designed to showcase four interconnected stages, it’s ideal for visualizing workflows, project phases, or continuous improvement models. Fully editable in Canva, PowerPoint, and Google Slides, this template helps you present complex cycles with clarity and visual impact.


7 slides
Organized Table of Content Slide Presentation
Present your topics with clarity using this Organized Table of Content Slide template. Designed for structured overviews, it features clean, modern layouts with customizable section markers and icons. Ideal for reports, proposals, and presentations. Fully editable in Canva, PowerPoint, and Google Slides to fit your brand’s style and color palette.


6 slides
Supply & Freight Route Management Deck Presentation
Take your logistics reporting to the next level with this circular supply route diagram. Ideal for visualizing freight movement, delivery checkpoints, and warehouse coordination, this slide offers a clean and organized way to map your operational flow. Fully compatible with PowerPoint, Keynote, and Google Slides.


6 slides
International Business Operations Layout Presentation
Showcase your company’s global workflow with this international operations map. Featuring a step-by-step arrow layout and matching location markers, it’s perfect for visualizing supply chains, regional tasks, or expansion strategies. Easily customizable and ideal for executive briefings, logistics updates, and global strategy decks. Compatible with PowerPoint, Keynote, and Google Slides.


5 slides
Operational Process Mapping Presentation
Visualize complex workflows with this operational process mapping template, designed with four vertical sections for step-by-step clarity. Ideal for business operations, SOPs, and project management, it features clean flowchart elements for structured planning. Fully editable in Canva, PowerPoint, or Google Slides, ensuring easy customization for any industry or organizational process.


20 slides
Syntax Creative Design Report Presentation
The Design Presentation Template empowers you to deliver visually stunning and organized presentations. With 20 fully editable slides, it includes sections like design briefs, elements, processes, mood boards, prototypes, and timelines. Tailored for designers and creative teams, it's compatible with PowerPoint, Keynote, and Google Slides for seamless customization and impact.