


Features
- 4 Unique slides
- Fully editable and easy to edit in Microsoft Powerpoint, Keynote and Google Slides
- 16:9 widescreen layout
- Clean and professional designs
- Export to JPG, PDF or send by email


Do you have any questions?
Recommend


7 slides
Female Anatomy Infographic
Anatomy is the branch of biology that focuses on the structure and organization of living things. Step into a world of discovery with our infographic template, this is an enlightening visual guide that celebrates the intricate beauty and functionality of the female body. This infographic is designed to educate and empower, offering a clear and artistic representation of the anatomy that defines women. This template will take your audience through an educational journey through the various systems that make up a woman's body. This is fully customizable and compatible with Powerpoint, Keynote, and Google Slides.


6 slides
30 60 90 Day Plan for Executives Infographics
Develop a strategic plan for executives with our customizable 30, 60, and 90 Day Plan for Executives infographic template. This template is fully compatible with popular presentation software like PowerPoint, Keynote, and Google Slides, allowing you to easily customize it to outline the key objectives and priorities for executives over these timeframes. The 30, 60, and 90 Day Plan for Executives infographic template offers a visually engaging platform to structure and communicate short-term goals, milestones, and initiatives for executive leaders. Whether you're an executive, manager, or HR professional, this template provides a user-friendly canvas to create informative presentations and strategic plans. Optimize executive performance and alignment with this SEO-optimized 30, 60, and 90 Day Plan for Executives infographic template, thoughtfully designed for clarity and ease of use. Customize it to showcase specific objectives, key projects, performance metrics, and alignment with broader organizational goals, ensuring that executives have a clear roadmap for success. Start crafting your personalized infographic today to help executives drive strategic impact in their roles.


26 slides
Natlea Presentation Template
Need help presenting your next travel destination? This template is a unique and sophisticated way to present your travel destination. The Natlea travel template is a fun, surprisingly sophisticated and easy to use template that allows you to list all the details of your trip. With bold colors, charts, budget slides and venn diagrams this template has it all. It's simple yet fun design makes it stand out and at the same time keep your audience engaged. This is the perfect choice for marketers, tourism professionals or anyone who needs to make a great looking presentation on their next trip.


7 slides
Medical Insurance Infographic
The Medical Insurance Infographic provides a clear and concise visualization of insurance policy features, coverage details, and benefits. Ideal for insurance companies, healthcare professionals, and policyholders, this infographic simplifies complex insurance information into digestible segments. With a clean and professional design, the infographic outlines key insurance concepts such as premium rates, deductibles, copayments, and coverage limits. It also offers a visual comparison of different plans, aiding customers in making informed decisions regarding their healthcare coverage. Customizable for different audiences, this SEO-optimized infographic can be used on websites, in marketing materials, or during consultations to enhance understanding of medical insurance options. Employ our Medical Insurance Infographic to effectively communicate the value of insurance plans and help individuals navigate their healthcare needs with confidence.


2 slides
Clean Cover Page Presentation
Start your presentation with a bold first impression using this sleek and minimalistic cover design. Perfect for business proposals, reports, or client pitches, this layout draws attention with clean typography and a strong visual hierarchy. Fully editable and easy to personalize in PowerPoint, Keynote, and Google Slides for smooth customization.


6 slides
Cognitive Psychology Infographics
Delve into the fascinating realm of Cognitive Psychology with our customizable infographic template. This template is fully compatible with popular presentation software like PowerPoint, Keynote, and Google Slides, allowing you to easily tailor it to convey essential concepts and insights within the field of Cognitive Psychology. The Cognitive Psychology infographic template serves as a visually engaging platform for summarizing key principles, theories, and research findings. Whether you're a psychology student, educator, or simply intrigued by the workings of the human mind, this template provides a user-friendly canvas to create informative presentations and educational materials. Enhance your understanding of Cognitive Psychology with this SEO-optimized infographic template, designed for clarity and ease of use. Customize it to showcase cognitive processes, influential experiments, and practical applications, making complex concepts more accessible to your audience. Start crafting your personalized infographic today to explore the depths of Cognitive Psychology.


6 slides
5G Wireless Infographics
The "5G Wireless" infographic template is a futuristic and informative resource, perfect for PowerPoint, Keynote, and Google Slides. Designed for telecom companies, tech firms, and educators, this template is an excellent way to present the advancements and potentials of 5G technology. This template features key aspects of 5G technology, including advancements over previous generations, speed comparisons, and potential applications. Its high-tech design and clear layout make it ideal for explaining the complexities and advantages of 5G in a way that is easy to understand and visually appealing. This is especially beneficial for presentations aimed at highlighting the revolutionary impact of 5G on various industries and consumer technology. With a color scheme that uses shades of blue and metallic accents, the design conveys concepts of speed, connectivity, and innovation. This not only makes the template visually striking but also aligns with the cutting-edge nature of 5G technology. Whether used in corporate presentations, educational seminars, or tech expos, this template ensures that your insights into 5G wireless technology are communicated effectively and engagingly.


5 slides
Operational Structure Layout Presentation
Visualize team hierarchies and departmental flow with this operational structure layout. Ideal for displaying reporting lines, management roles, or project leads. Clean, minimal, and easy to edit in Canva, PowerPoint, or Google Slides—perfect for internal presentations, HR planning, or business development overviews. Keep your structure clear and professional.


7 slides
Europe Market Map Infographic
Journey through the intricate tapestry of the European market with our exquisitely crafted map infographic. Set against the refreshing backdrop of white, complemented by the depth of green and blue, our template encapsulates the multifaceted nature of Europe's vibrant market landscape. Augmented with precise infographics, symbolic icons, and country-specific image placeholders, it serves as an insightful guide to Europe's economic terrains. Flawlessly configured for Powerpoint, Keynote, or Google Slides. A priceless asset for business strategists, marketers, or any organization tapping into the European market. Navigate with insight; let every slide be a doorway to European market opportunities.


7 slides
Basic Tables Of Content Infographic
Our basic tables of content infographic provides a streamlined and visually engaging way to present a list of topics or sections in a document, presentation, or any content piece. With a foundational white background contrasted by vivid touches of red and multicolored highlights, this template brings both simplicity and vibrancy to the often-standard table of contents. Perfect for authors, researchers, educators, and students, this infographic offers an efficient way to present a roadmap of what lies ahead. Whether you're working on PowerPoint, Keynote, or Google Slides, this template ensures that your table of contents stands out, guiding your audience effortlessly.


27 slides
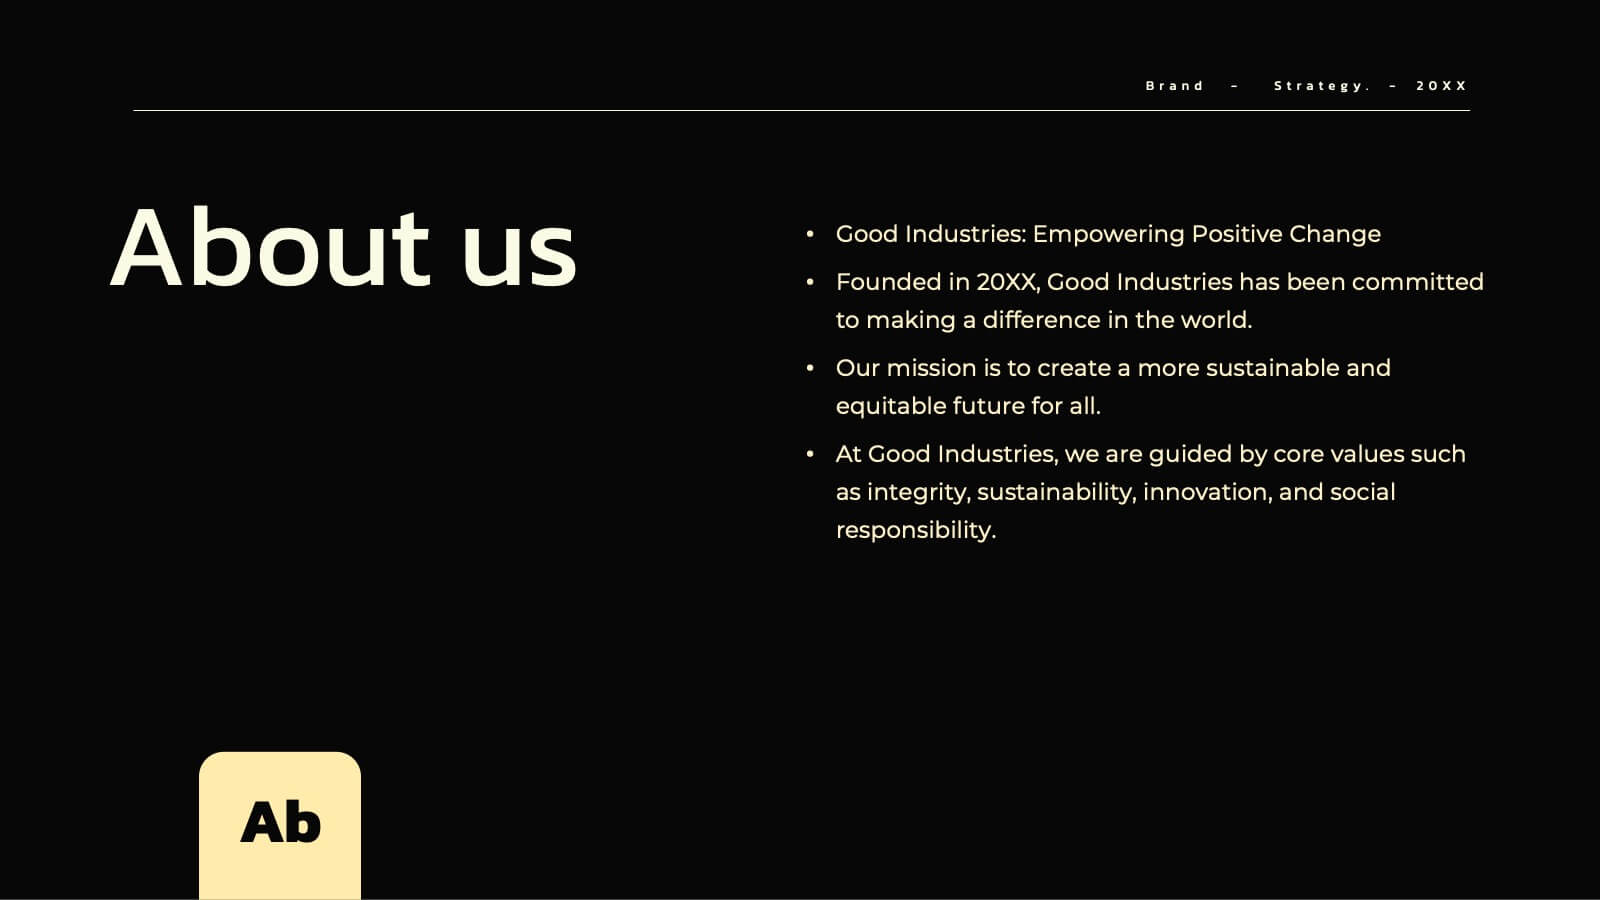
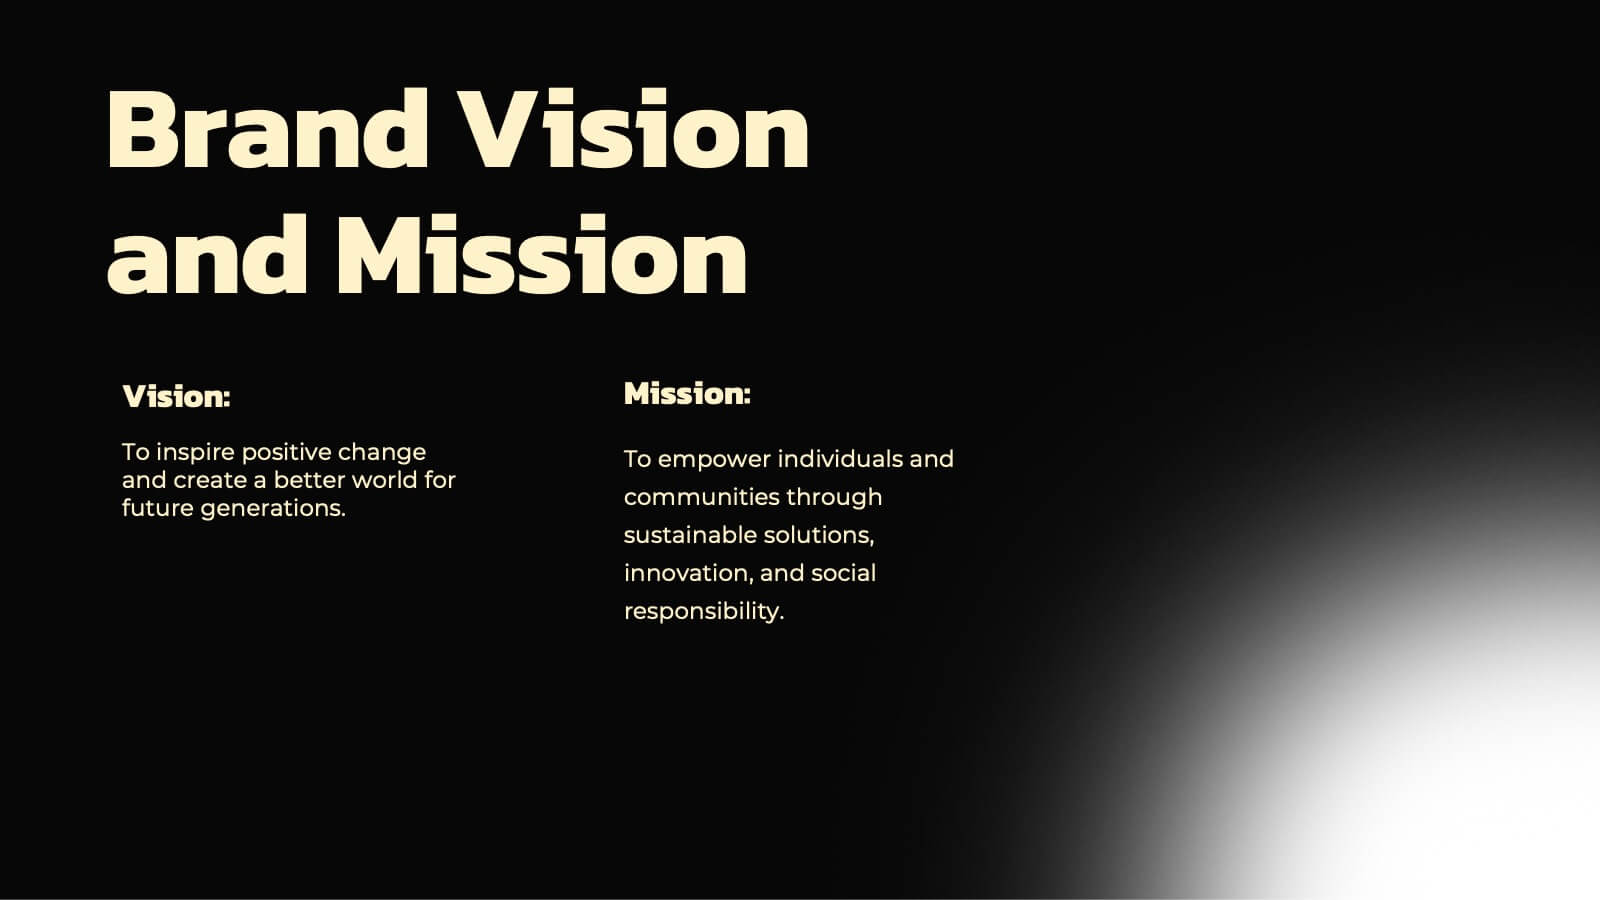
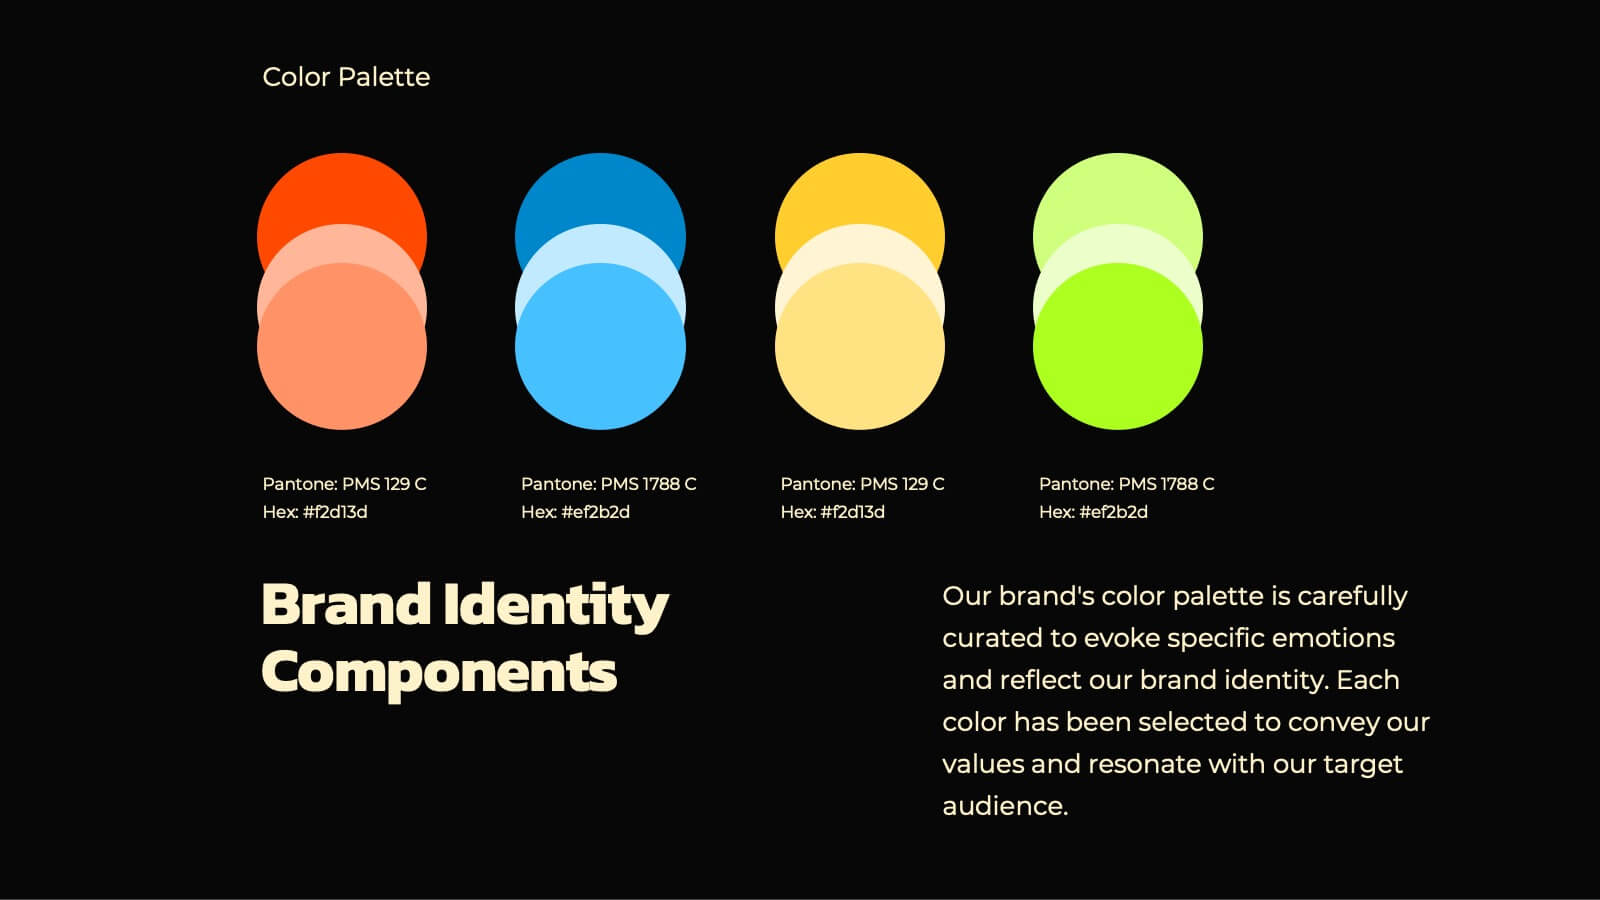
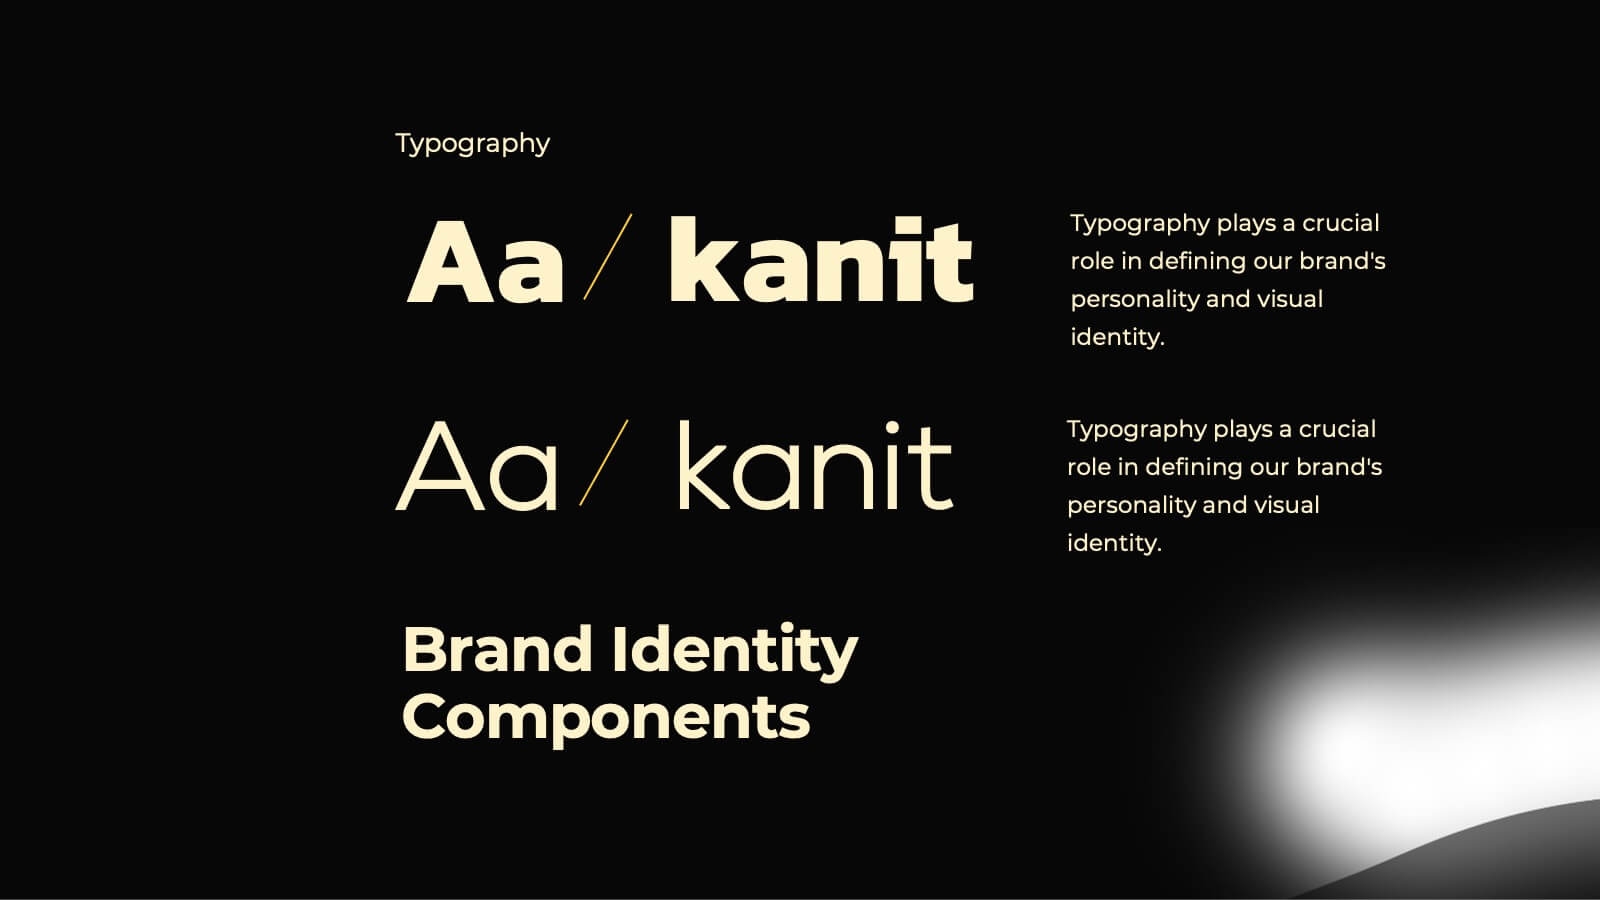
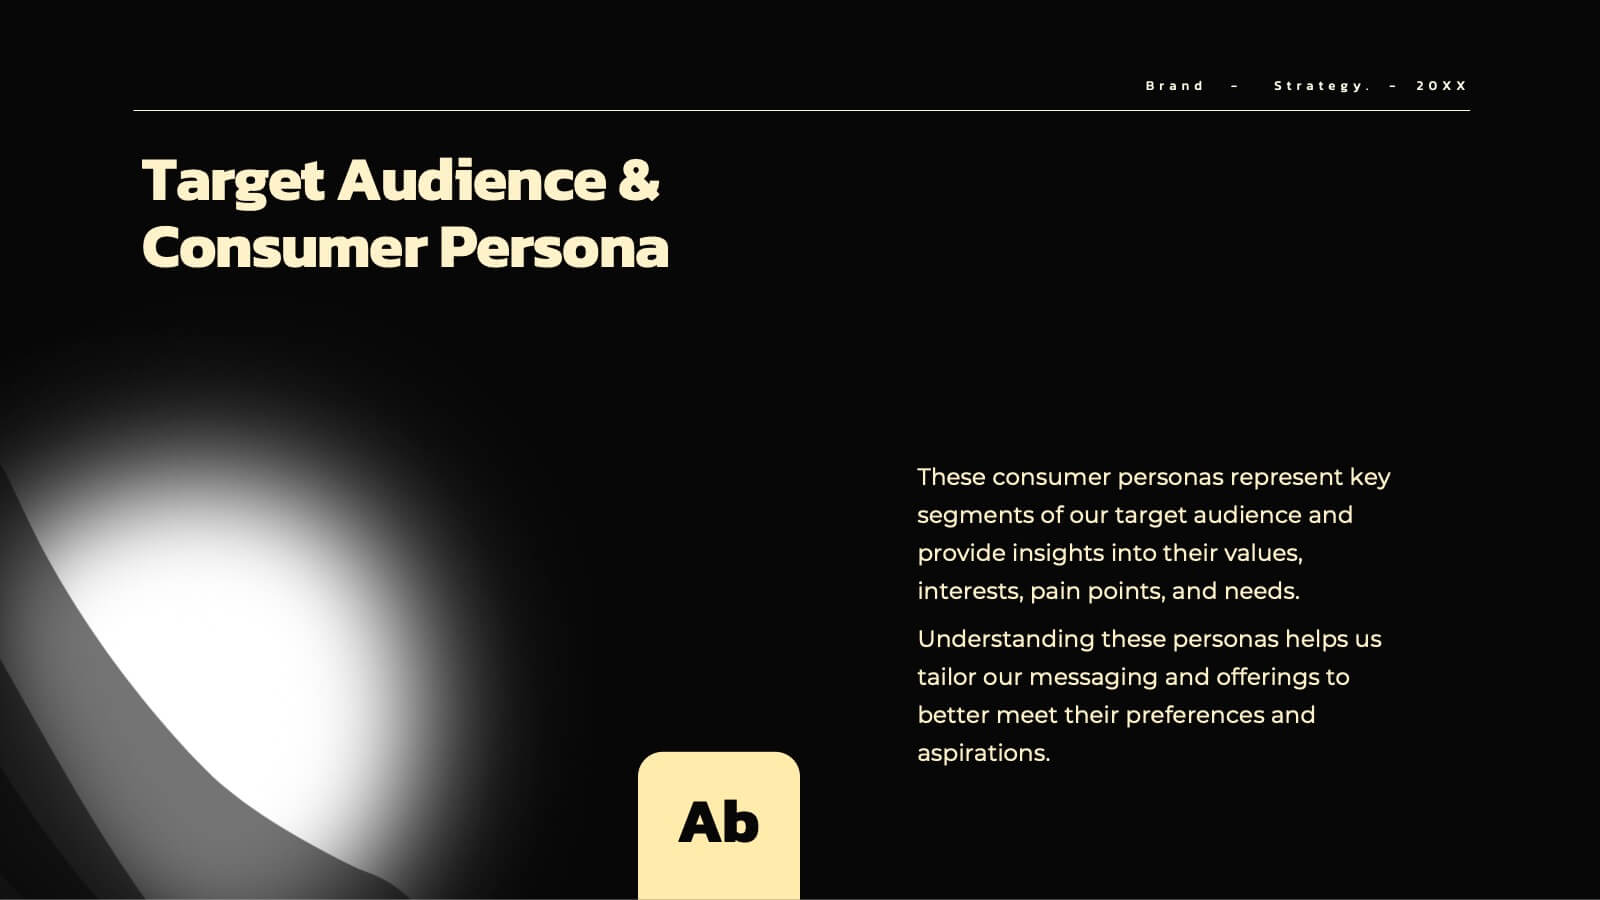
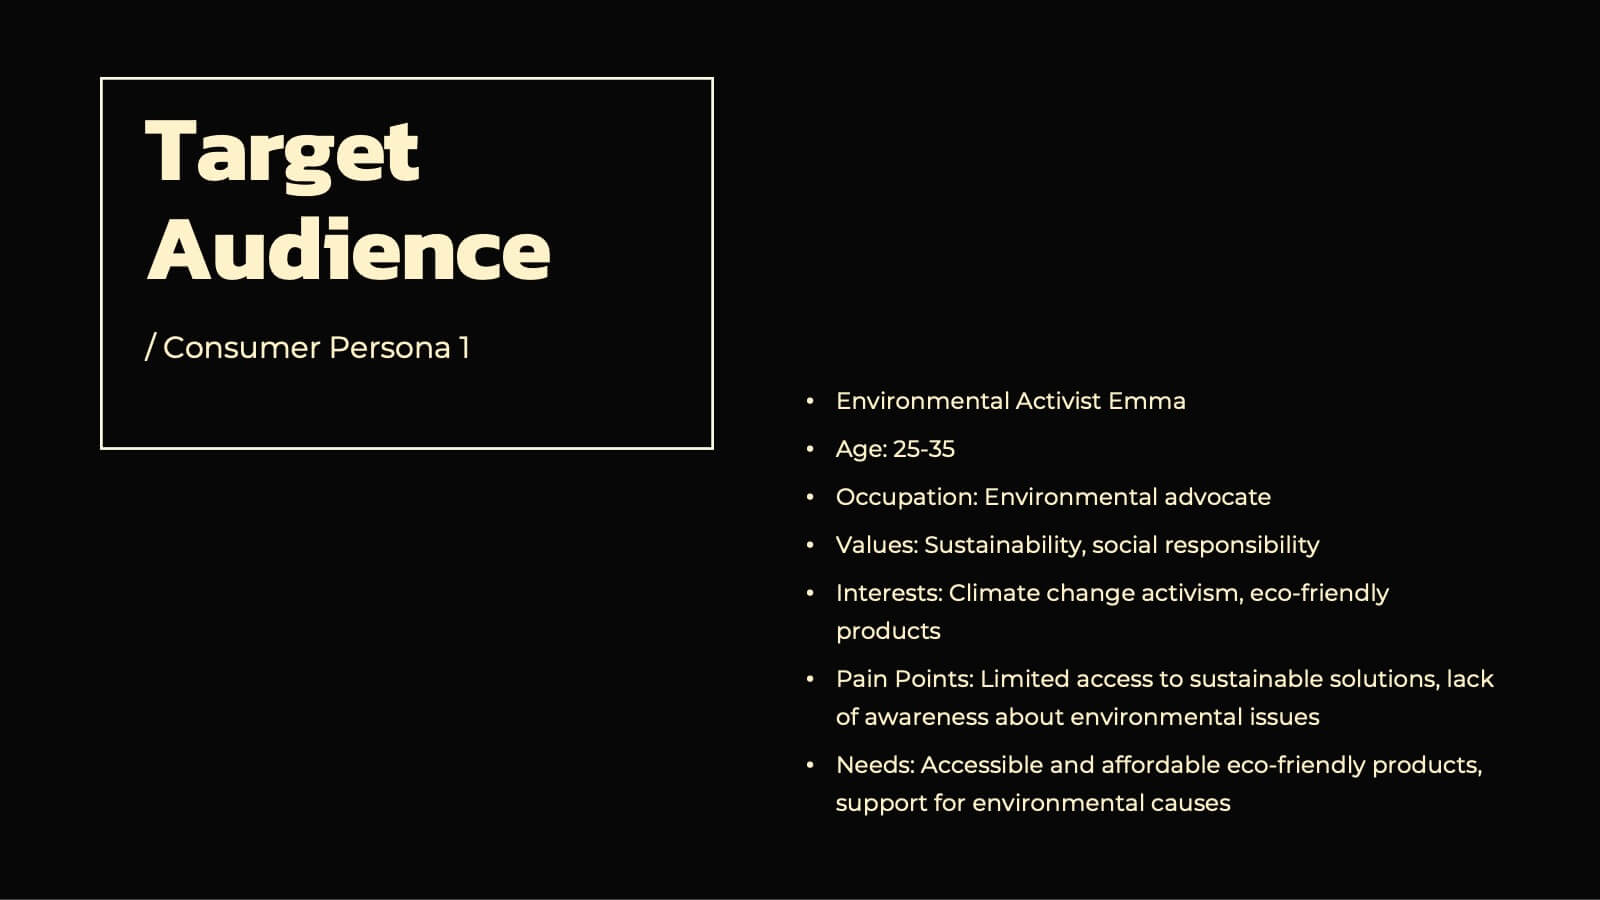
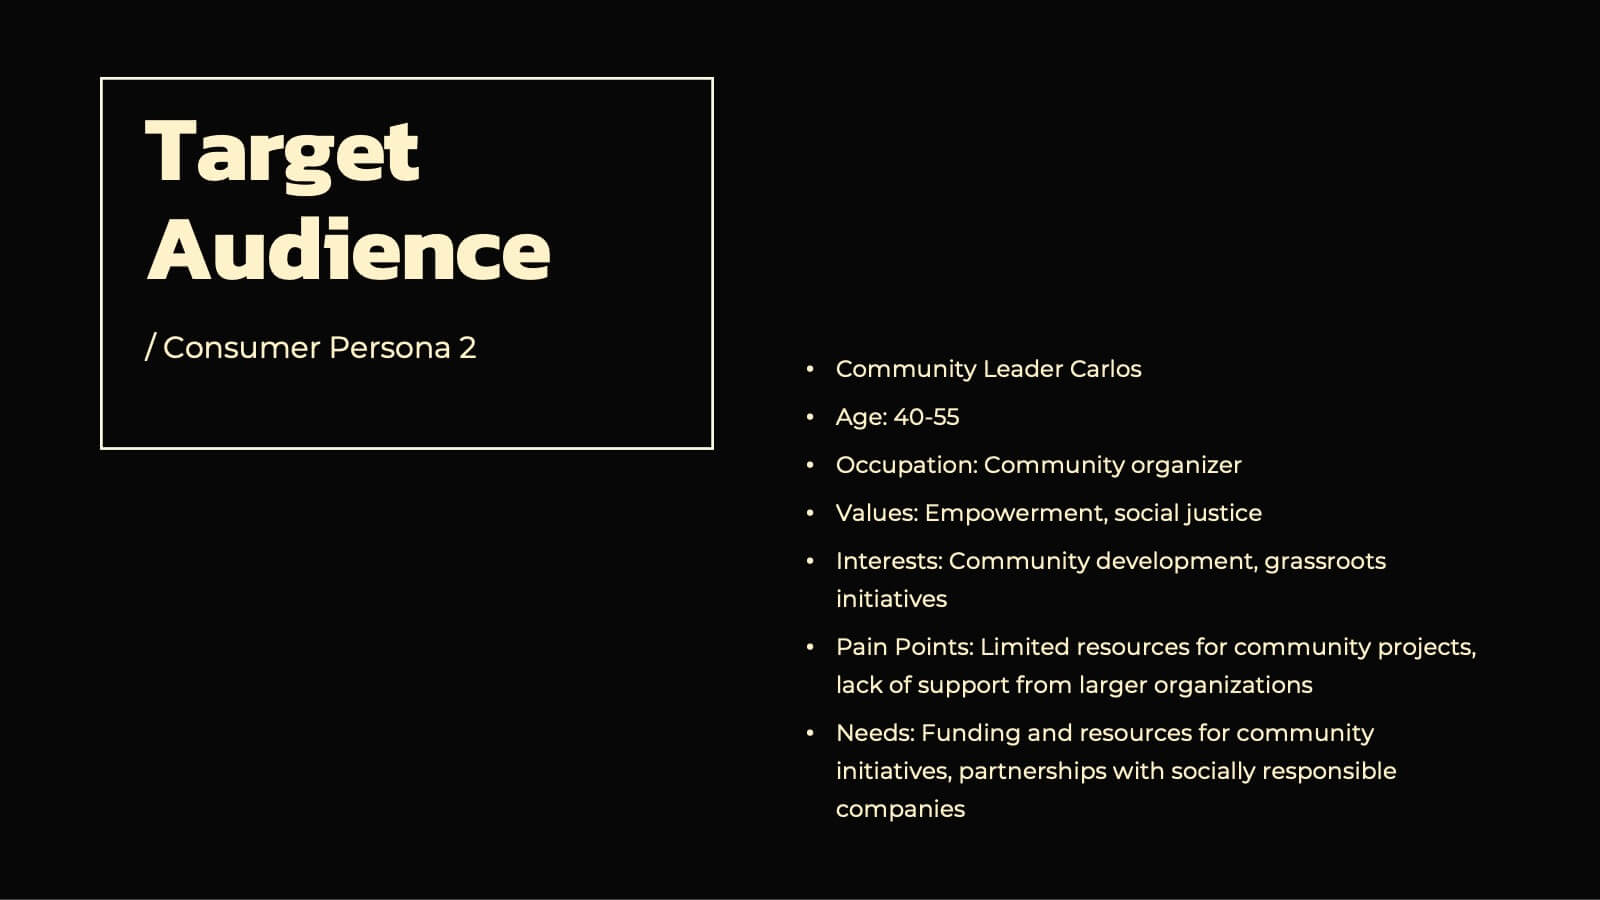
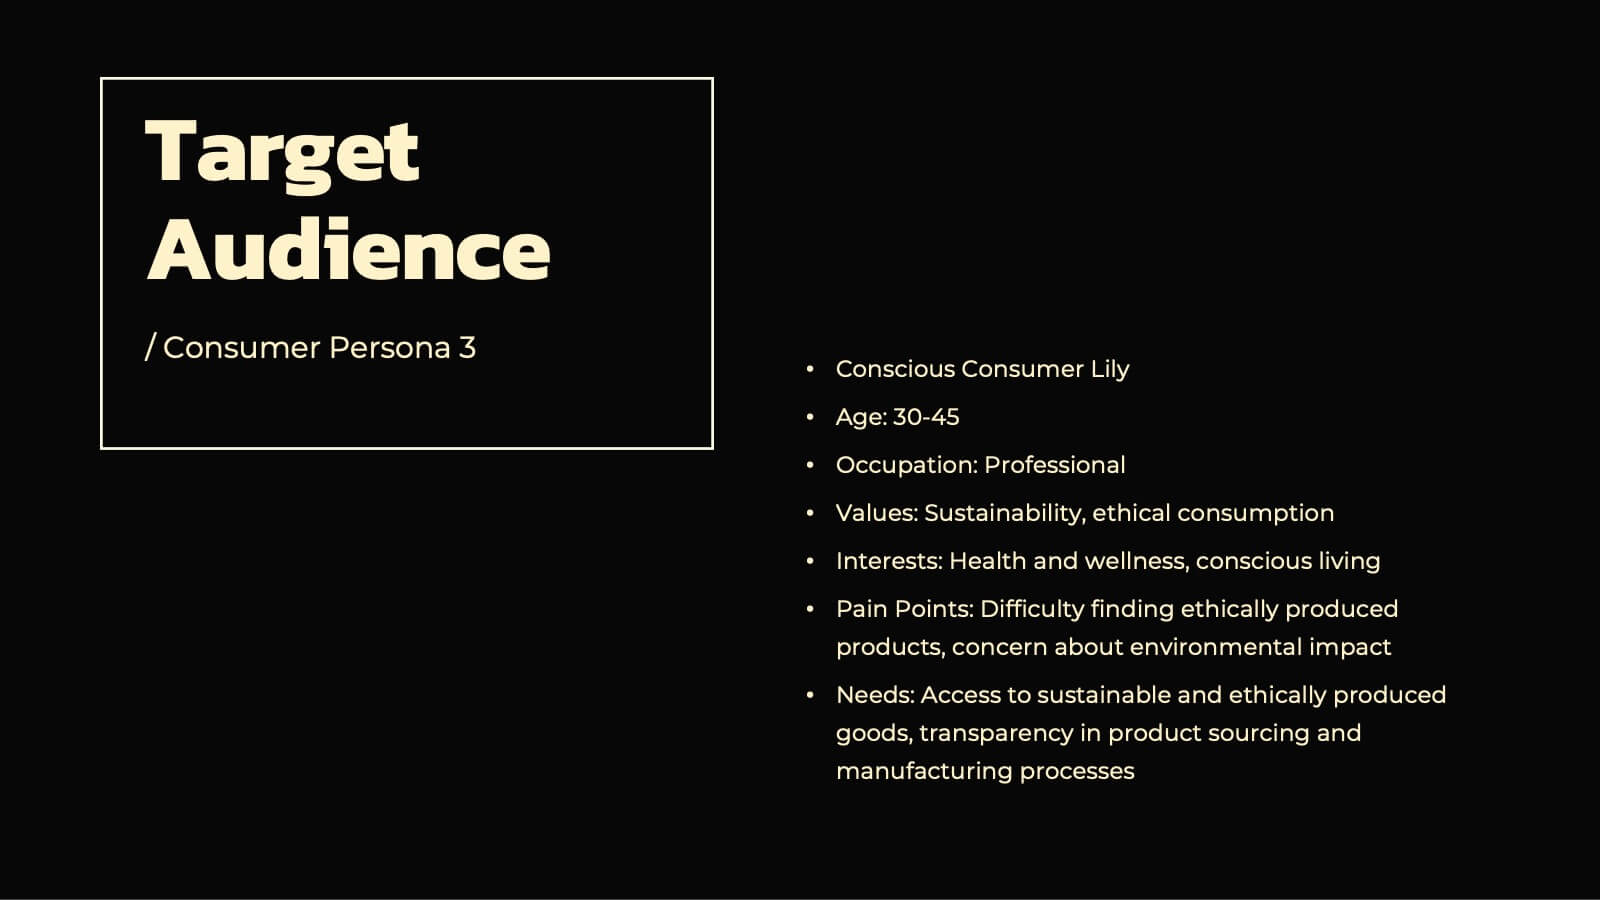
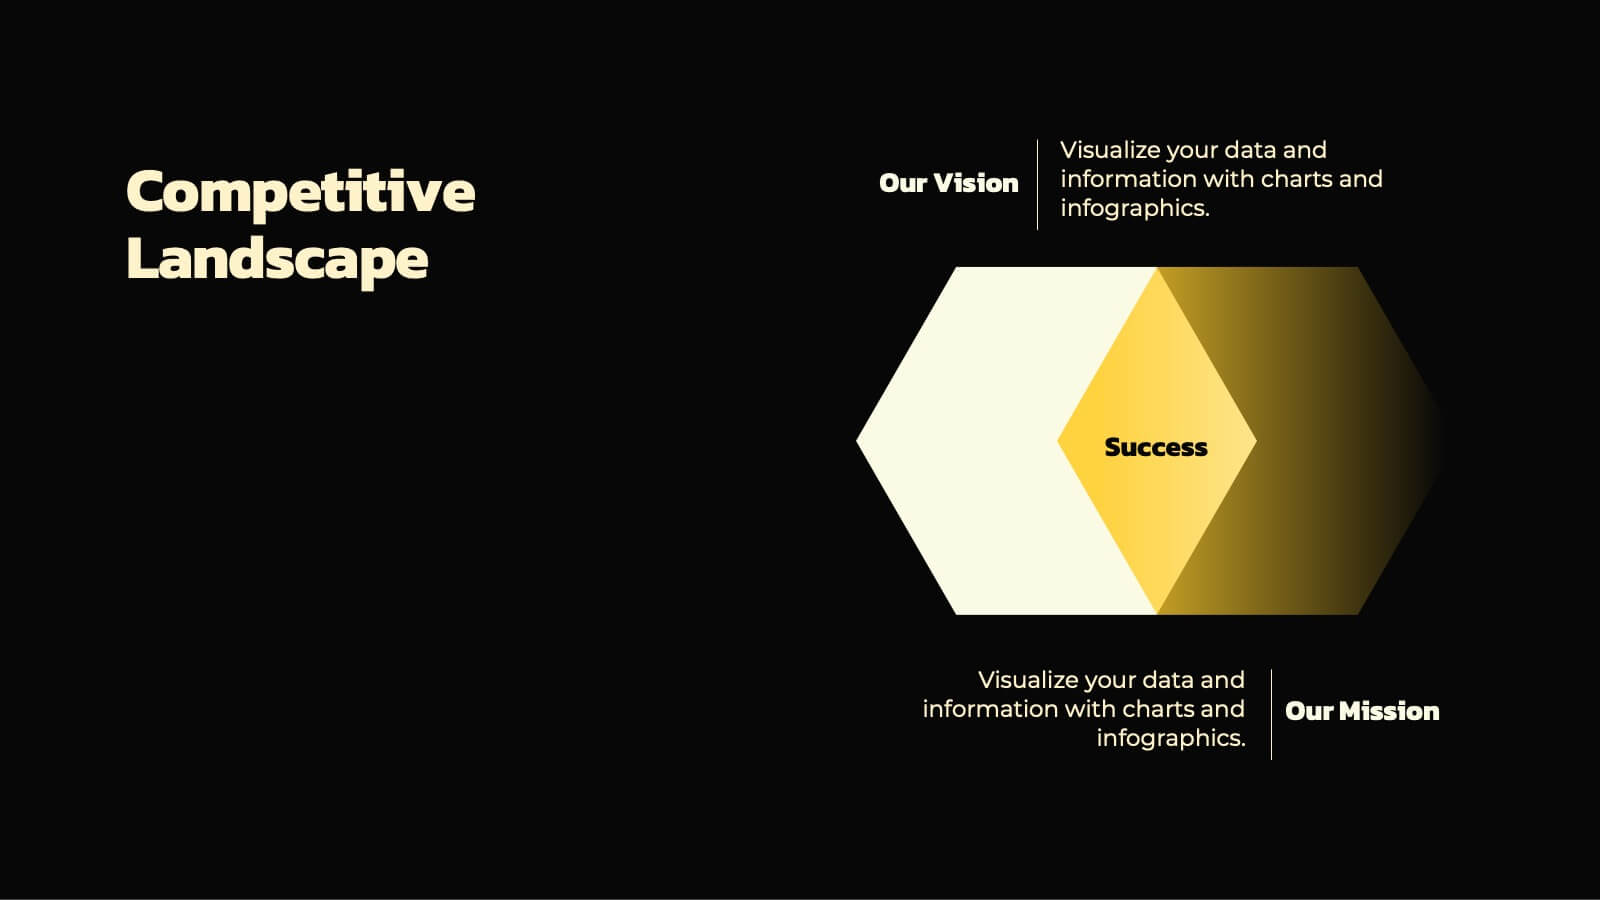
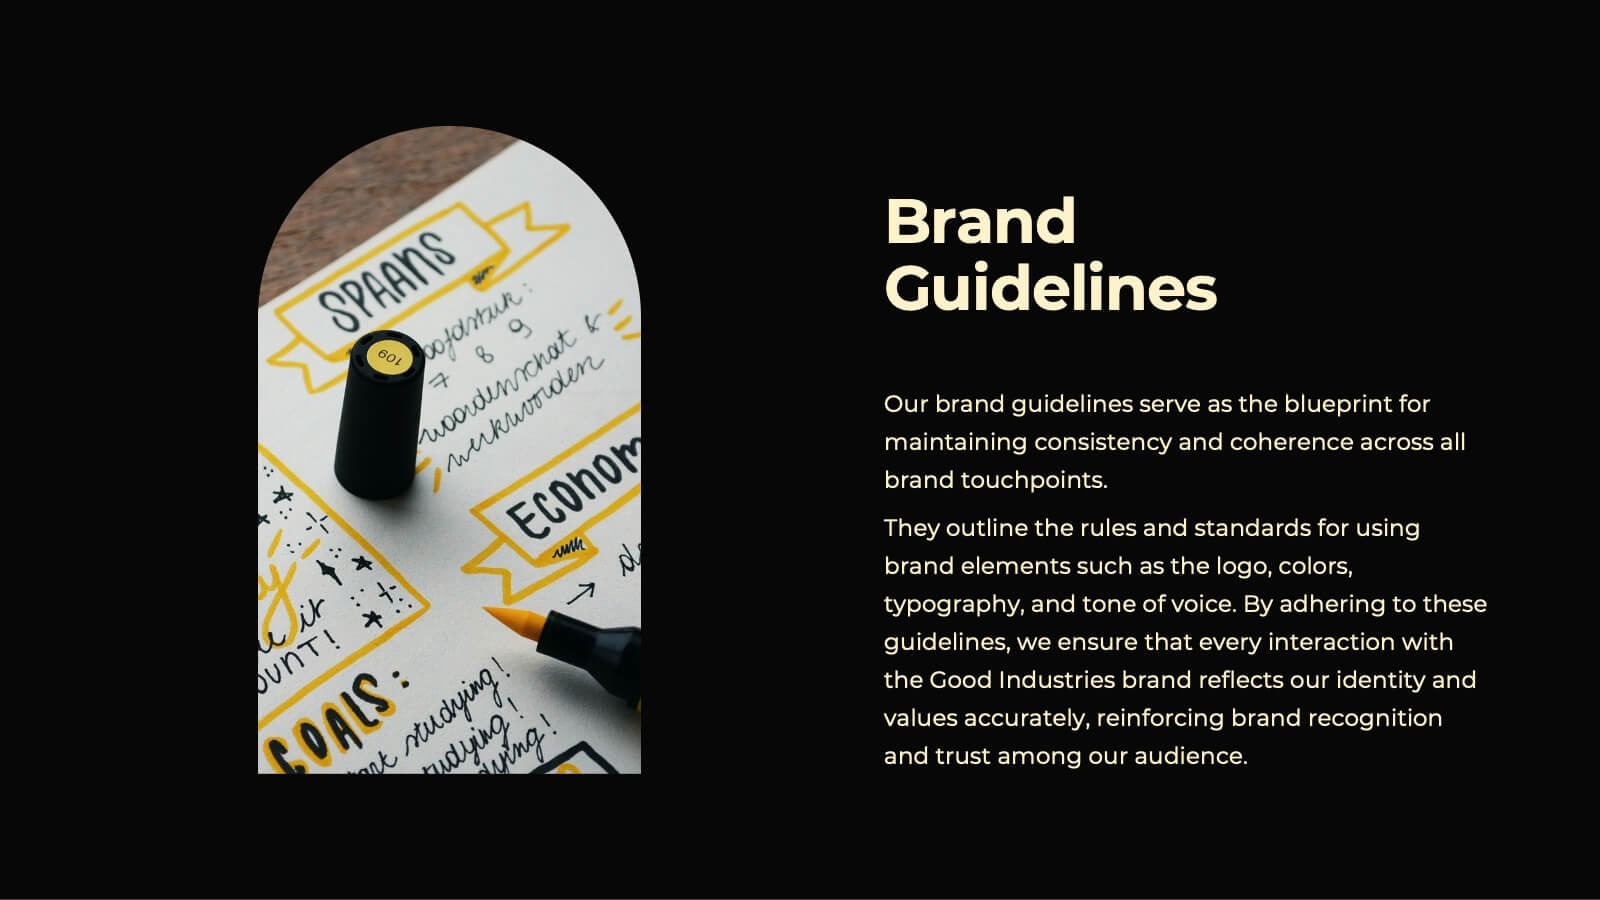
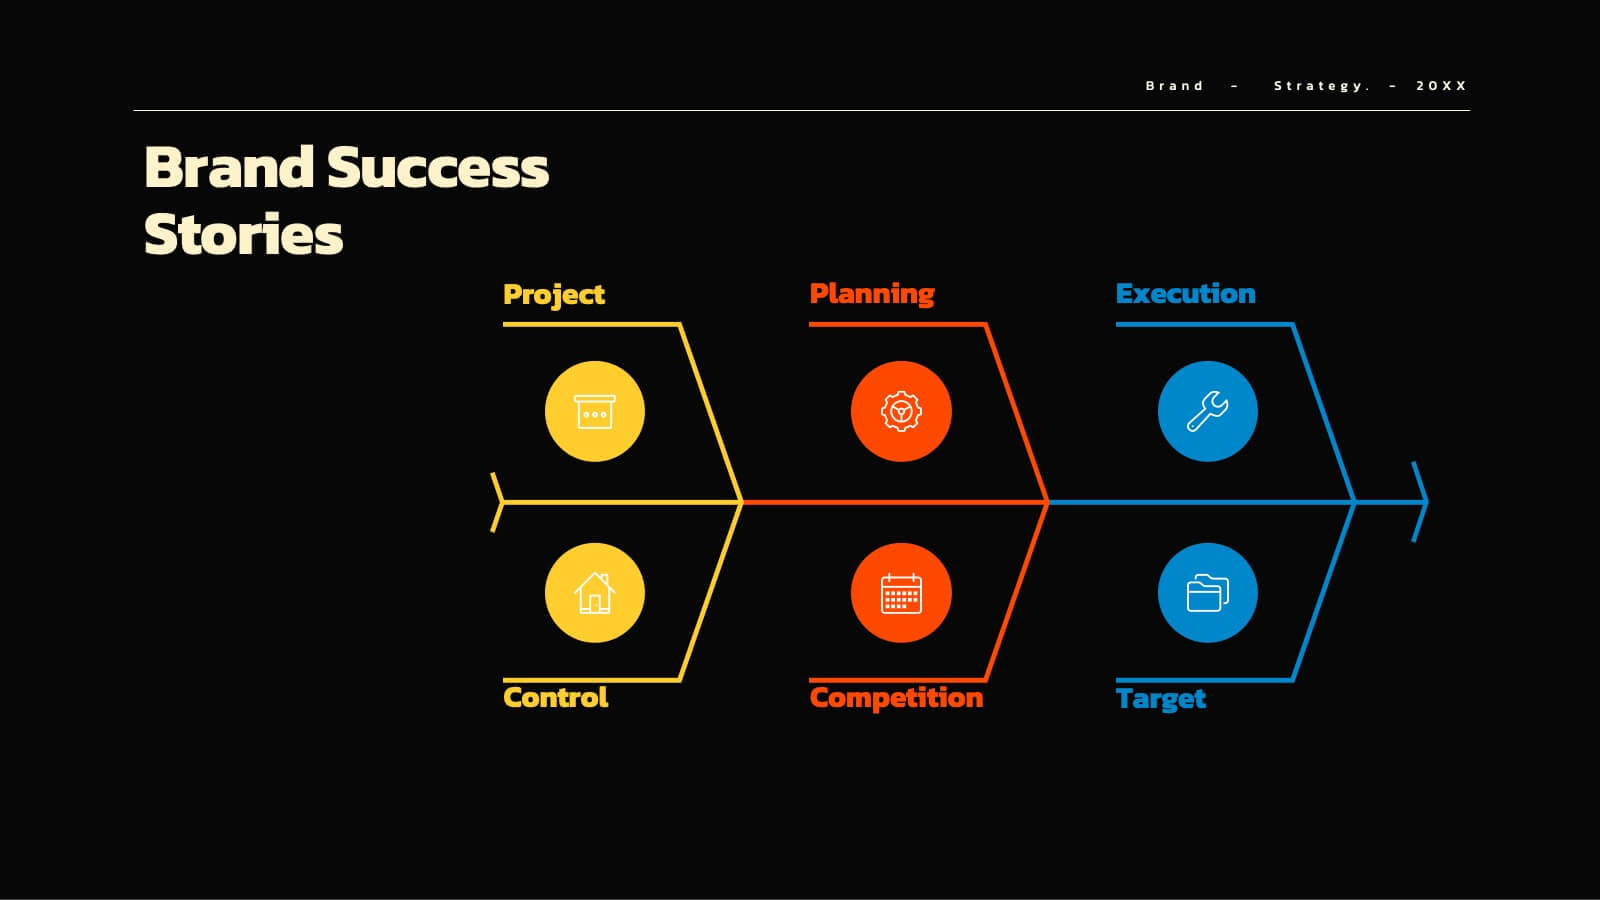
Aqua Brand Strategy Report Presentation
Make waves with this fresh, aqua-inspired presentation template, perfect for delivering a standout brand strategy report! Designed to help you showcase your brand's vision, market positioning, and strategic goals, it features a clean, modern layout that grabs attention. Compatible with PowerPoint, Keynote, and Google Slides for effortless customization.


6 slides
Conversion Funnel Infographic Presentation
Optimize your marketing strategy with this Conversion Funnel Infographic template. Clearly illustrate lead generation, customer retention, and sales processes in a structured format. Fully editable to match your branding—customize colors, icons, and text effortlessly. Compatible with PowerPoint, Keynote, and Google Slides for a smooth presentation experience.


6 slides
Deluxe Loyalty Program Infographics
Explore the Deluxe Loyalty Program with our customizable infographic template. This template is fully compatible with popular presentation software like PowerPoint, Keynote, and Google Slides, allowing you to easily customize it to showcase the features, benefits, and advantages of the Deluxe Loyalty Program. The Deluxe Loyalty Program infographic template offers a visually engaging platform to highlight the rewards, incentives, and exclusive offers available to members of the program. Whether you're a business owner, marketer, or customer relations specialist, this template provides a user-friendly canvas to create informative presentations and promotional materials for your loyalty program. Optimize your loyalty program's visibility and appeal with this SEO-optimized infographic template, thoughtfully designed for clarity and ease of use. Customize it to showcase program tiers, benefits, points accumulation, and member testimonials, ensuring that your audience understands the value of participating in the Deluxe Loyalty Program. Start crafting your personalized infographic today to promote customer loyalty and engagement effectively.


6 slides
Value Chain Management Infographics
Optimize your business operations with our Value Chain Management infographic template. This template is fully compatible with popular presentation software like PowerPoint, Keynote, and Google Slides, enabling you to effortlessly customize it to visualize and improve your value chain. The Value Chain Management infographic template offers a visually engaging platform to depict the various activities and processes involved in creating value for your customers. Whether you're a supply chain professional, business owner, or manager, this template provides a user-friendly canvas to create informative presentations and strategies for value chain optimization. Boost your business's efficiency and competitiveness with this SEO-optimized Value Chain Management infographic template, thoughtfully designed for clarity and ease of use. Customize it to highlight key components of your value chain, identify areas for improvement, and streamline your operations for enhanced value creation. Start crafting your personalized infographic today to excel in value chain management.


5 slides
Oil Industry Trends Infographics
The oil industry, also known as the petroleum industry, is a crucial sector of the global economy that involves exploration, production, refining, and distribution of petroleum products. These infographic templates are designed to showcase key trends and insights in the oil industry. They aims to present complex information in a clear and visually appealing manner, making it easy for your viewers to grasp important concepts and trends in the industry. This is perfect for anyone interested in understanding the trends and dynamics shaping the oil industry. Compatible with Powerpoint, Keynote, and Google Slides.


7 slides
Data Analysis Process Infographic
Illuminate the intricacies of the data-driven world with our Data Analysis Process Infographic. Set against the crisp backdrop of white and accented with the brilliance of yellow, the growth-centric green, and the depth of blue, our template brings clarity to the complex realm of data analytics. Outfitted with sharp infographics, intuitive icons, and adaptable image placeholders, it translates raw data into actionable insights. Exquisitely crafted for Powerpoint, Keynote, or Google Slides. A crucial tool for data scientists, business analysts, strategists, or any organization looking to harness the power of data. Analyze with precision; let every slide unravel the stories data tells.


5 slides
Customer Feedback and Review Presentation
Showcase customer feedback trends with the Customer Feedback and Review infographic. Featuring a dynamic timeline with emotion-based ratings, this template helps visualize satisfaction levels, key insights, and areas for improvement. Fully customizable and compatible with PowerPoint, Keynote, and Google Slides.