


Features
- 5 Unique Slides
- Fully editable and easy to edit in Microsoft Powerpoint, Keynote and Google Slides
- 16:9 widescreen layout
- Clean and professional designs
- Export to JPG, PDF or send by email


Do you have any questions?
Recommend


7 slides
Technology Infographic Presentation Template
A technology infographic is a visual representation of information or data related to technology. The purpose of this template is to present your complex information in a simple, easy-to-understand manner. This template contains pre-designed layouts and images that can be used to structure your content in a variety of ways. This template is perfect to use to help explain technology-related topics such as software, hardware, cybersecurity, and more. Infographics are commonly used in the technology industry to help educate people about the latest trends, products, and services.


12 slides
Investment Strategy Presentation
The "Investment Strategy Presentation" template is designed for effectively mapping out and displaying various investment strategies. It uses a multi-colored light bulb graphic, which symbolizes ideas and innovation in investment planning, making it visually appealing and easy to understand. Each segment of the light bulb is labeled with letters A through F, representing different aspects or phases of an investment strategy that can be tailored to specific objectives or points of discussion. This format helps in presenting complex financial data or strategies in a straightforward manner that can be easily grasped by audiences, making it an ideal choice for financial analysts, investors, or corporate strategy meetings.


20 slides
Octave Marketing Proposal Presentation
The Proposal Presentation Template offers a modern, dynamic design to showcase your business strategies, solutions, and goals. Featuring 20 fully editable slides, it covers objectives, methodologies, team expertise, timelines, and budget breakdowns. Perfect for impactful business proposals, it's compatible with PowerPoint, Keynote, and Google Slides for seamless customization.


5 slides
Collaborative Learning Techniques Overview Presentation
Highlight team-based education methods with the Collaborative Learning Techniques Overview Presentation. This layout is perfect for mapping out peer-led discussions, group projects, or cooperative learning strategies using a visual 4-step flow. The clean, screen-themed icons make it ideal for educators, trainers, or eLearning creators. Fully editable in Canva, PowerPoint, Keynote, and Google Slides.


6 slides
Business Decision Flow Model Presentation
Make smarter choices with this Business Decision Flow Model presentation. Clearly map out key decisions, steps, and potential outcomes using a structured, color-coded flow. Perfect for strategy reviews, team meetings, and executive briefings. Fully editable in Canva, PowerPoint, and Google Slides for seamless customization.


6 slides
Tables of Content Analysis Infographic
Table of Contents analysis refers to the examination and evaluation of the structure and content of a document's table of contents. It is commonly used as a preliminary step to understand the flow of information within a longer document, such as a book, report, thesis, or research paper. This infographic template provides insights into the document's structure and can help readers determine whether the document is relevant to their needs. This infographic is designed to provide a quick overview of the topics covered in the document and their distribution, helping readers understand the organization of the content at a glance.


2 slides
Introduction Slide for Professional Decks Presentation
Make a strong first impression with this clean and modern introduction slide. Designed to kick off your presentation with clarity, this template is ideal for professional decks, pitch presentations, and business briefings. Customize the layout with your visuals and text to align with your message. Fully compatible with PowerPoint, Keynote, and Google Slides.


5 slides
Sports Performance Analysis Presentation
Visualize athletic metrics and improvement strategies with this Sports Performance Analysis slide layout. Designed around a dynamic running figure, it uses labeled circular markers (A–D) to clearly break down four key insights or action points. Perfect for sports reviews, training breakdowns, or coaching sessions. Fully editable in PowerPoint, Keynote, and Google Slides.


12 slides
Visual Data Representation Bubble Map Presentation
Present complex data effectively with the Visual Data Representation Bubble Map presentation. This template organizes information into clear, interconnected segments, making it ideal for analytics, business insights, and strategic planning. Compatible with PowerPoint, Keynote, and Google Slides.


21 slides
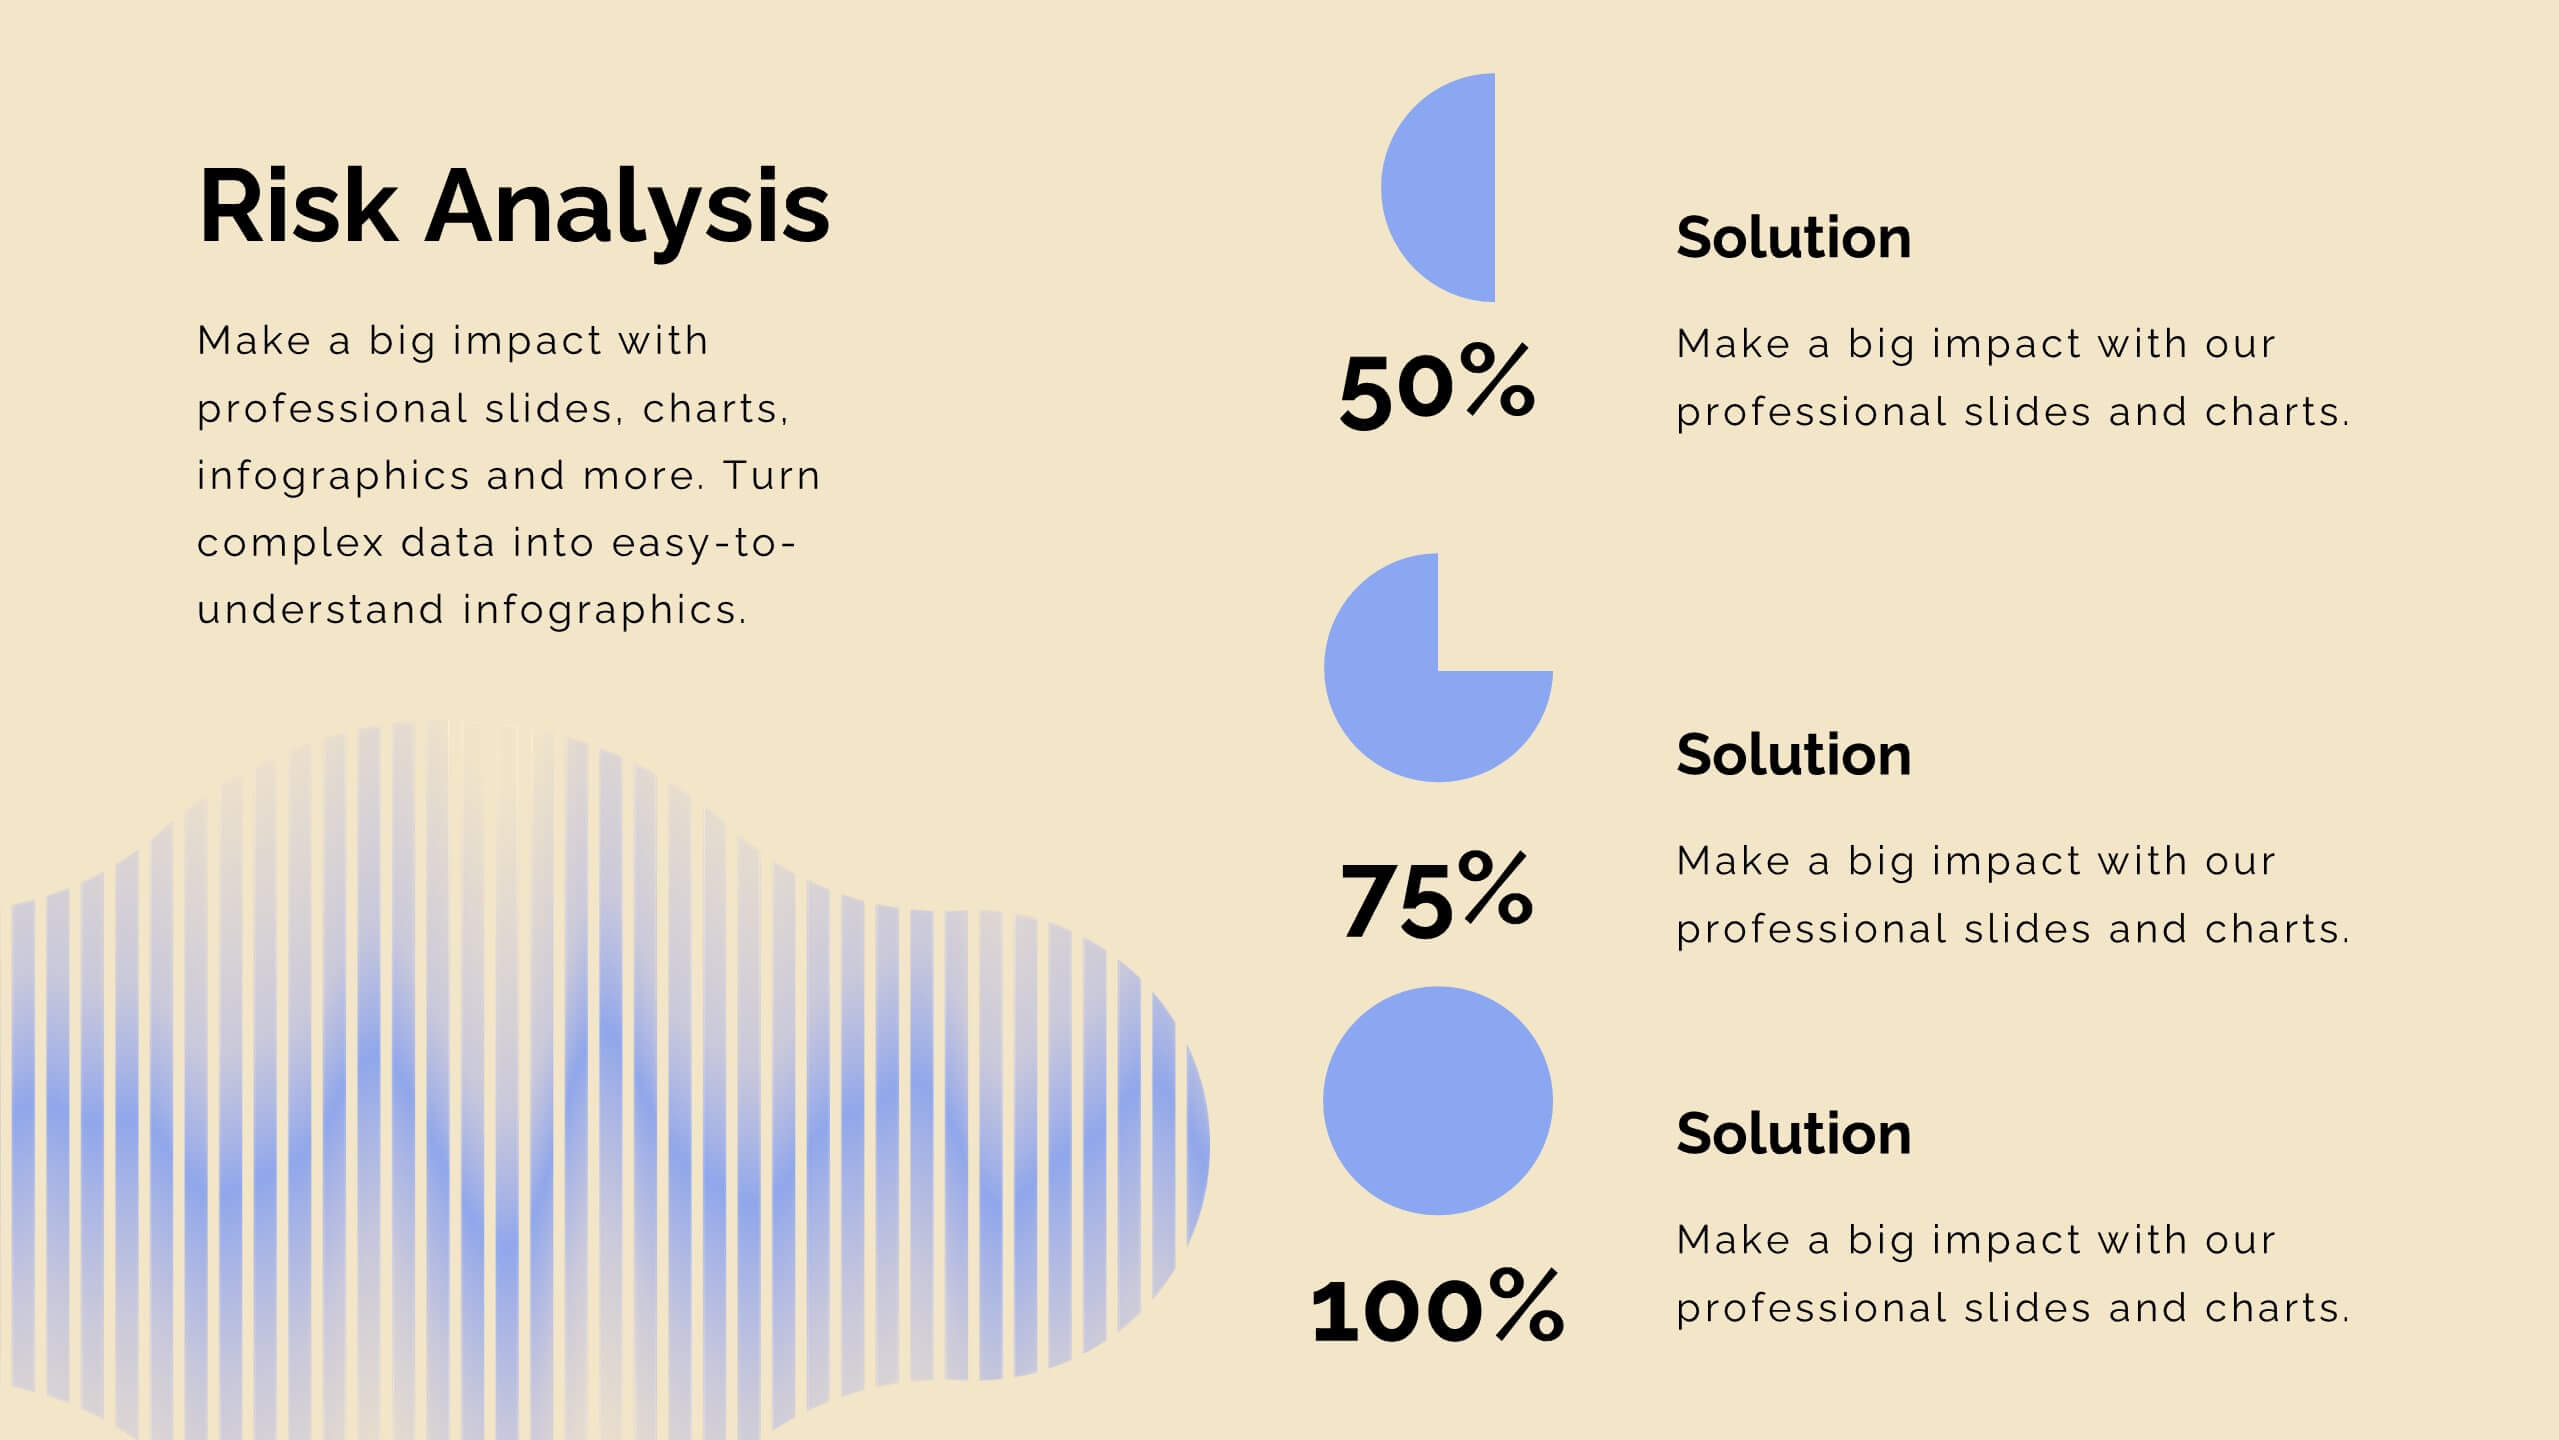
Echochime Project Timeline Presentation
Outline your project’s milestones and deliverables with this comprehensive timeline-focused presentation template. Ideal for project managers and teams, this layout streamlines the process of showcasing objectives, schedules, and key milestones with clarity and precision. The template includes dedicated slides for problem statements, resource allocation, budget planning, stakeholder communication, risk management, and quality assurance. Its visually engaging timeline design ensures a clear and professional overview of your project's progress. Designed for seamless customization, this template is fully compatible with PowerPoint, Google Slides, and Keynote, allowing you to tailor colors, fonts, and layouts to align with your project branding. Present your strategy and progress with confidence, ensuring stakeholders and team members stay informed and aligned.


26 slides
Remote Works Strategie Presentation
This presentation template is designed for businesses focused on remote work strategies. It features a variety of slide types, including team introductions, Gantt charts, comparison slides, and infographics. The design is clean and modern, with a mix of text, images, and icons to help communicate your message effectively. Key slides include options for showcasing your team, outlining different strategies, and presenting data visually through charts and maps. The template also includes device mockups for mobile and laptop views, making it versatile for different presentation needs. Each slide is customizable to fit your brand's colors and content.


4 slides
3-Tier Pricing Table Layout Presentation
Make your pricing pitch pop with this bold and modern layout! This presentation template is perfect for showcasing product or service plans with clear comparisons across three tiers. Designed to streamline pricing communication, it’s ideal for SaaS, consulting, or digital services. Fully compatible with PowerPoint, Keynote, and Google Slides.


8 slides
Customer Market Segmentation Analysis
Visualize your audience insights with precision using the Customer Market Segmentation Analysis Presentation. This slide features a sleek, layered funnel design with percentage bars and arrow pointers—ideal for illustrating demographic splits, buyer behavior, or psychographic segments. With space for four data-driven categories and custom labels, this template is perfect for marketers, analysts, and product teams looking to present actionable customer data. Fully editable in PowerPoint, Keynote, and Google Slides, and easy to adapt to any color scheme or branding.


23 slides
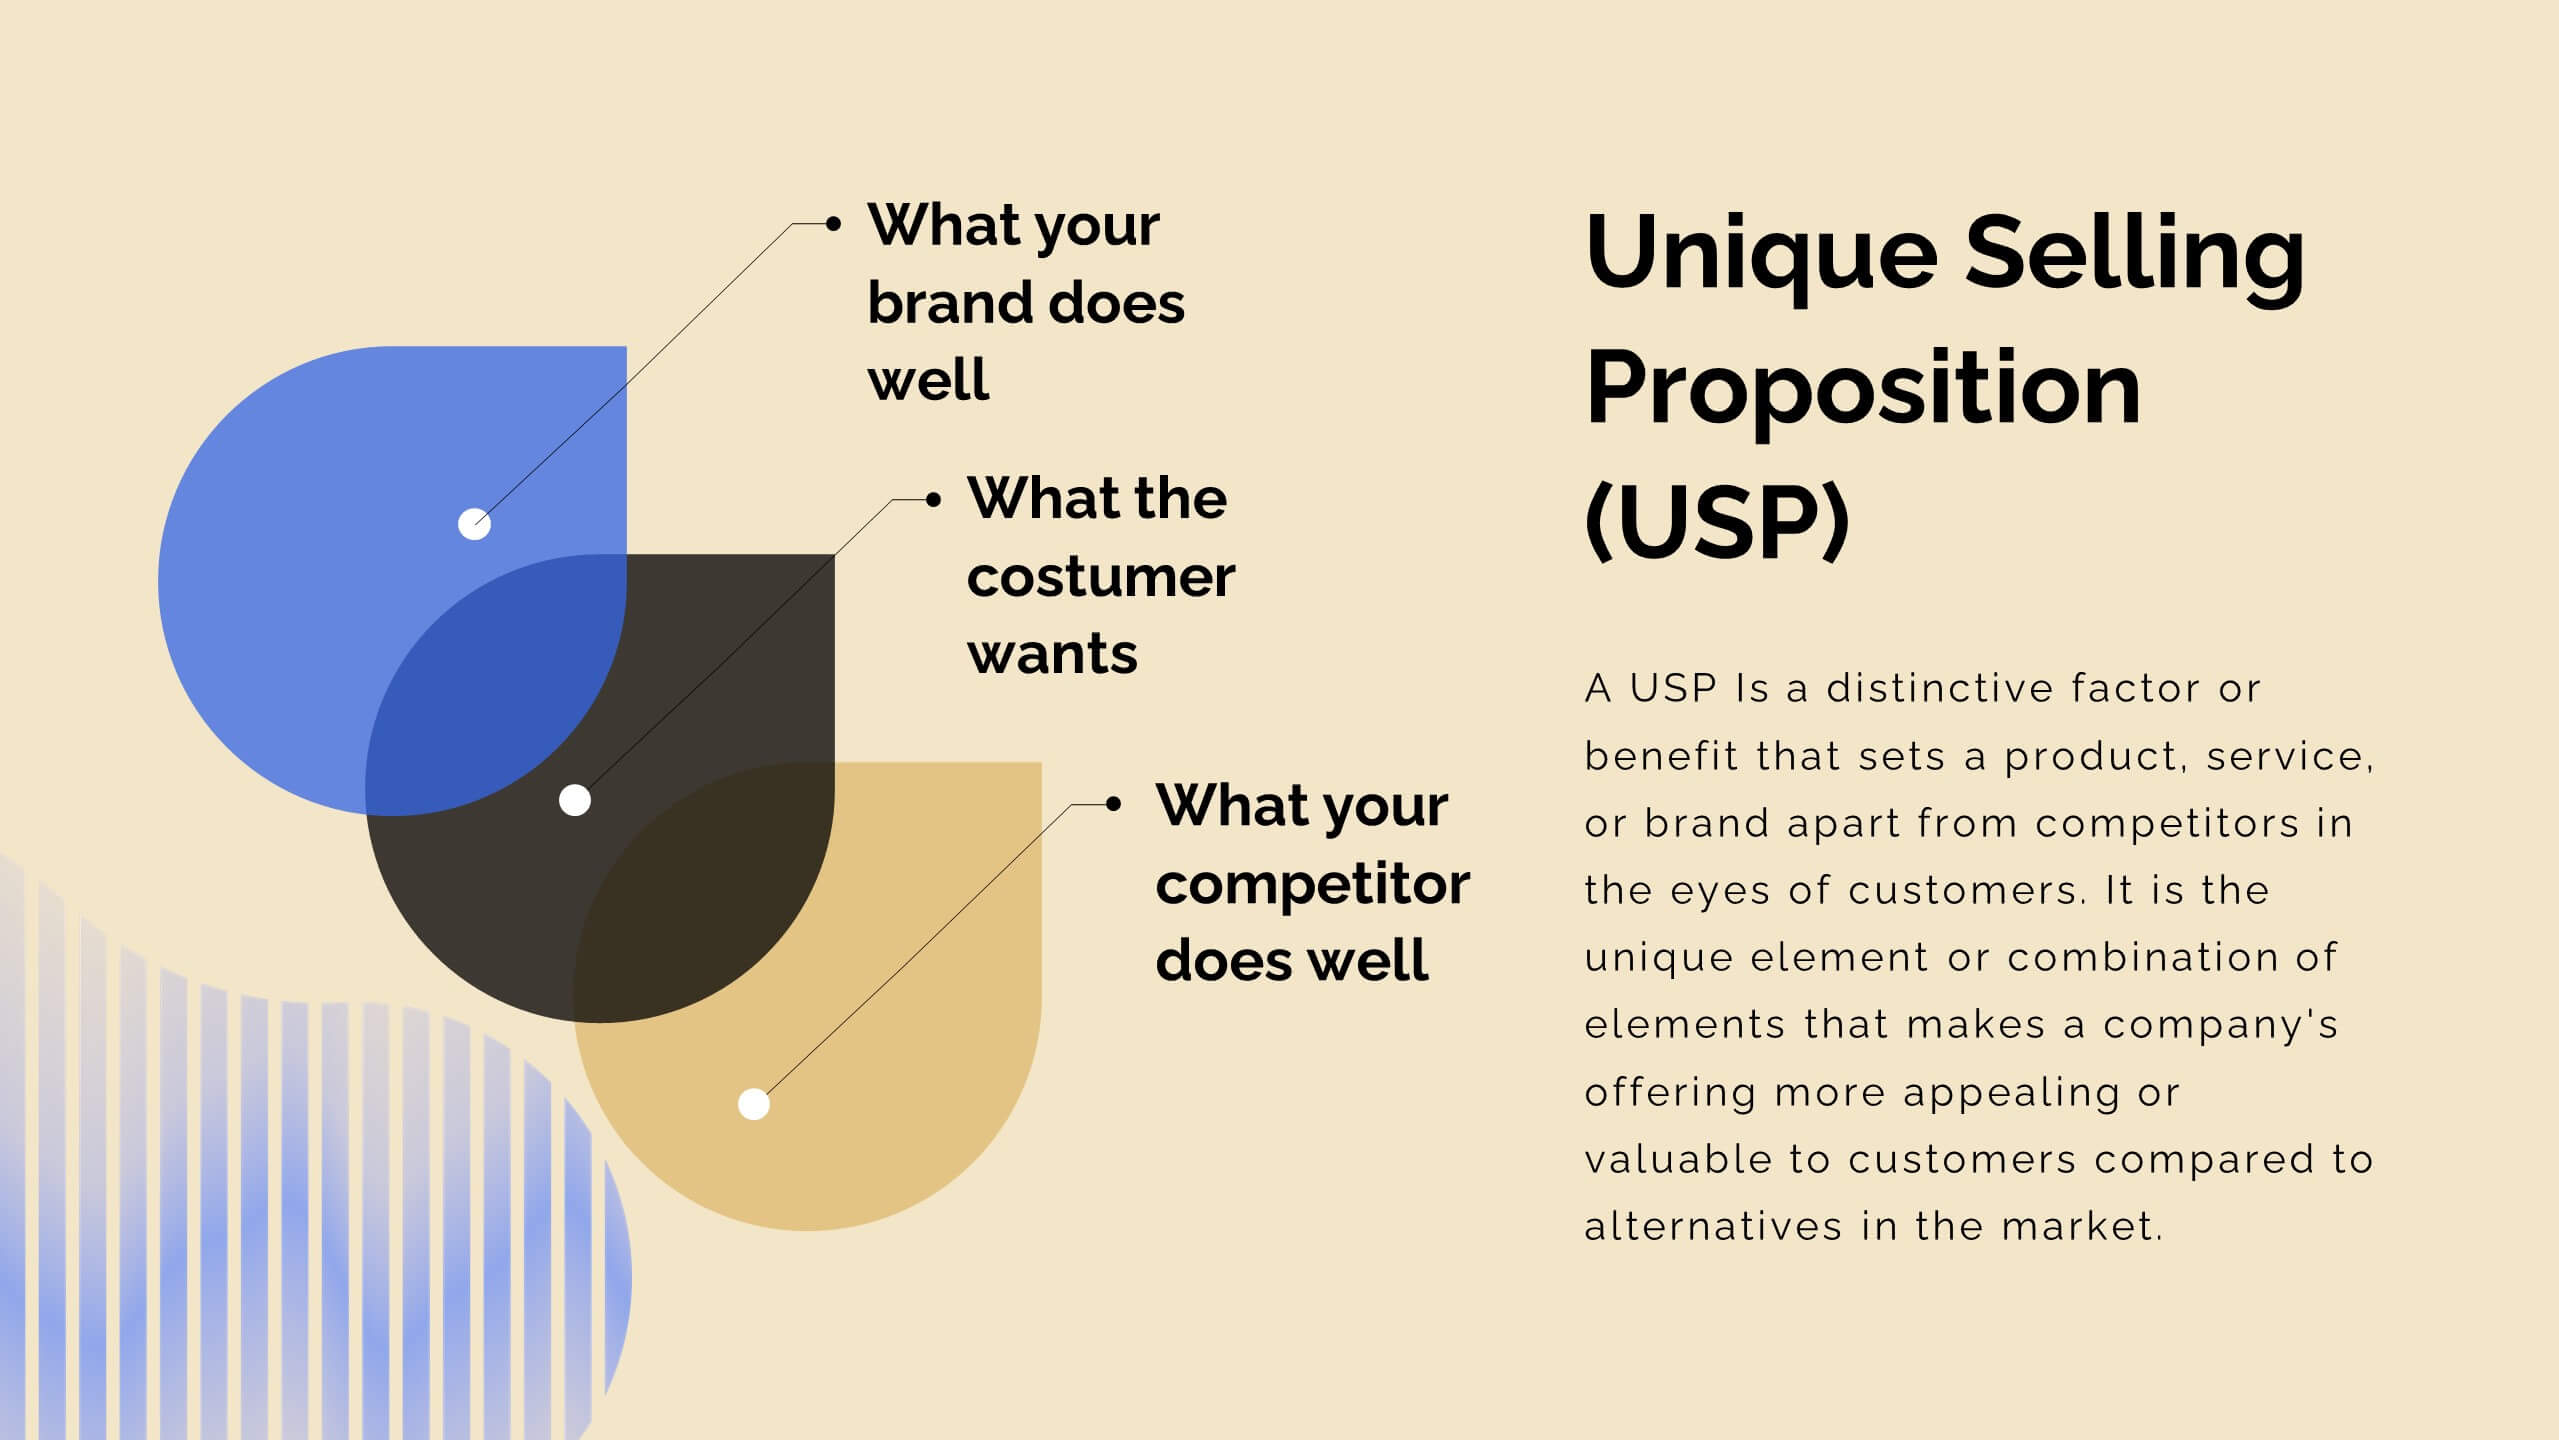
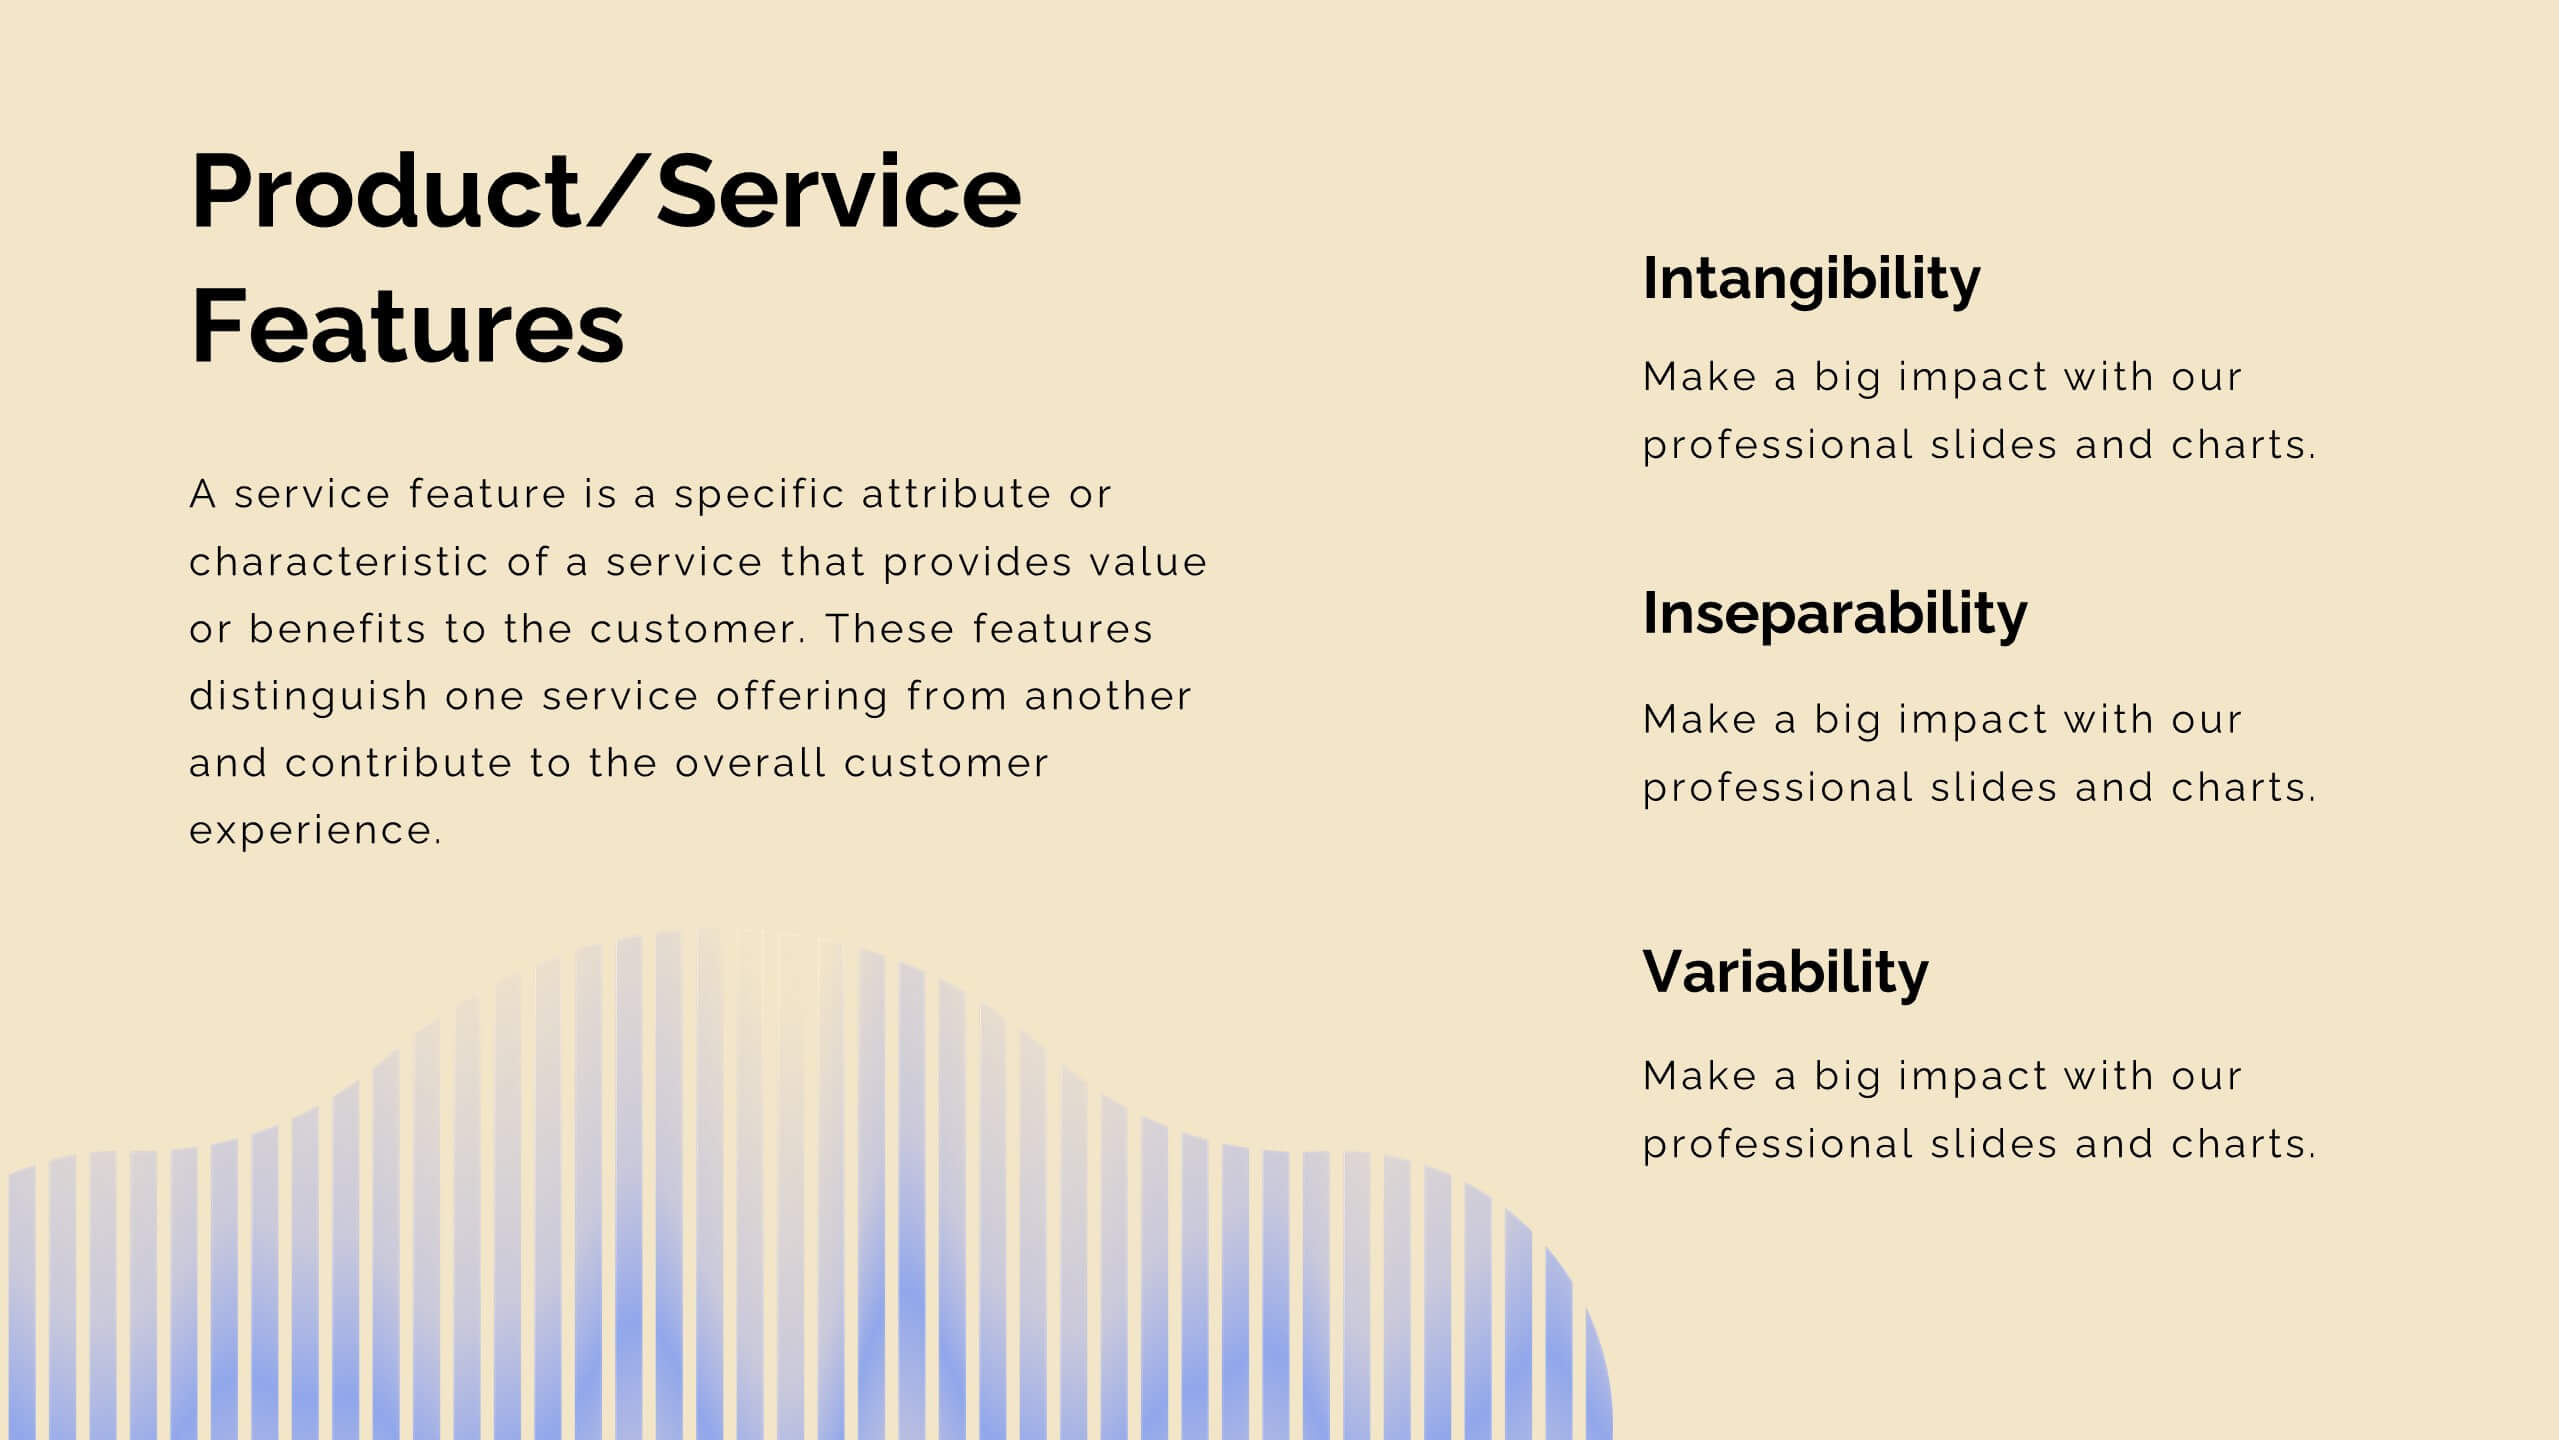
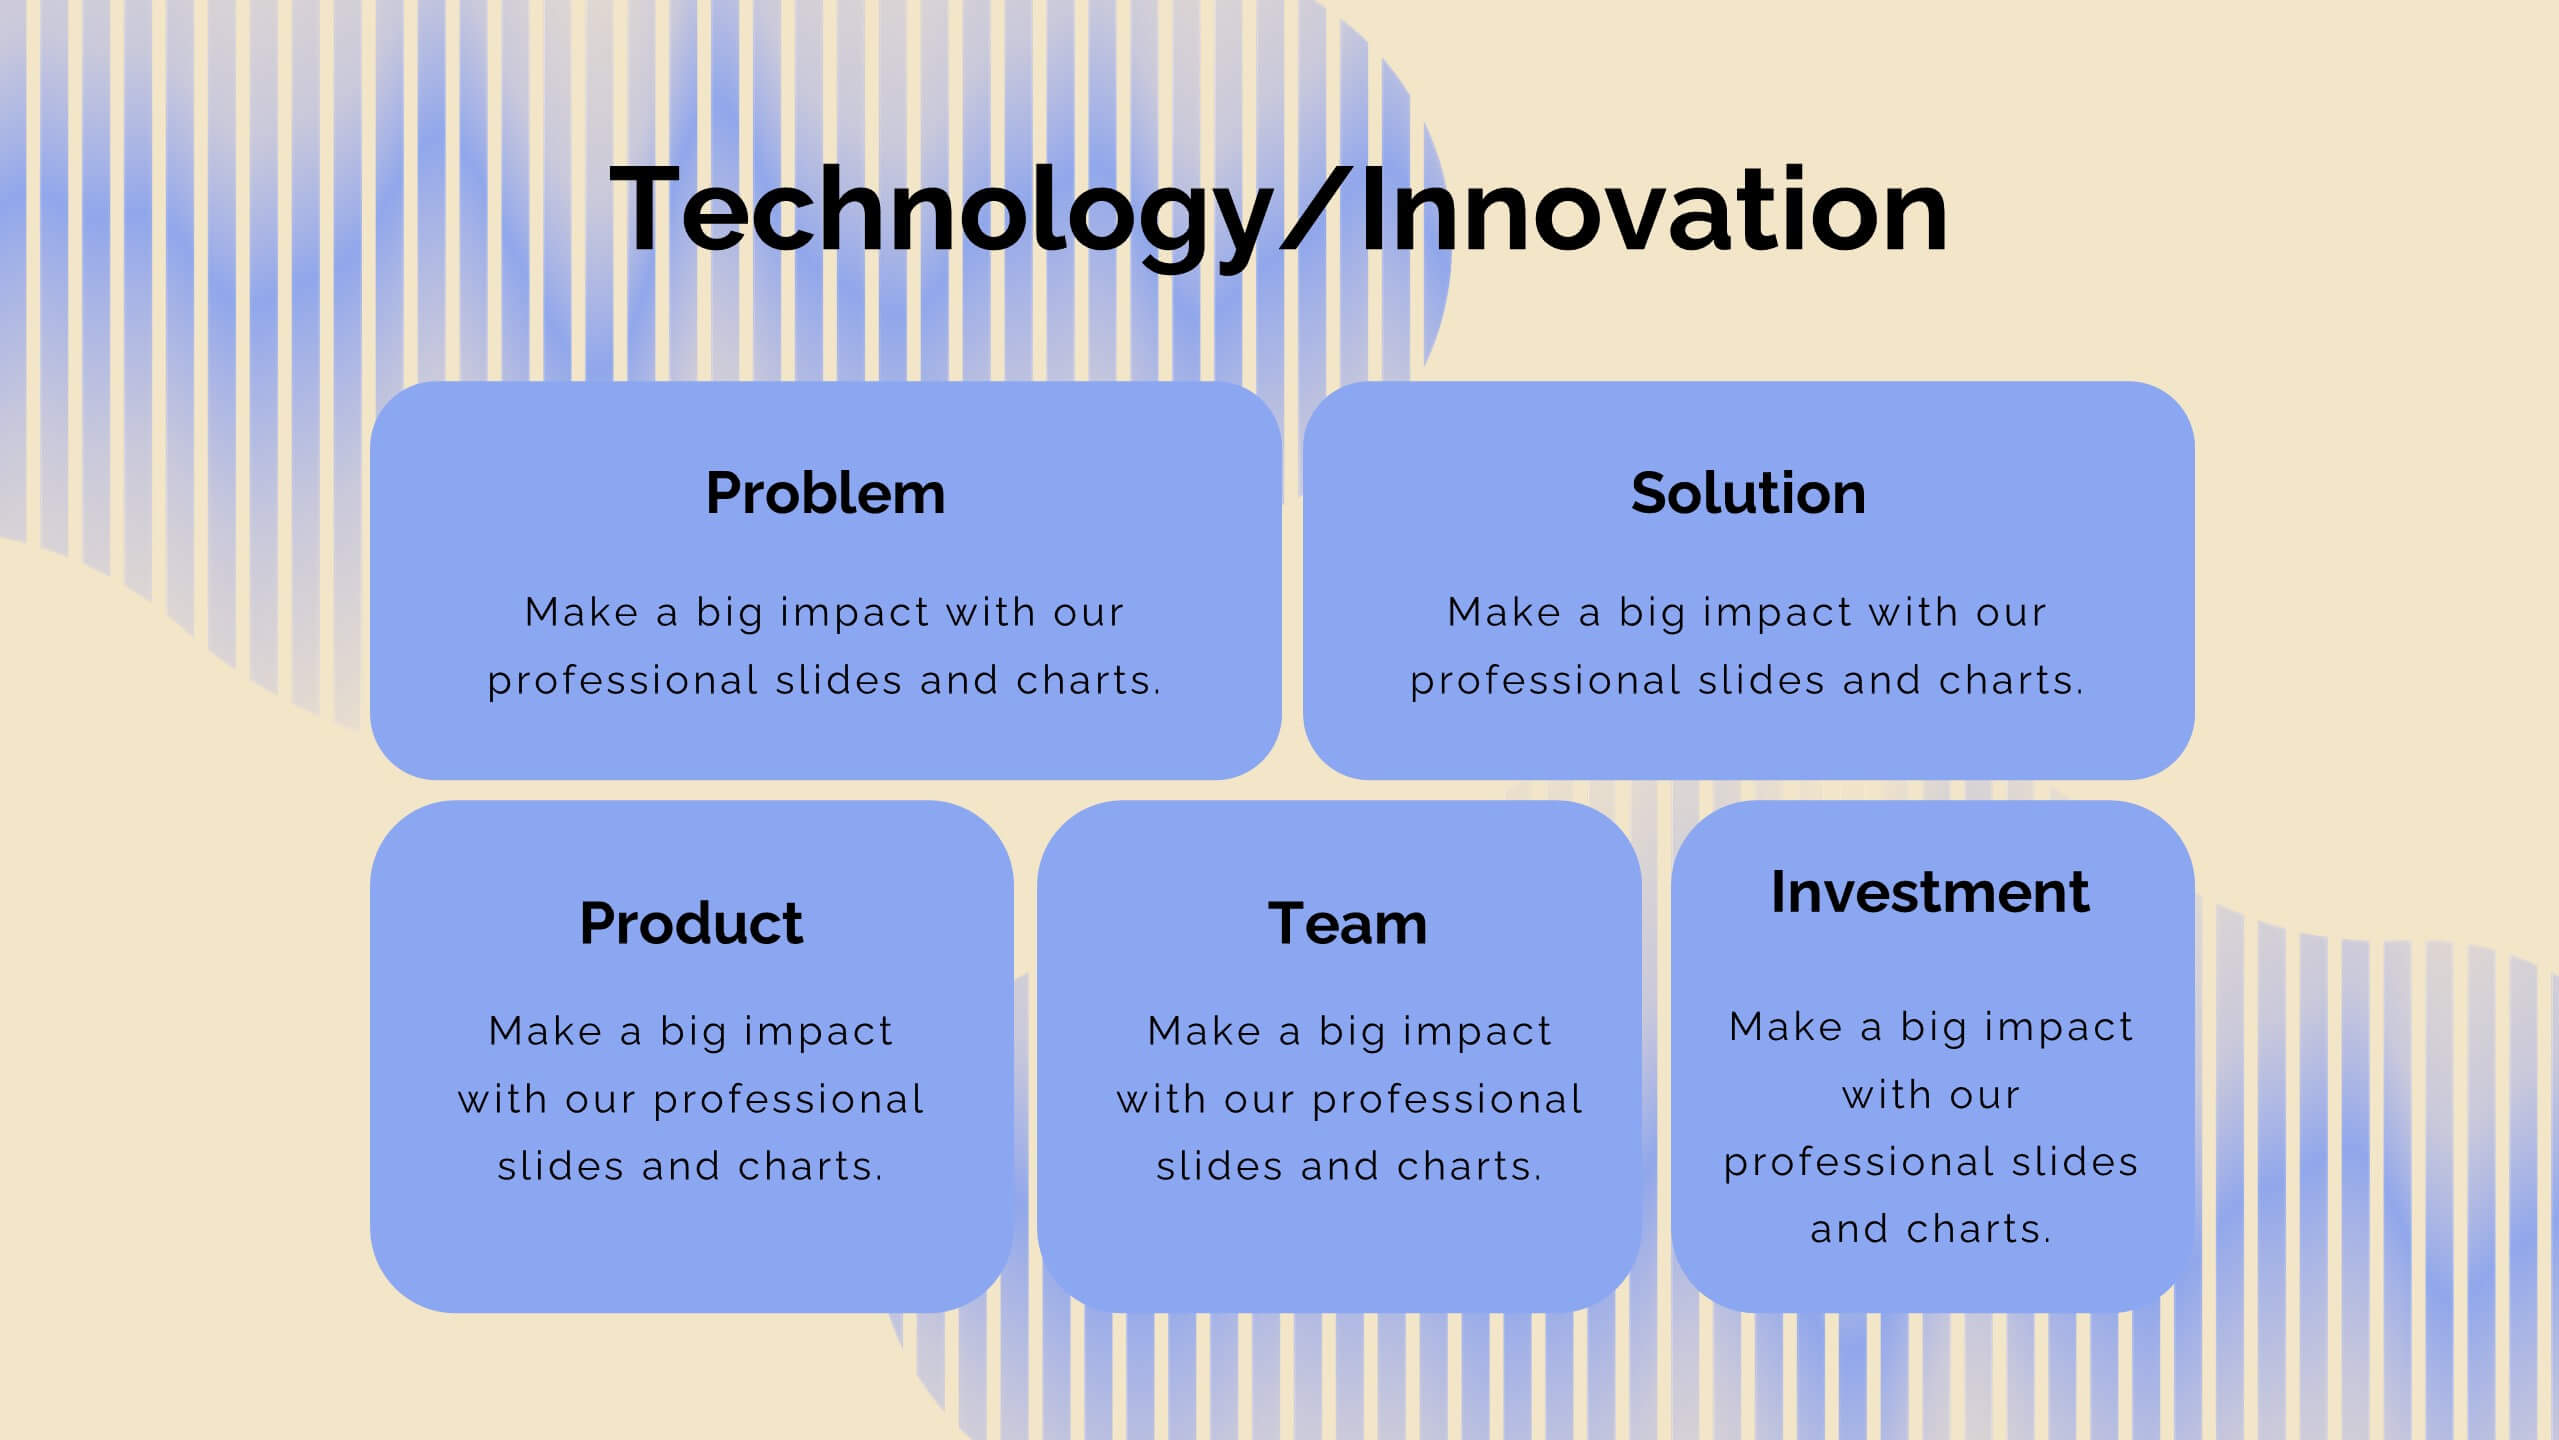
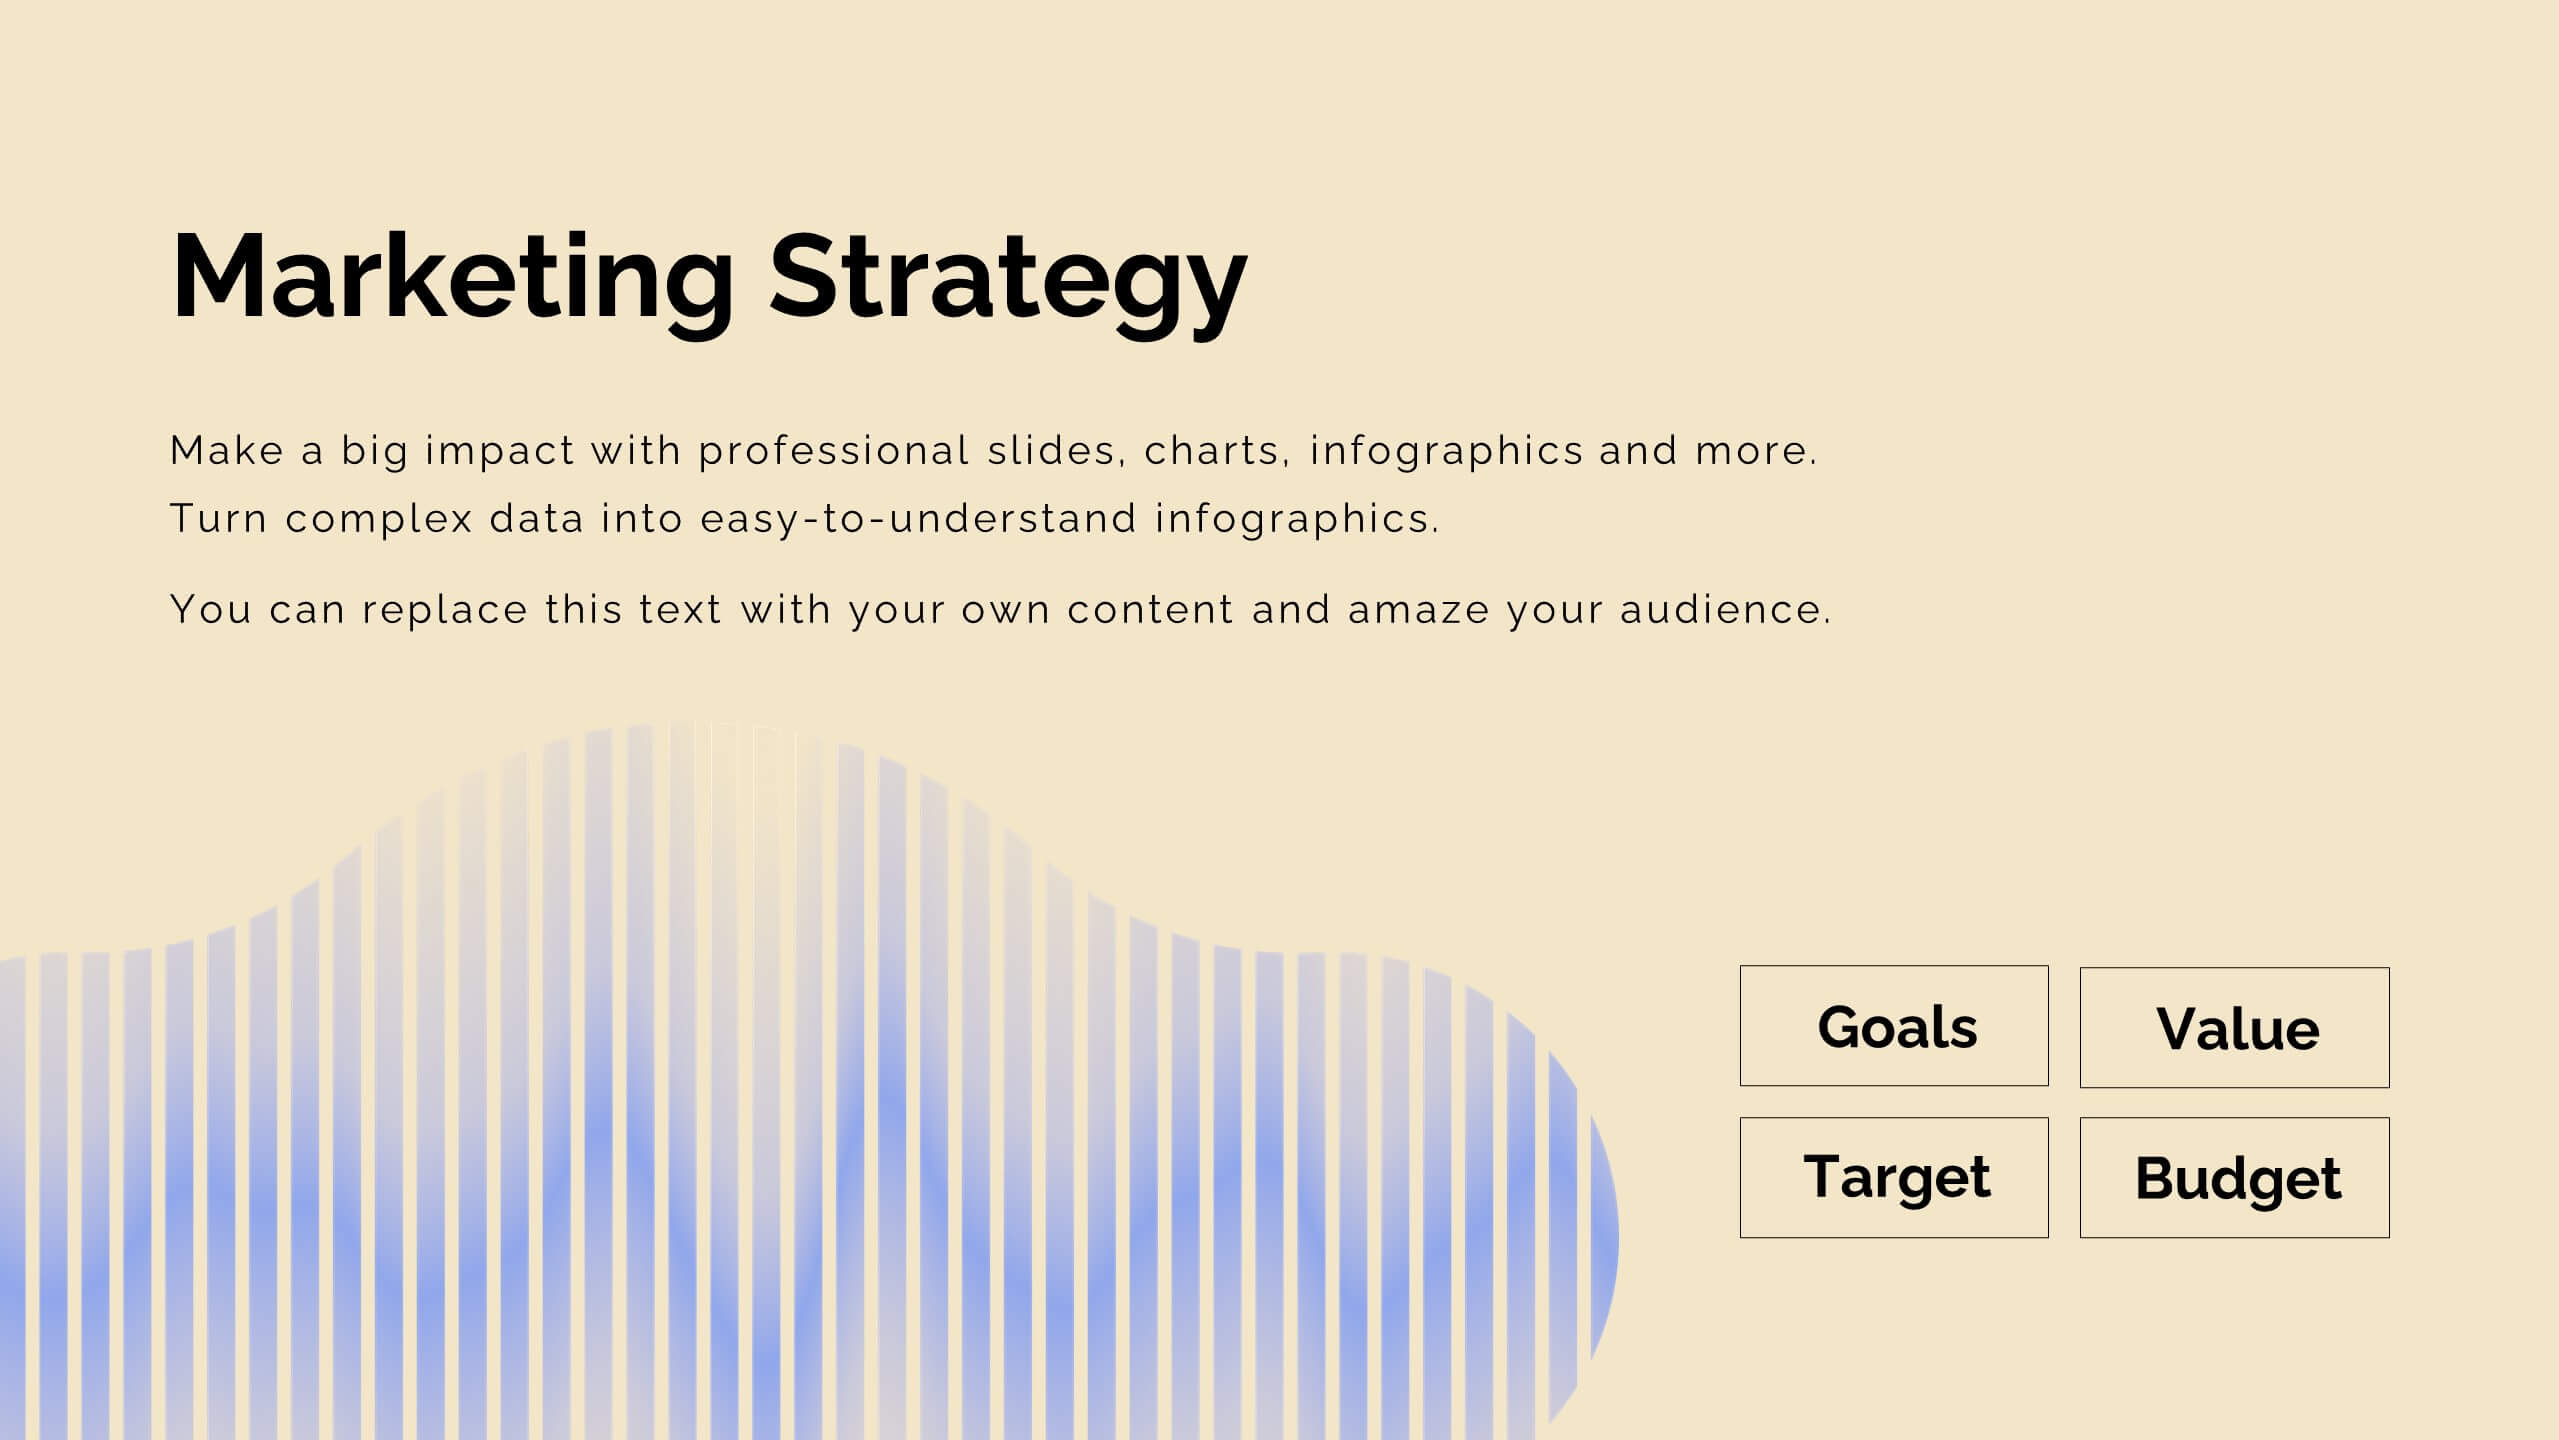
Journey Product Roadmap Presentation
Embark on a seamless journey through your product’s lifecycle with this comprehensive roadmap template! Perfect for illustrating key milestones, business models, and market opportunities, it’s your go-to for clear and engaging presentations. Dive into competitive analysis, showcase your unique selling proposition, and outline your growth projections with style. Compatible with PowerPoint, Keynote, and Google Slides.


12 slides
Quarterly Status Report Presentation
Crafted for clarity and impact, the Quarterly Status Report presentation template efficiently summarizes a period's achievements and insights. The opening slide immediately captivates the audience, clearly setting the stage for a comprehensive review. Subsequent slides meticulously organize critical data points, from financial forecasts to project milestones, allowing for a granular examination of past performance. The report not only reflects on the quarter's outcomes but also offers a well-defined path forward, with strategic recommendations and a thoughtful action plan. Concluding on a note of gratitude, the template acknowledges the audience's time and consideration, while the final credits slide ensures due recognition of all informational sources used throughout the presentation.


26 slides
Melo Presentation Template
Are you looking for a presentation to make your product stand out? Melo is a beautifully elegant presentation with modern elements and light neutral color palette. Perfect for furniture brands, or any one looking for a modern presentation. These slides include world maps, company slides, mockups and charts perfect for businesses, this template has everything you'll need. It's simple yet chic design makes it stand out and at the same time keep your audience engaged. This is the perfect choice for businesses, brands or anyone who needs to make a great looking template on their next presentation


4 slides
Lab Research Data Analysis Layout Presentation
Present your scientific findings with clarity using this Lab Research Data Analysis Layout Template. Featuring molecular, lab flask, and data icons in a connected node design, it's ideal for researchers and analysts. Fully editable in PowerPoint, Keynote, and Google Slides, this clean layout ensures your data is both visual and professional.