


Features
- 21 Unique Slides
- Fully editable and easy to edit in Microsoft Powerpoint, Keynote and Google Slides
- 16:9 widescreen layout
- Clean and professional designs
- Export to JPG, PDF or send by email


Do you have any questions?
Recommend


24 slides
Dreamveil UX Strategy Plan Presentation
Enhance your user experience strategy with this professionally designed UX Strategy Plan presentation. Covering essential topics such as user research, wireframes, prototyping, design principles, and usability guidelines, this deck offers a structured approach to refining your UX/UI processes. With a clean layout and engaging visuals, it’s perfect for teams, stakeholders, and clients looking to improve user interactions and design consistency. Fully customizable in popular formats like PowerPoint, Keynote, and Google Slides.


6 slides
Top Priorities Business List Presentation
Streamline your workflow with this structured priorities list template. Designed for business professionals, it visually organizes key tasks, helping teams focus on top objectives efficiently. With a clean and modern design, it's ideal for strategic planning, productivity tracking, and project management. Fully compatible with PowerPoint, Keynote, and Google Slides.
8 slides
3-Step Arrow Process Flow Presentation
Kickstart your message with a bold, directional visual that makes every step feel clear and intentional. This presentation showcases a simple three-stage progression ideal for explaining workflows, strategies, or business processes with clarity and impact. Easy to customize and fully compatible with PowerPoint, Keynote, and Google Slides.


21 slides
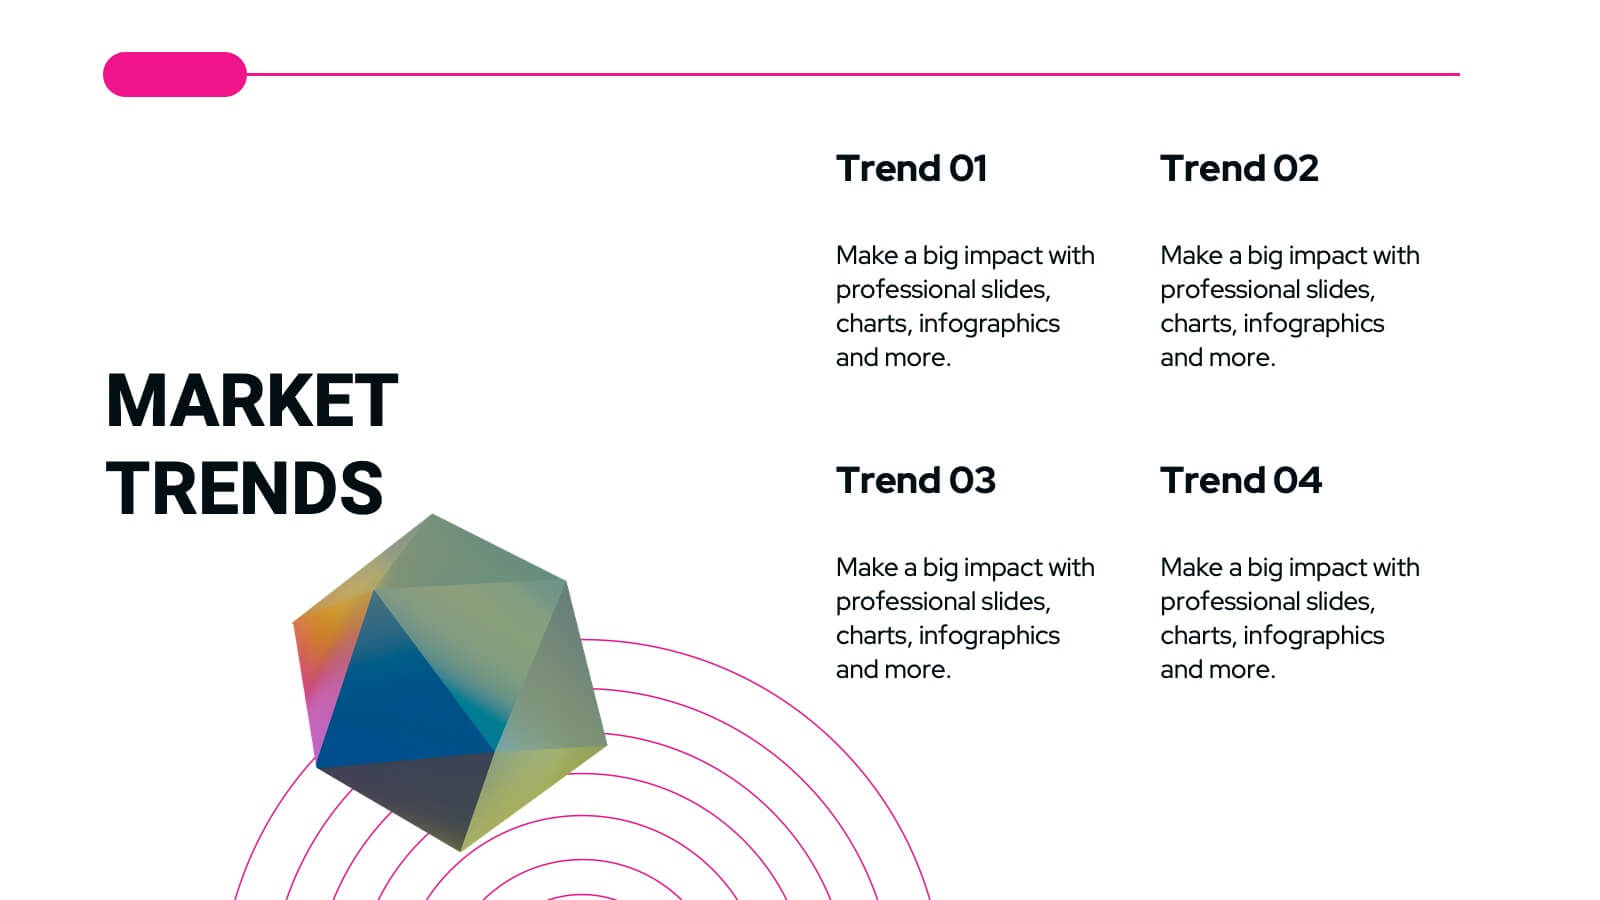
Duskflare Corporate Strategy Proposal Presentation
Present your corporate strategy effectively with this comprehensive template, featuring sections on market trends, SWOT analysis, strategic initiatives, and risk management. Designed for clarity and impact, it’s ideal for outlining high-level goals and action plans. Compatible with PowerPoint, Keynote, and Google Slides for seamless presentations.


7 slides
Cause and Consequence Bowtie Model Presentation
Turn complex risks into clear, visual logic with a balanced, intuitive diagram that connects causes to consequences. This presentation is perfect for showcasing preventive and corrective actions in business or project management. Fully customizable and compatible with PowerPoint, Keynote, and Google Slides for a professional, data-driven approach.


10 slides
Creative Thinking and Innovation
Inspire fresh perspectives and spark ideas with this Creative Thinking and Innovation presentation. Designed around a dynamic lightbulb concept, it features five clearly numbered stages for visualizing brainstorming, concept development, and strategic creativity. Perfect for workshops, ideation sessions, or innovation planning. Fully editable in PowerPoint, Keynote, and Google Slides.


22 slides
Synchrony New Product Proposal Presentation
Present your innovative ideas effectively with this sleek and organized product proposal template, tailored to showcase every aspect of your new product. From introduction to execution, this template covers every detail, ensuring your proposal is both comprehensive and visually appealing. Key features include slides for product overview, features, target audience analysis, and customer pain points. Additionally, it provides sections for competitive analysis, pricing strategy, and distribution channels, equipping you with all the tools to communicate your value proposition clearly. Technical specifications and production processes are also included, perfect for presenting intricate details. Compatible with PowerPoint, Google Slides, and Keynote, this template is fully customizable to align with your brand’s aesthetics. Whether pitching to stakeholders, potential investors, or internal teams, this presentation ensures your proposal is structured, impactful, and engaging. Save time and leave a lasting impression with this professional design, suitable for any new product launch.


23 slides
Pyroverse Photography Portfolio Presentation
Showcase your creative work effortlessly with this meticulously designed photography portfolio template. Tailored for photographers, this presentation highlights your style, achievements, and projects in a visually compelling format that speaks to your audience. This portfolio template includes dedicated slides for introducing your philosophy, showcasing your creative process, and presenting your best projects with high-impact layouts. Highlight client testimonials, collaborations, and awards to establish credibility and attract new clients. Additional slides for services, contact information, and social media links make it easier to connect with your audience. Compatible with PowerPoint, Google Slides, and Keynote, this template is fully customizable, allowing you to tailor it to your branding needs. Perfect for professional photographers, freelancers, and studios, this template ensures your portfolio stands out in a competitive market. Present your work with confidence and make a lasting impression with this professional design.


8 slides
Team Statistics and Rankings Presentation
Showcase match performance, rankings, and team metrics with this Team Statistics and Rankings Presentation. Visualize key game stats using editable diagrams, heatmaps, and comparison scores. Perfect for sports analysts, coaches, or recap slides. Compatible with PowerPoint, Keynote, and Google Slides—fully customizable for your team’s specific data and branding needs.


12 slides
Tourism Trends and Destination Analytics Presentation
Visualize travel patterns and insights effortlessly with this Tourism Trends and Destination Analytics Presentation. Featuring a suitcase-themed layout with icon blocks, this template is ideal for travel analysts, tourism boards, and destination marketers. Use it to highlight travel behaviors, key locations, or seasonal preferences. Fully customizable in PowerPoint, Keynote, and Google Slides.


6 slides
Successful Loyalty Program Ideas Presentation
Turn creative reward concepts into visually engaging stories that inspire customer retention and brand loyalty. This modern layout is ideal for presenting program ideas, reward systems, and engagement strategies with clarity and style. Fully customizable and compatible with PowerPoint, Keynote, and Google Slides for seamless presentation design.


23 slides
Ignifis Investor Pitch Presentation
Capture investor interest with this dynamic and professional pitch deck presentation template. It includes essential slides such as company overview, problem statement, revenue model, competitive landscape, financials, and growth projections. Designed for clarity and impact, it's fully customizable and perfect for securing funding. Compatible with PowerPoint, Keynote, and Google Slides.


20 slides
Fluxion Product Launch Pitch Deck Presentation
Launch your next big idea with this sleek and impactful pitch deck! Featuring sections like market opportunities, business model, revenue streams, and team introductions, it ensures a persuasive narrative for investors. Perfect for startup launches or product pitches, this deck works seamlessly with PowerPoint, Keynote, and Google Slides.


4 slides
Professional Team Profiles and Roles Presentation
Showcase your team with impact using the Professional Team Profiles and Roles Presentation. Ideal for company introductions, this slide highlights key members with photo, name, title, and a brief role description. Clean, modern layout makes it easy to customize in PowerPoint, Canva, or Google Slides to match your brand.


21 slides
Moonshade Strategic Planning Report Presentation
This strategic planning template provides a comprehensive framework to align your business objectives with actionable plans. With sections for SWOT analysis, resource allocation, key metrics, and growth opportunities, it ensures that every element is covered for successful execution. Customizable in PowerPoint, Keynote, and Google Slides, it's perfect for building focused, strategic initiatives.


5 slides
Strategic Decision-Making Techniques Presentation
Communicate key business insights with clarity using this structured four-step layout. Each segment is aligned with an icon and space for concise text, making it ideal for presenting executive strategies, project evaluations, or decision pathways. The centered character adds a professional and engaging touch. Fully customizable in PowerPoint, Keynote, and Google Slides.


6 slides
Customer Loyalty Rewards Structure Presentation
Illustrate your brand’s customer retention strategy with the Customer Loyalty Rewards Structure presentation. This visually engaging template highlights reward tiers, perks, and loyalty card systems—perfect for showcasing how customers earn incentives over time. Ideal for marketing teams, retail businesses, and loyalty program proposals. Fully editable in PowerPoint, Keynote, and Google Slides.