


Features
- 5 Unique slides
- Fully editable and easy to edit in Microsoft Powerpoint, Keynote and Google Slides
- 16:9 widescreen layout
- Clean and professional designs
- Export to JPG, PDF or send by email


Do you have any questions?
Recommend


7 slides
Goals Infographic Presentation Template
A goals infographic is a set of goals, objectives, or plans, often used for personal or organizational planning and development. This template allows you to include information about your specific goals, the steps required to achieve them, the timeline for completion, and any relevant metrics or targets. The purpose of our goals infographic is to help you provide a clear and concise overview of what is to be accomplished, and help you keep focus on achieving those goals. This well-designed infographic can help you prioritize and track progress, and can serve as a visual reminder.


23 slides
Quest Corporate Strategy Proposal Presentation
Unlock success with this powerful corporate strategy template! Detail strategic objectives, market trends, and growth opportunities. Ideal for business leaders aiming to drive growth. Compatible with PowerPoint, Keynote, and Google Slides, this template ensures your strategy is clear, professional, and compelling. Make your vision a reality with impactful presentations.


8 slides
Hierarchical Structure Tree Diagram
Simplify the visualization of your team's hierarchy or process flow with this clean and modern tree diagram template. Perfect for organizational charts, project teams, or strategy frameworks. Easily editable in PowerPoint, Keynote, and Google Slides for full flexibility.


6 slides
Logistic Growth Infographics
Explore the concept of Logistic Growth with our customizable infographic template. This template is fully compatible with popular presentation software like PowerPoint, Keynote, and Google Slides, allowing you to easily customize it to illustrate and communicate the key principles of logistic growth. The Logistic Growth infographic template offers a visually engaging platform to explain the concept of population growth, including the phases of exponential growth and leveling off. Whether you're a student, educator, or researcher, this template provides a user-friendly canvas to create informative presentations and educational materials on logistic growth. Deepen your understanding of Logistic Growth with this SEO-optimized infographic template, thoughtfully designed for clarity and ease of use. Customize it to showcase the growth curve, carrying capacity, and factors affecting population dynamics, ensuring that your audience gains a comprehensive grasp of this important ecological concept. Start crafting your personalized infographic today to explore the dynamics of Logistic Growth.


4 slides
3-Step Supply Chain and Logistics Planning Presentation
Bring your workflow to life with a clean three-stage visual that makes your process feel fast, simple, and smart. This slide helps explain planning steps, logistics timelines, and supply chain actions in a way that’s easy for any audience to follow. Fully compatible with PowerPoint, Keynote, and Google Slides.


7 slides
Performance Improvement Infographics
A Performance Improvement infographic is a visual representation of the key elements of a plan to enhance the performance of an individual, team, or organization. The purpose of this template is to communicate the plan's objectives, strategies, and metrics in an informative and engaging way. This infographic contains graphs, and diagrams to illustrate key performance indicators and other measures of success. This performance template can help motivate and engage stakeholders, highlight the benefits of performance improvement, and facilitate communication and collaboration among team members.


6 slides
Creative 3D Elements Slide Presentation
Take your slides from flat to fantastic with this playful 3D layered design! This infographic template is perfect for visualizing multi-step processes, product stacks, or layered strategies in a modern and creative way. It’s fully editable and easy to customize in PowerPoint, Keynote, and Google Slides for any presentation need.


6 slides
Modern Treatment Plans in Medicine Presentation
Highlight six key elements of your healthcare strategy with the Modern Treatment Plans in Medicine Presentation. This clean, grid-style layout uses pill-shaped icons and vibrant colors to present treatments, initiatives, or categories. Ideal for breaking down complex medical plans. Fully customizable in Canva, PowerPoint, Keynote, and Google Slides.


5 slides
Creative Alphabet Infographic Presentation
Make learning and presentations more engaging with this Creative Alphabet Infographic Presentation template. Featuring bold, letter-based visual elements resembling pencils, this slide is perfect for educational content, branding, or step-by-step processes. Fully editable and compatible with PowerPoint, Keynote, and Google Slides.


5 slides
K–12 School Planning and Curriculum Map Presentation
Visualize your school year with the K–12 School Planning and Curriculum Map Presentation. Designed for academic teams and administrators, this circular diagram helps outline yearly goals, subject milestones, or grade-level plans in five clear segments. Fully editable in PowerPoint, Keynote, Google Slides, and Canva for total customization.


5 slides
Cybersecurity Protocols and Threat Response Presentation
Visualize your security framework with the Cybersecurity Protocols and Threat Response presentation slide. Featuring a central lock icon surrounded by four quadrant-based callouts and symbolic icons (e.g., fingerprint, shield, malware), it’s ideal for outlining access controls, incident response, and threat monitoring strategies. Fully editable in PowerPoint, Keynote, and Google Slides.


22 slides
Dakota Corporate Strategy Agenda Presentation
Maximize your strategic sessions with this dynamic corporate strategy agenda presentation template. This template is designed to streamline your business discussions, featuring sections for everything from speaker introductions to session overviews and networking breaks. It’s ideal for conferences, workshops, or any corporate gatherings where a clear, structured schedule is essential. Compatible with major platforms like PowerPoint, Google Slides, and Keynote, it ensures you can organize and execute your agenda efficiently, fostering effective communication and collaboration across your team.


6 slides
Pillar Ideas Infographic
"Pillar ideas" usually refer to the fundamental principles, concepts, or key components that form the foundation of a particular topic, strategy, or framework. This infographic template outlines and explains the core pillars or key principles of a particular topic, concept, or strategy. These pillars are essential for understanding and implementing the core aspects of that subject. The pillars included in the infographic provide structure and a clear understanding of the foundational elements that contribute to the success and effectiveness of various endeavors. This template is compatible with Powerpoint, Keynote, and Google Slides.


7 slides
Creative Timeline Infographic Presentation Template
A Timeline is an essential tool to illustrate the chronology of events; it also provides a method for organizing and summarizing material. With the timelines provided in this template you will be able to visualize the passage of time, so that you can better understand how influences from the past still impact your life today. This template is designed to assist you with crafting your timeline so that it can be easily understood. The color-coding makes it easy to see daily progress. Use the timelines in this template to create useful visualization, and convey the growth of your business or brand.


26 slides
Natlea Presentation Template
Need help presenting your next travel destination? This template is a unique and sophisticated way to present your travel destination. The Natlea travel template is a fun, surprisingly sophisticated and easy to use template that allows you to list all the details of your trip. With bold colors, charts, budget slides and venn diagrams this template has it all. It's simple yet fun design makes it stand out and at the same time keep your audience engaged. This is the perfect choice for marketers, tourism professionals or anyone who needs to make a great looking presentation on their next trip.
22 slides
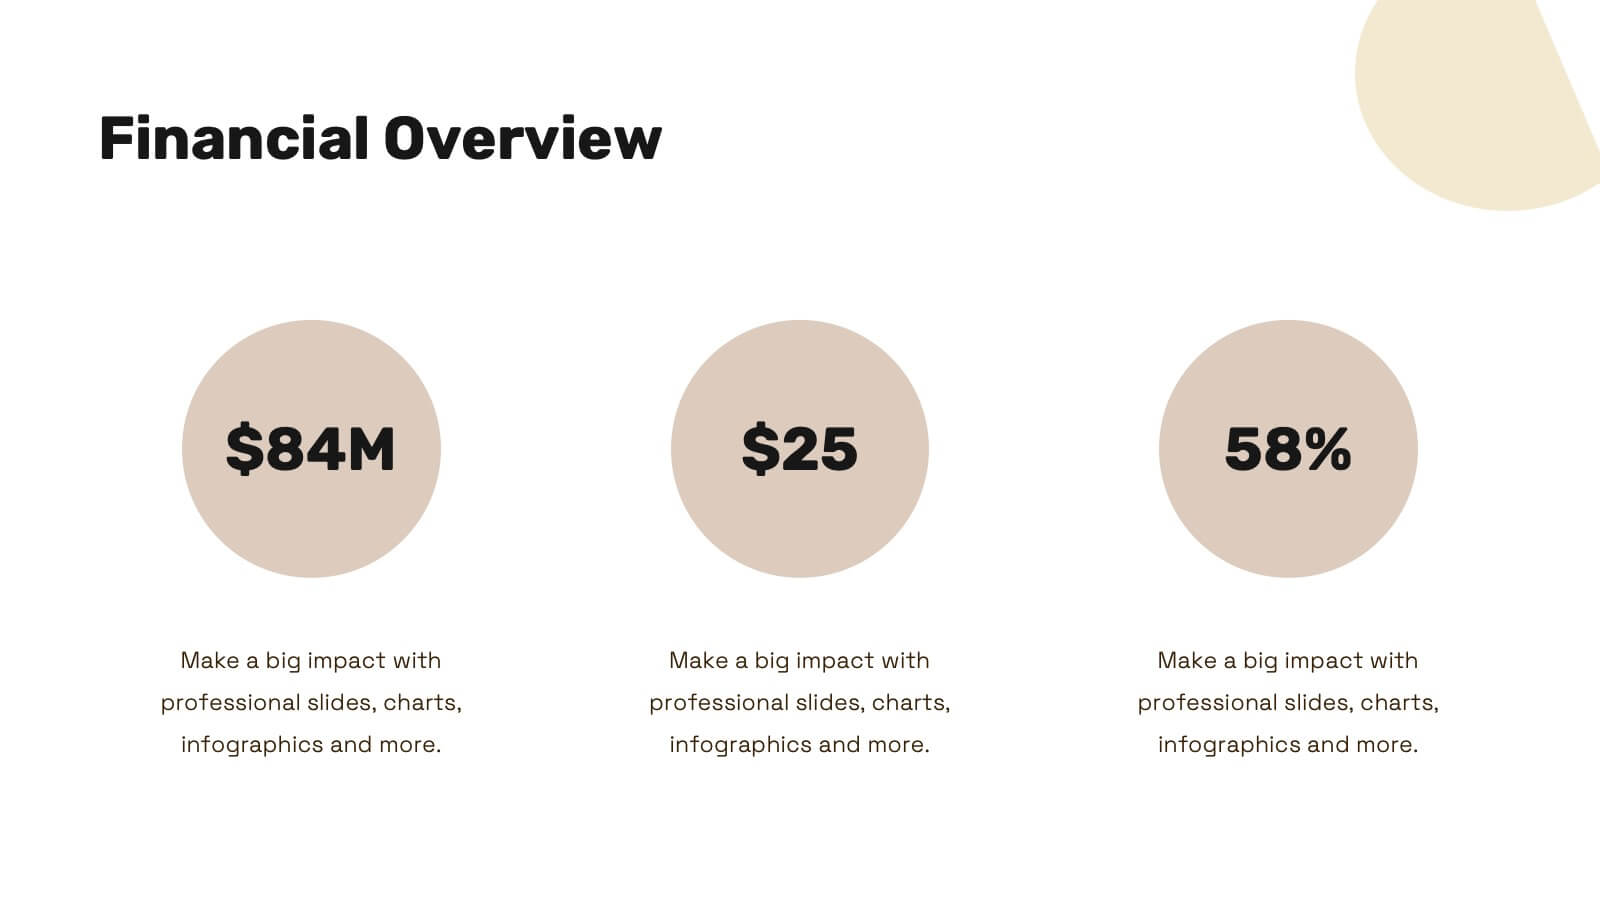
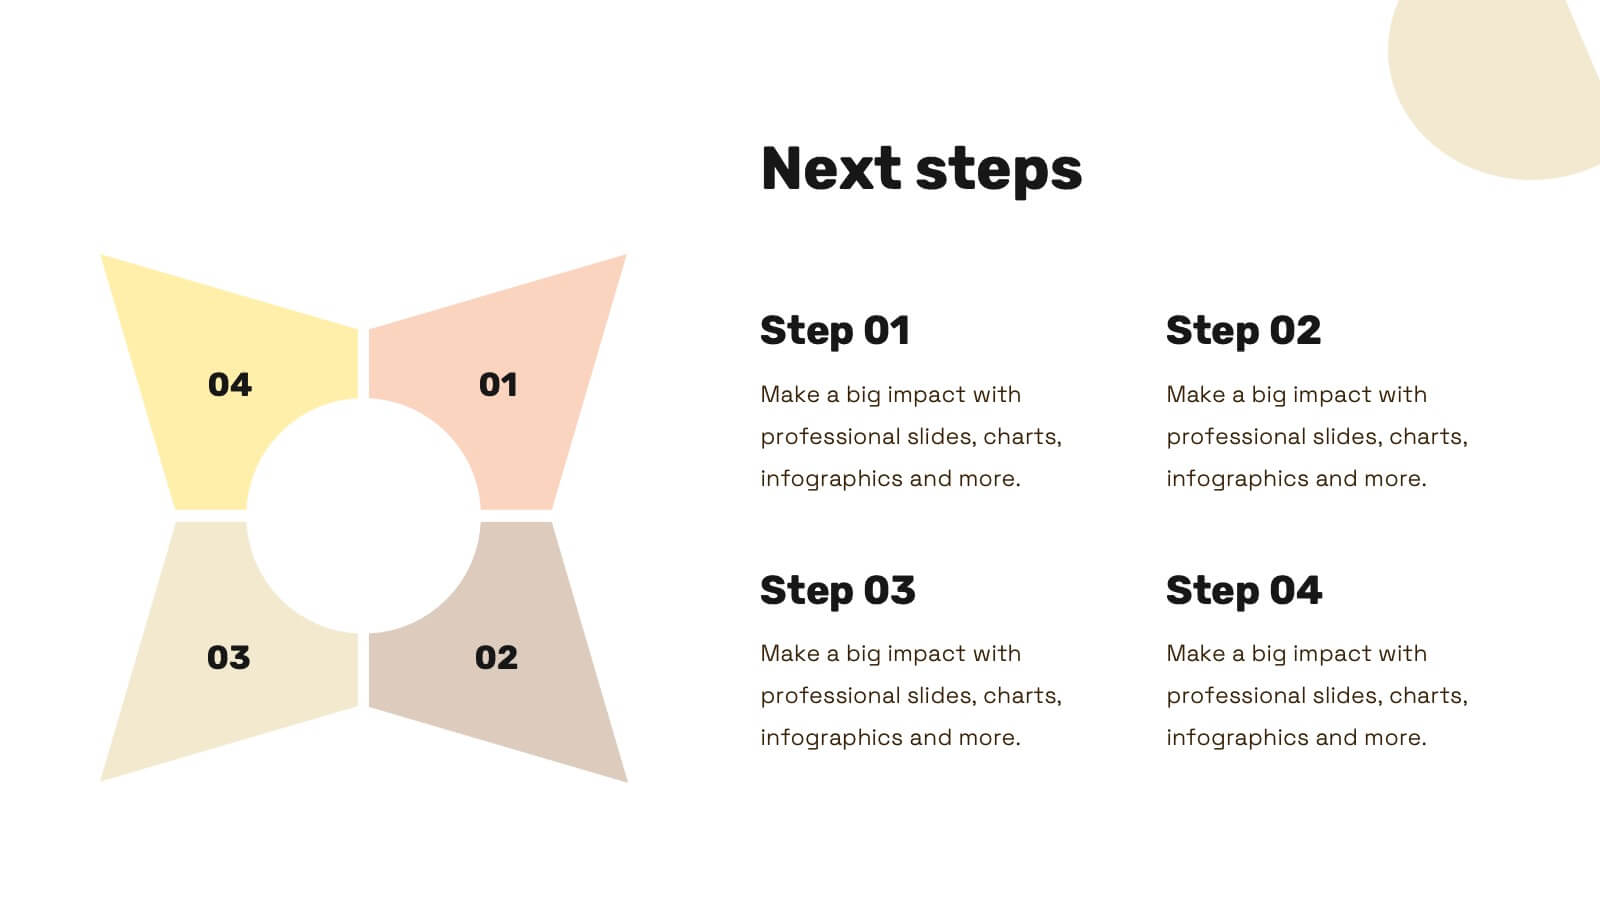
Nova Startup Funding Proposal Presentation
Craft an impressive startup funding proposal with this elegant template. It includes sections for mission, vision, market analysis, business model, and financial overview. Ideal for clear and professional presentations. Fully compatible with PowerPoint, Keynote, and Google Slides for easy customization.


5 slides
Performance Progress and Achievements Presentation
Showcase your team’s accomplishments and growth over time with this visually engaging bar chart layout. Each performance level is color-coded for clarity and paired with space for concise descriptions. Ideal for reporting KPIs, quarterly wins, or business milestones. Fully customizable in PowerPoint, Keynote, and Google Slides.