


Features
- 5 Unique slides
- Fully editable and easy to edit in Microsoft Powerpoint, Keynote and Google Slides
- 16:9 widescreen layout
- Clean and professional designs
- Export to JPG, PDF or send by email


Do you have any questions?
Recommend


5 slides
Live Sports Infographics
Immerse in the dynamic realm of athletics with our live sports infographics. Crafted in a medley of energetic blue, spirited yellow, and various vivid hues, this template radiates the inherent in the world of sports. Its creative and vertical layout, optimized for impact, is perfect for sports journalists. Compatible with Powerpoint, Keynote, and Google Slides. The compelling graphics, icons, and dedicated image placeholders are specifically tailored to encapsulate the pulse-pounding moments and diverse statistics of live sports events. This visually striking, data-centric tool is indispensable for those seeking to convey complex sports information.


4 slides
Strategic SWOT Matrix Overview Presentation
Present your strategic insights with clarity using the Strategic SWOT Matrix Overview Presentation. This modern slide layout features a sleek horizontal design that separates Strengths, Weaknesses, Opportunities, and Threats into visually distinct segments. Ideal for business planning, strategy reviews, or team discussions. Fully editable in PowerPoint, Canva, and Google Slides.


6 slides
Search Engine Optimization Campaign Overview Presentation
Kick off your digital strategy with a clean, modern layout that makes every key insight feel connected and actionable. This presentation helps you explain campaign goals, highlight SEO priorities, and break down essential tasks in a structured, visual flow. Fully compatible with PowerPoint, Keynote, and Google Slides.


5 slides
Product Development and Innovation Presentation
Showcase your Product Development and Innovation process with this structured and visually appealing infographic. Designed with interconnected gears and a step-by-step approach, this template is ideal for illustrating stages of product design, research, and launch. Fully customizable and compatible with PowerPoint, Keynote, and Google Slides.


5 slides
Business Growths Strategy Presentation
Grow your ideas with a dynamic visual layout that makes every milestone feel achievable and clear. This presentation helps you explain key stages, strategic actions, and long-term growth goals with confidence and simplicity. Fully customizable and compatible with PowerPoint, Keynote, and Google Slides.


7 slides
Company Title Infographic
This collection of slides is designed to vividly present company profiles and services, utilizing a dynamic color palette of blue, yellow, and white to create an engaging viewer experience. Each slide is meticulously crafted to cater to specific content, enhancing the presentation's overall effectiveness and appeal. Starting with the "Empathy Map" slide, it offers a detailed insight into customer perceptions and experiences, essential for tailoring services to meet client needs. The "SEO Report" slide focuses on showcasing quantifiable data, critical for evaluating marketing success. A dedicated "Portfolio" slide highlights past achievements, pivotal for attracting potential clients and investors by demonstrating proven capability and success. Further slides like "What We Do" and "Objectives" provide clear, straightforward layouts that detail the company’s primary activities and strategic goals, respectively. The "Projects" slide offers a glimpse into current and prospective projects, illustrating ongoing development and future aspirations. Ideal for stakeholder briefings, marketing pitches, or internal reviews, these templates support companies in communicating a cohesive and comprehensive narrative of their operational scope and strategic direction.


21 slides
Manticore Financial Report Presentation
This financial report template features a sleek, modern design for presenting key highlights, performance metrics, and financial summaries. It includes sections for market trends, competitor insights, and strategic initiatives. Fully customizable and compatible with PowerPoint, Keynote, and Google Slides, it's perfect for delivering impactful financial presentations with clarity and style.


12 slides
6-Step Timeline Presentation
Visualize milestones effortlessly with this 6-Step Timeline template. Ideal for project planning, business strategies, and process tracking, this fully customizable timeline offers a clear, structured layout. Easily adjust text, colors, and elements to match your branding. Compatible with PowerPoint, Keynote, and Google Slides for seamless integration.


7 slides
Frequently Asked Question (FAQ) Guide Infographic
Unravel the art of answers with our "FAQ Guide" Infographic Template—your next step in revolutionizing how you communicate with curious customers. With its bold, eye-catching design, this template turns the routine task of answering questions into an engaging experience. Dive into a layout that blends vibrant visuals and crisp, clear typography to ensure your answers not only catch the eye but also stick in the mind. Whether you're in tech, retail, or any service-oriented industry, our template flexes to fit your brand’s unique flair. Customize with your colors, integrate your style, and transform your customer service into an impressive visual journey. Perfect for websites, marketing materials, or quick training sessions, this template makes information fun and accessible. Equip your team with the tools to engage, enlighten, and excite with every FAQ presented. Compatible with all leading graphic design software, it's ready to go whenever you are.


7 slides
Ecology Restoration Infographic
Dive into the world of eco-conscious solutions with our ecology restoration infographic. Adorned in soothing shades of white and fresh green, this template captures the essence of nature's rejuvenation. Compatible with Powerpoint, Keynote, and Google Slides, it boasts meticulously crafted graphics, intuitive icons, and user-friendly image placeholders, all tailored to emphasize the urgency and methods of restoring our planet's ecological balance. Ideal for environmentalists, educators, NGOs, or anyone aiming to spread awareness about our planet's well-being.


4 slides
Business Development Roadmap Presentation
Visualize your growth journey with this Business Development Roadmap Presentation. Featuring a winding road design with four milestones, it’s perfect for showcasing project phases, strategic goals, or quarterly plans. Each checkpoint is color-coded and icon-based for easy comprehension. Fully editable in PowerPoint, Keynote, and Google Slides.


10 slides
Brainstorming and Creative Idea Generation Presentation
Unlock Brainstorming and Creative Idea Generation with this visually engaging template designed to help teams capture, refine, and present ideas effectively. Featuring gear-themed graphics, color-coded sections, and structured placeholders, this template is ideal for workshops, innovation meetings, and design thinking sessions. Fully customizable and compatible with PowerPoint, Keynote, and Google Slides, ensuring seamless integration into your workflow.


20 slides
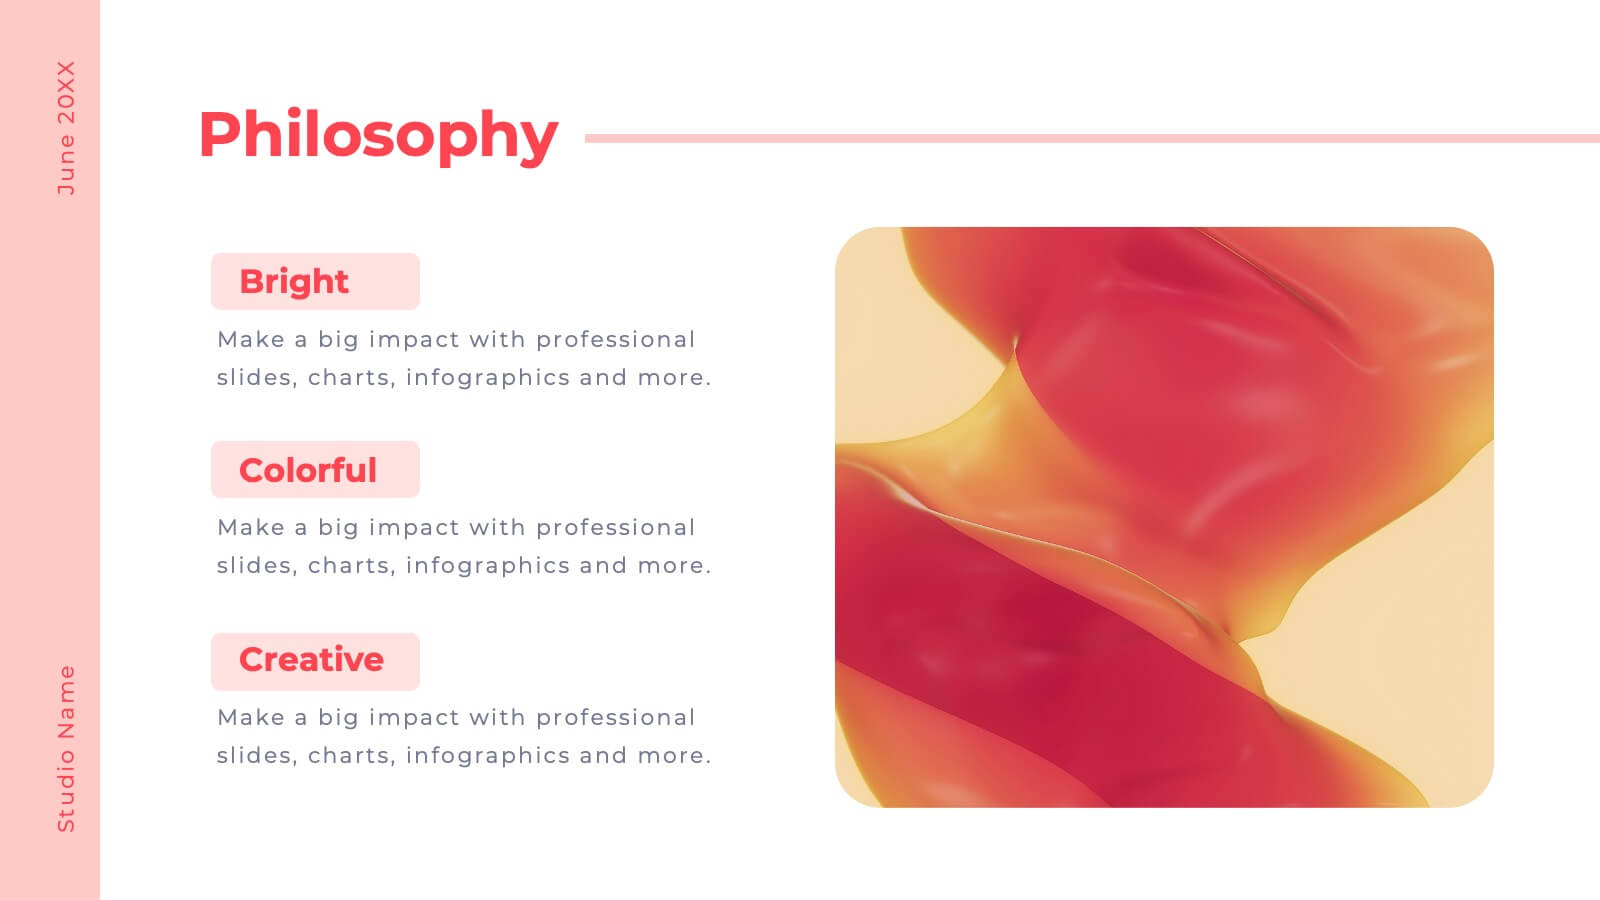
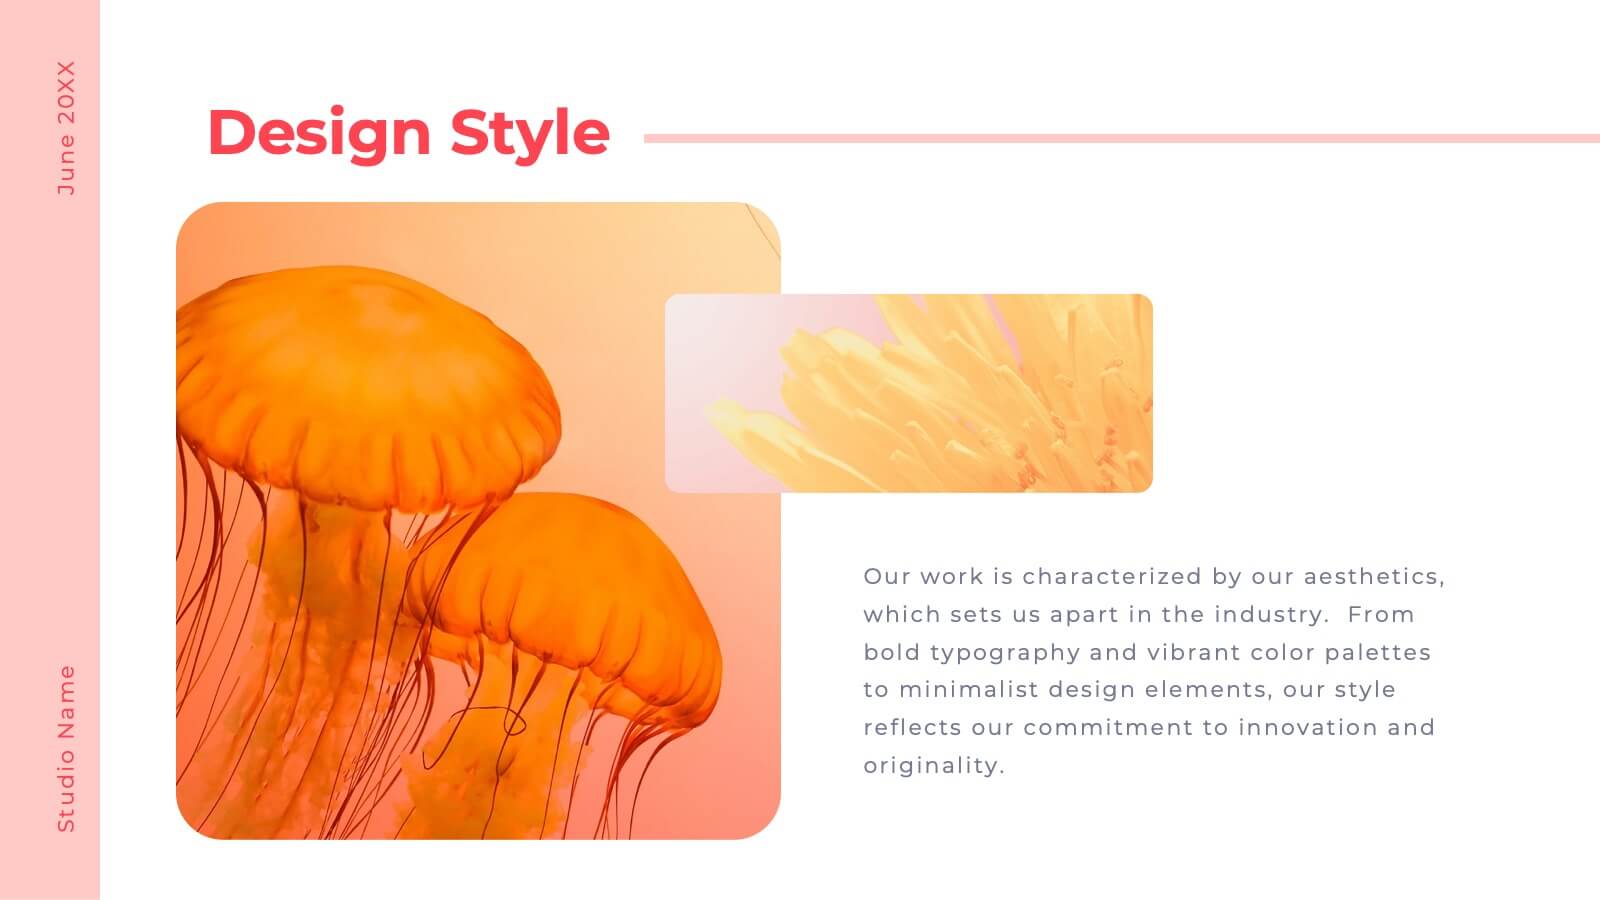
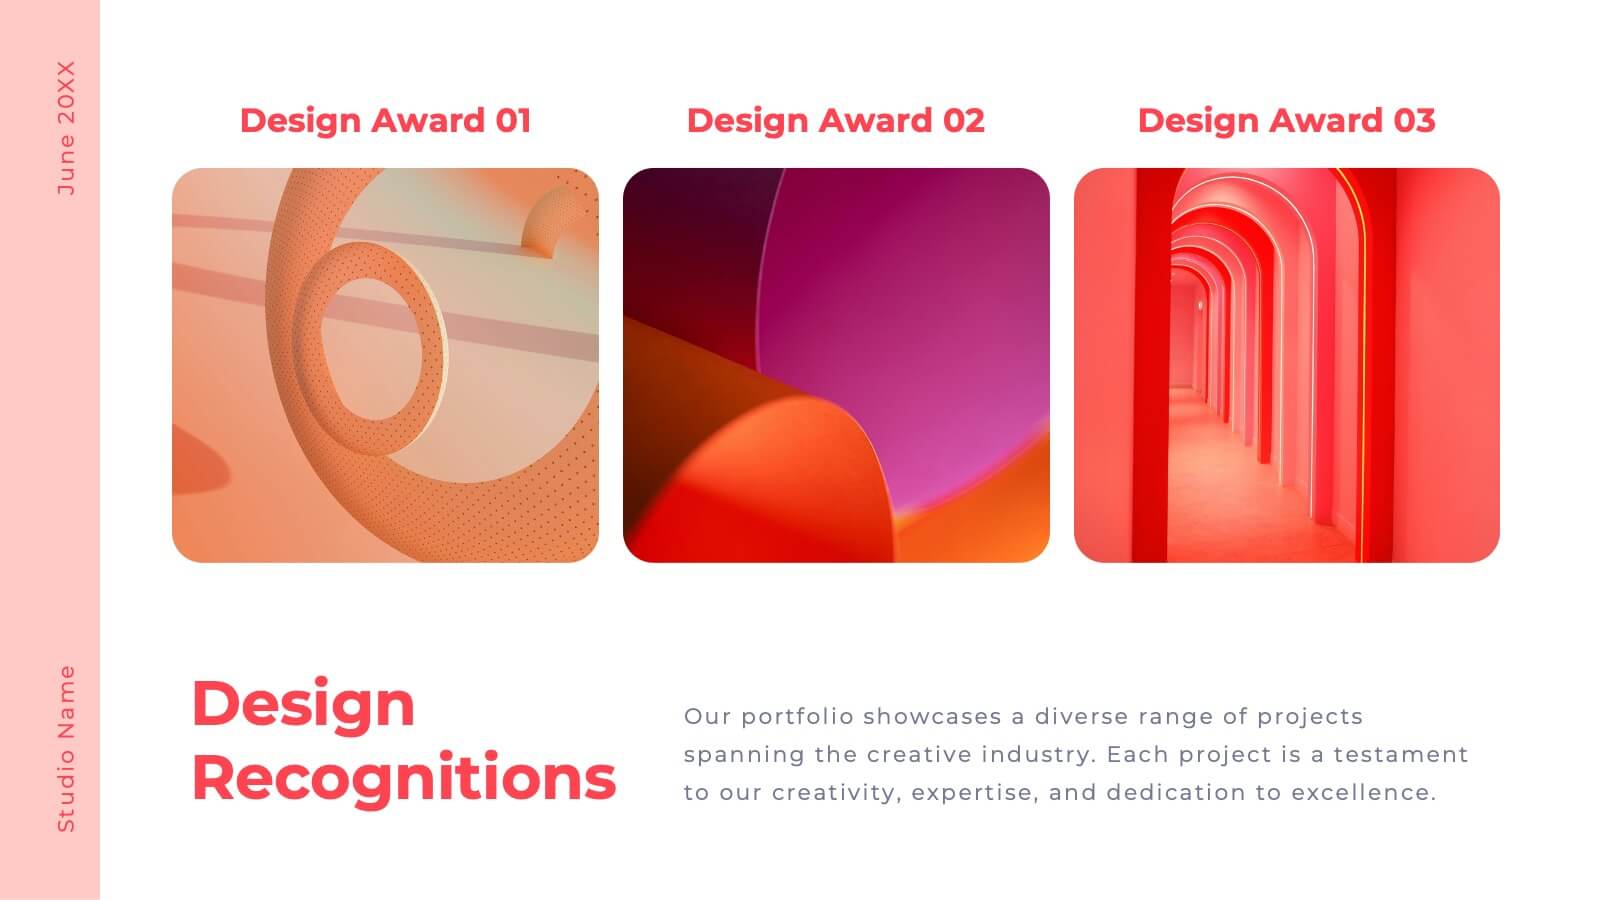
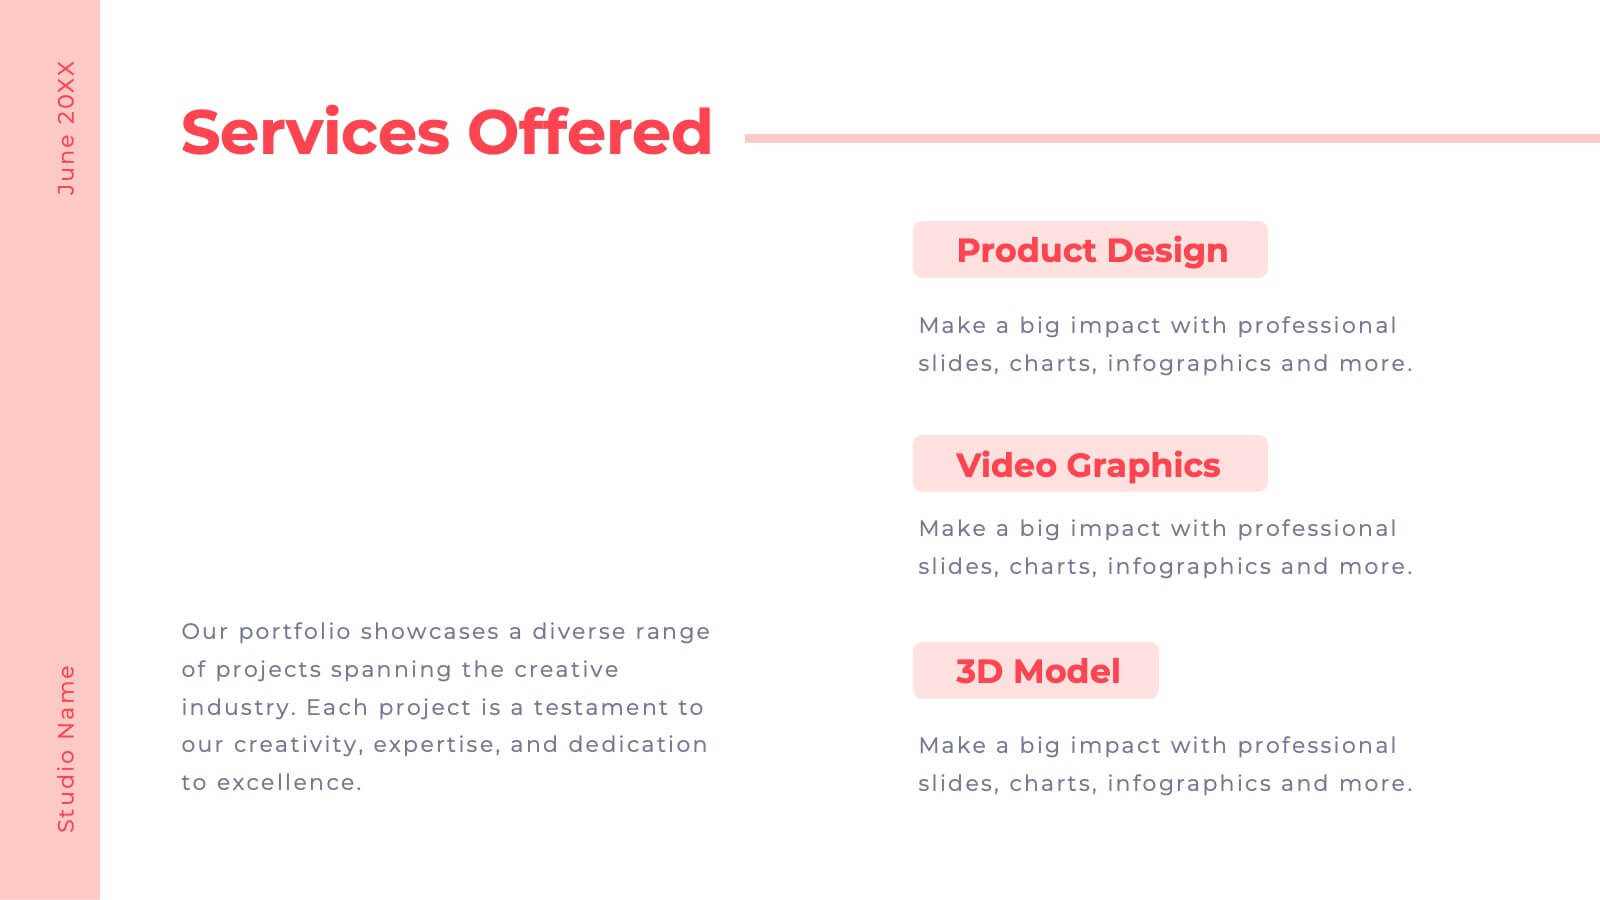
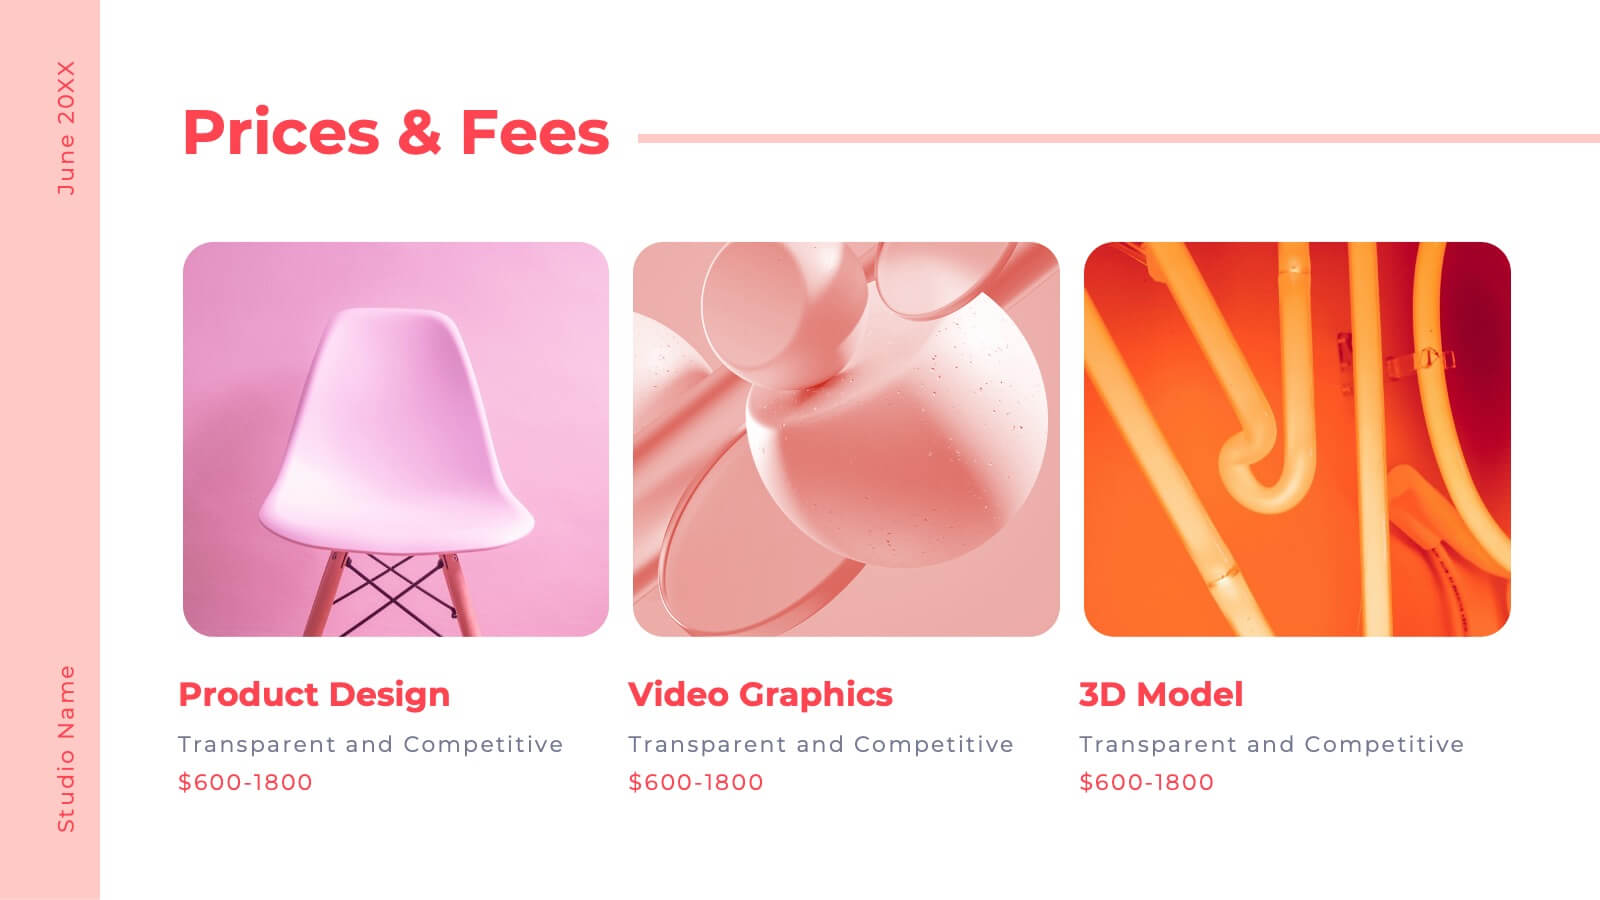
Valor Creative Portfolio Presentation
Step into creativity with this stunning portfolio template! Showcase your projects, design philosophy, and client testimonials with style and flair. Ideal for designers, artists, and creatives wanting to impress. Compatible with PowerPoint, Keynote, and Google Slides, this template elevates every portfolio to new heights. Perfect for making a lasting impact.


12 slides
Alphabet Learning and Education Presentation
Introduce concepts creatively with this bold "A"-shaped infographic designed for education topics. Each segment of the letter highlights a numbered point, making it ideal for step-by-step instructions, learning stages, or literacy development. Use it to simplify complex ideas visually. Fully editable in PowerPoint, Keynote, and Google Slides.


6 slides
Investment Strategy Planning Presentation
The "Investment Strategy Planning Presentation" templates employ a clean and straightforward design with pentagon-shaped elements to visually represent various stages or components of investment strategies. Each template highlights key points with icons that effectively communicate the concept, making them especially useful for financial presentations where clarity and emphasis on specific financial strategies are crucial. This format supports a structured approach to presenting complex investment plans, helping to guide the audience through each phase of the strategy clearly and efficiently.


4 slides
Surface vs Depth Model Iceberg Presentation
Uncover the unseen with this Surface vs Depth Model Iceberg presentation. Designed to highlight the contrast between visible factors (15%) and underlying elements (85%), this layout is ideal for business analysis, user behavior, or strategic planning. Fully editable in Canva, PowerPoint, and Google Slides for seamless customization.


4 slides
Sales Performance Heat Map Overview Presentation
Get a quick visual pulse on your data with the Sales Performance Heat Map Overview Presentation. Ideal for showing activity levels or trends across time, this slide uses a gradient color scale to help teams identify high and low performance instantly. Fully editable in Canva, PowerPoint, Keynote, and Google Slides—great for sales managers, team leads, and marketing analysts.