


Features
- 6 Unique slides
- Fully editable and easy to edit in Microsoft Powerpoint, Keynote and Google Slides
- 16:9 widescreen layout
- Clean and professional designs
- Export to JPG, PDF or send by email


Do you have any questions?
Recommend


4 slides
Key Stakeholder Identification Presentation
A great presentation starts with clarity, and this slide brings your message to life with bold, visual focus. Use it to break down key stakeholder groups, highlight their roles, and communicate insights with ease. Clean lines and intuitive icons keep everything clear and engaging. Fully compatible with PowerPoint, Keynote, and Google Slides.


21 slides
Eidora Qualitative Research Findings Presentation
Present your research findings with confidence using this professional and stylish presentation template. Covering key sections like objectives, methodology, data analysis, and recommendations, it helps you communicate complex information with clarity and impact. Perfect for academic or business use. Compatible with PowerPoint, Keynote, and Google Slides for easy customization.


8 slides
Professional Business Executive Summary Presentation
Make your insights stand tall with a bold, clean layout that feels like a data-driven story in motion. This executive summary slide is perfect for breaking down complex ideas into three clear steps, using sleek vertical bars to add visual rhythm. Compatible with PowerPoint, Keynote, and Google Slides for easy editing.


20 slides
Oscillation Project Proposal Presentation
This project proposal template is designed to captivate your audience with a bold purple and yellow color scheme, adding a modern flair to your presentation. It includes comprehensive sections like company overview, objectives and goals, methodology, deliverables, and budget breakdown. Perfect for clearly communicating your project vision and strategy, this template streamlines your content while highlighting your professional approach. Compatible with PowerPoint, Keynote, and Google Slides, it provides versatility for seamless delivery across platforms.


7 slides
Sports Management Infographic
Sports management involves planning, organizing, and coordinating activities related to sports and recreation. Step into the dynamic world of sports with our engaging sports management infographic. This template isn't just a game plan; it's a visual journey through the strategies, insights, and principles that drive success in the thrilling realm of sports management. Compatible with Powerpoint, Keynote, and Google Slides. Use this template to explore winning strategies, leadership insights, and the dynamics of this exciting field, and gear up to manage sports with precision, passion, and finesse.


6 slides
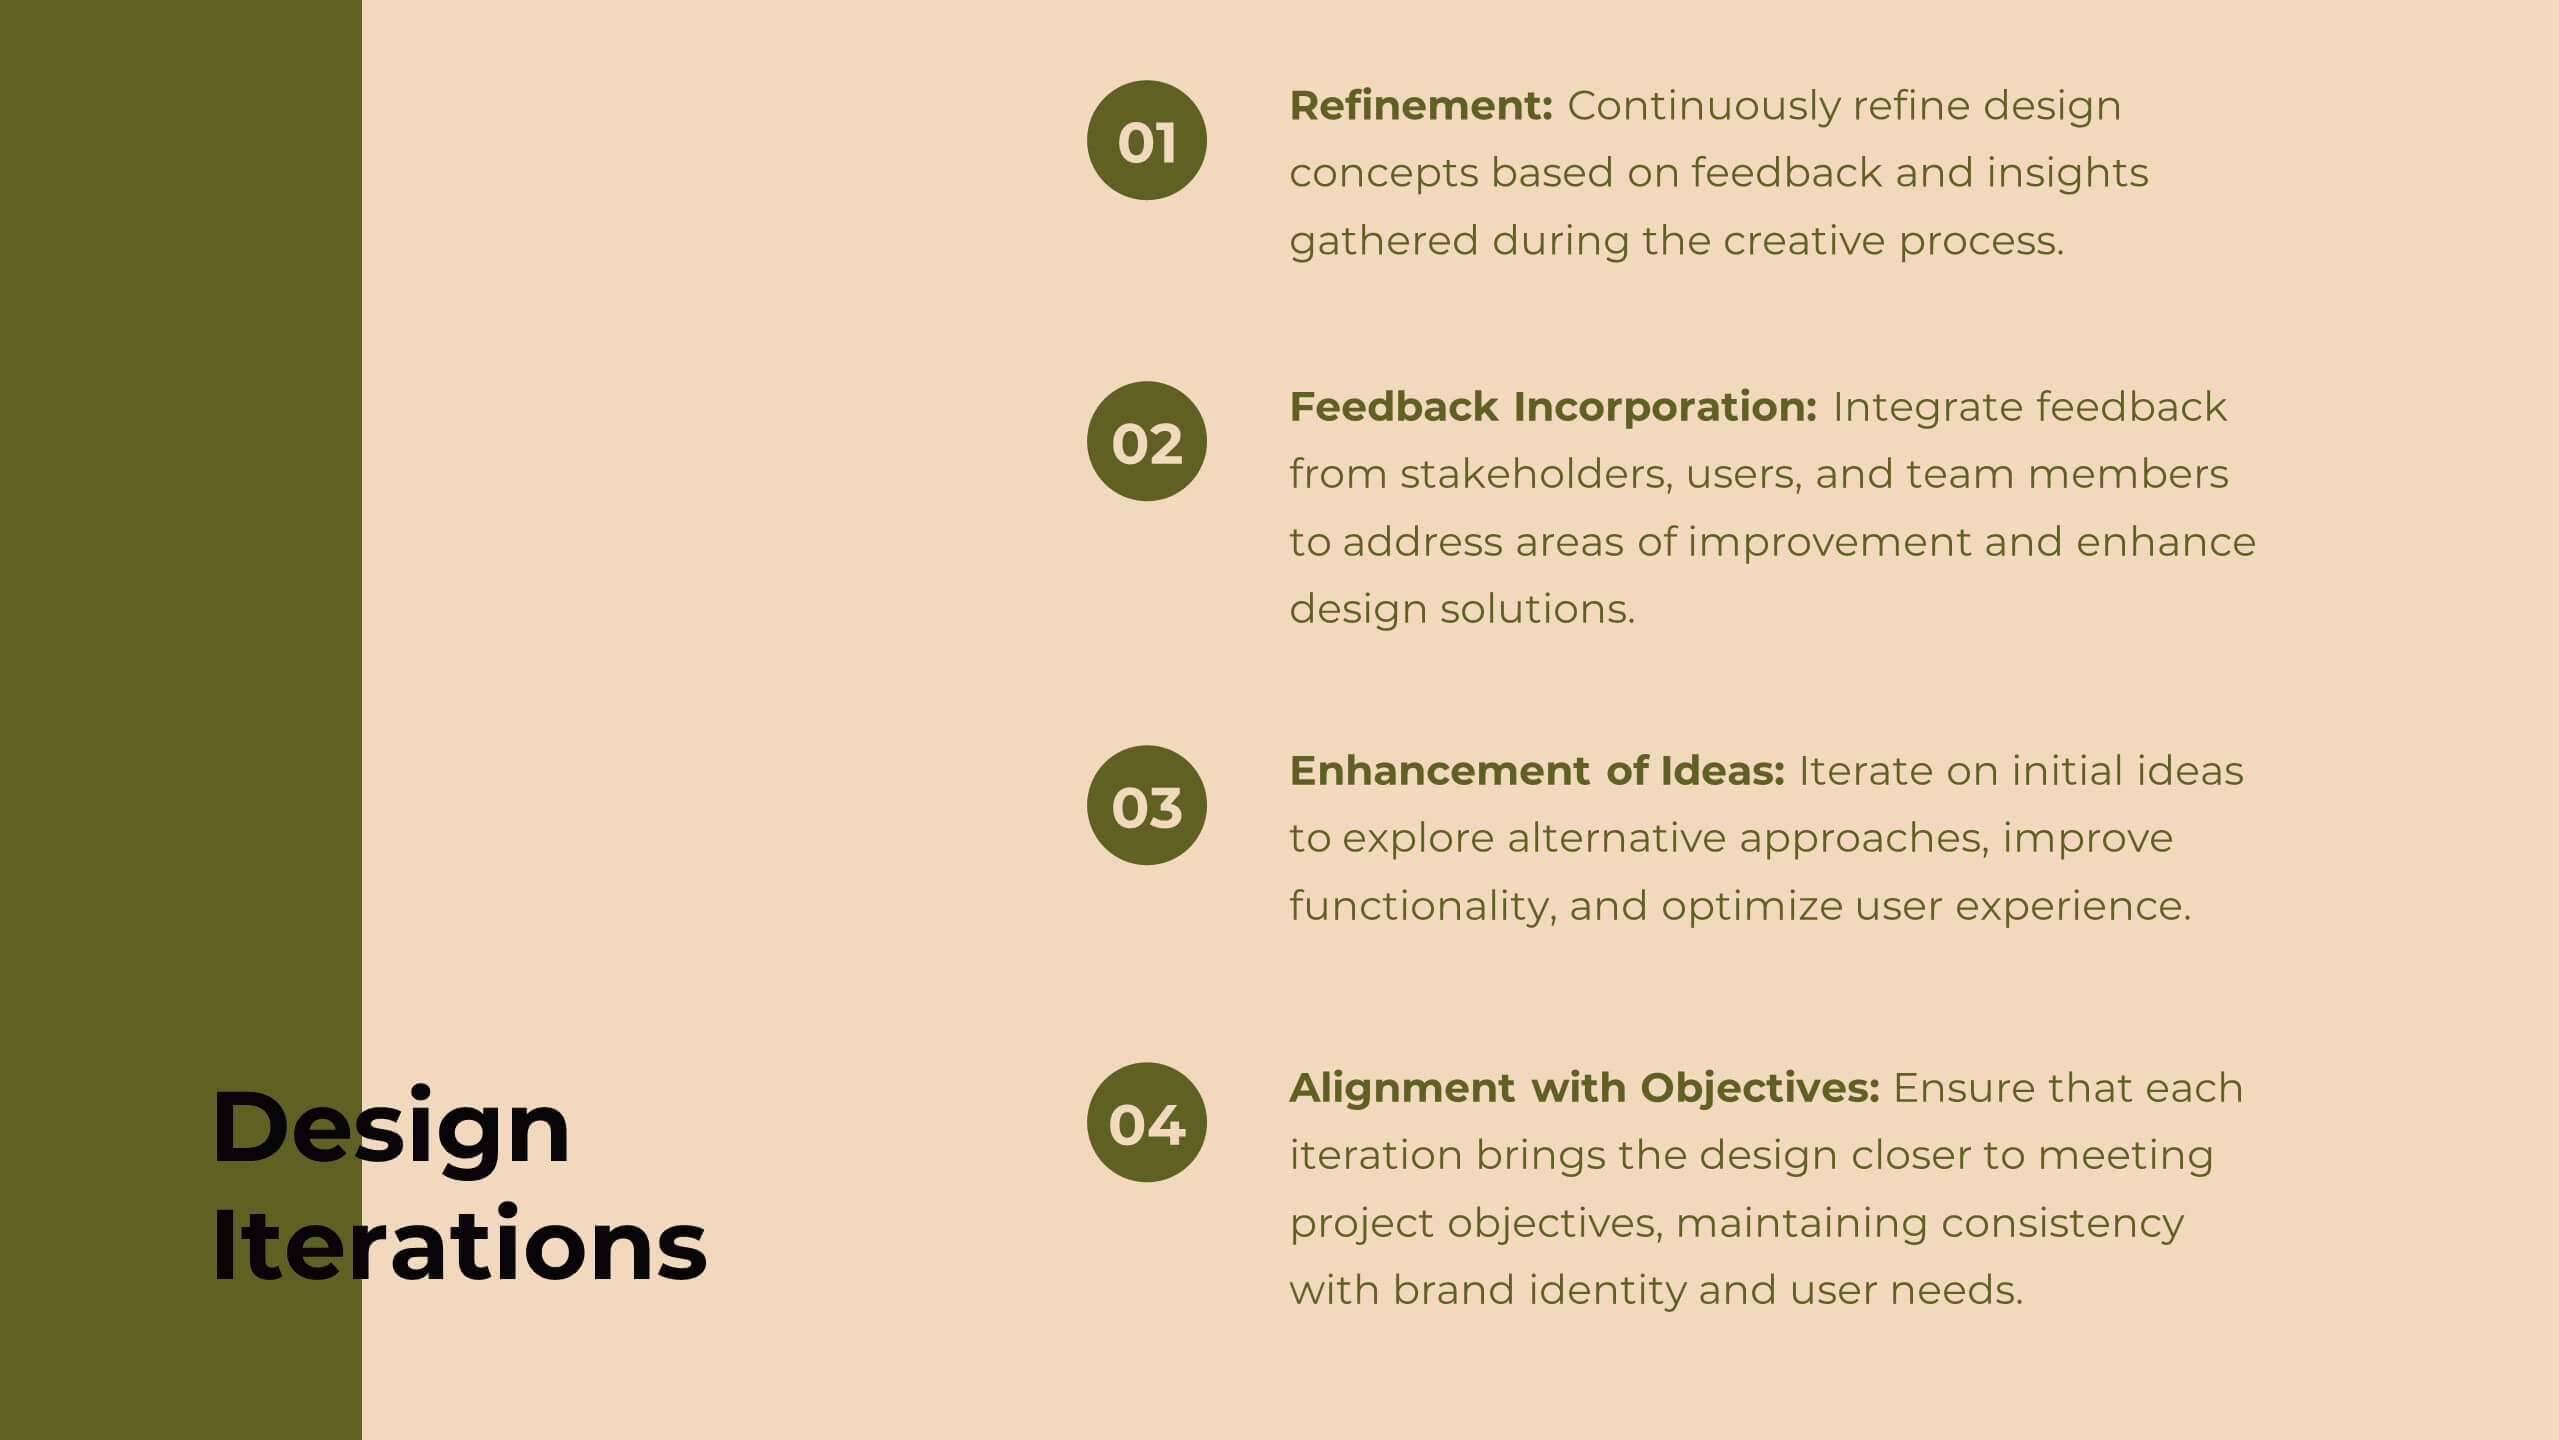
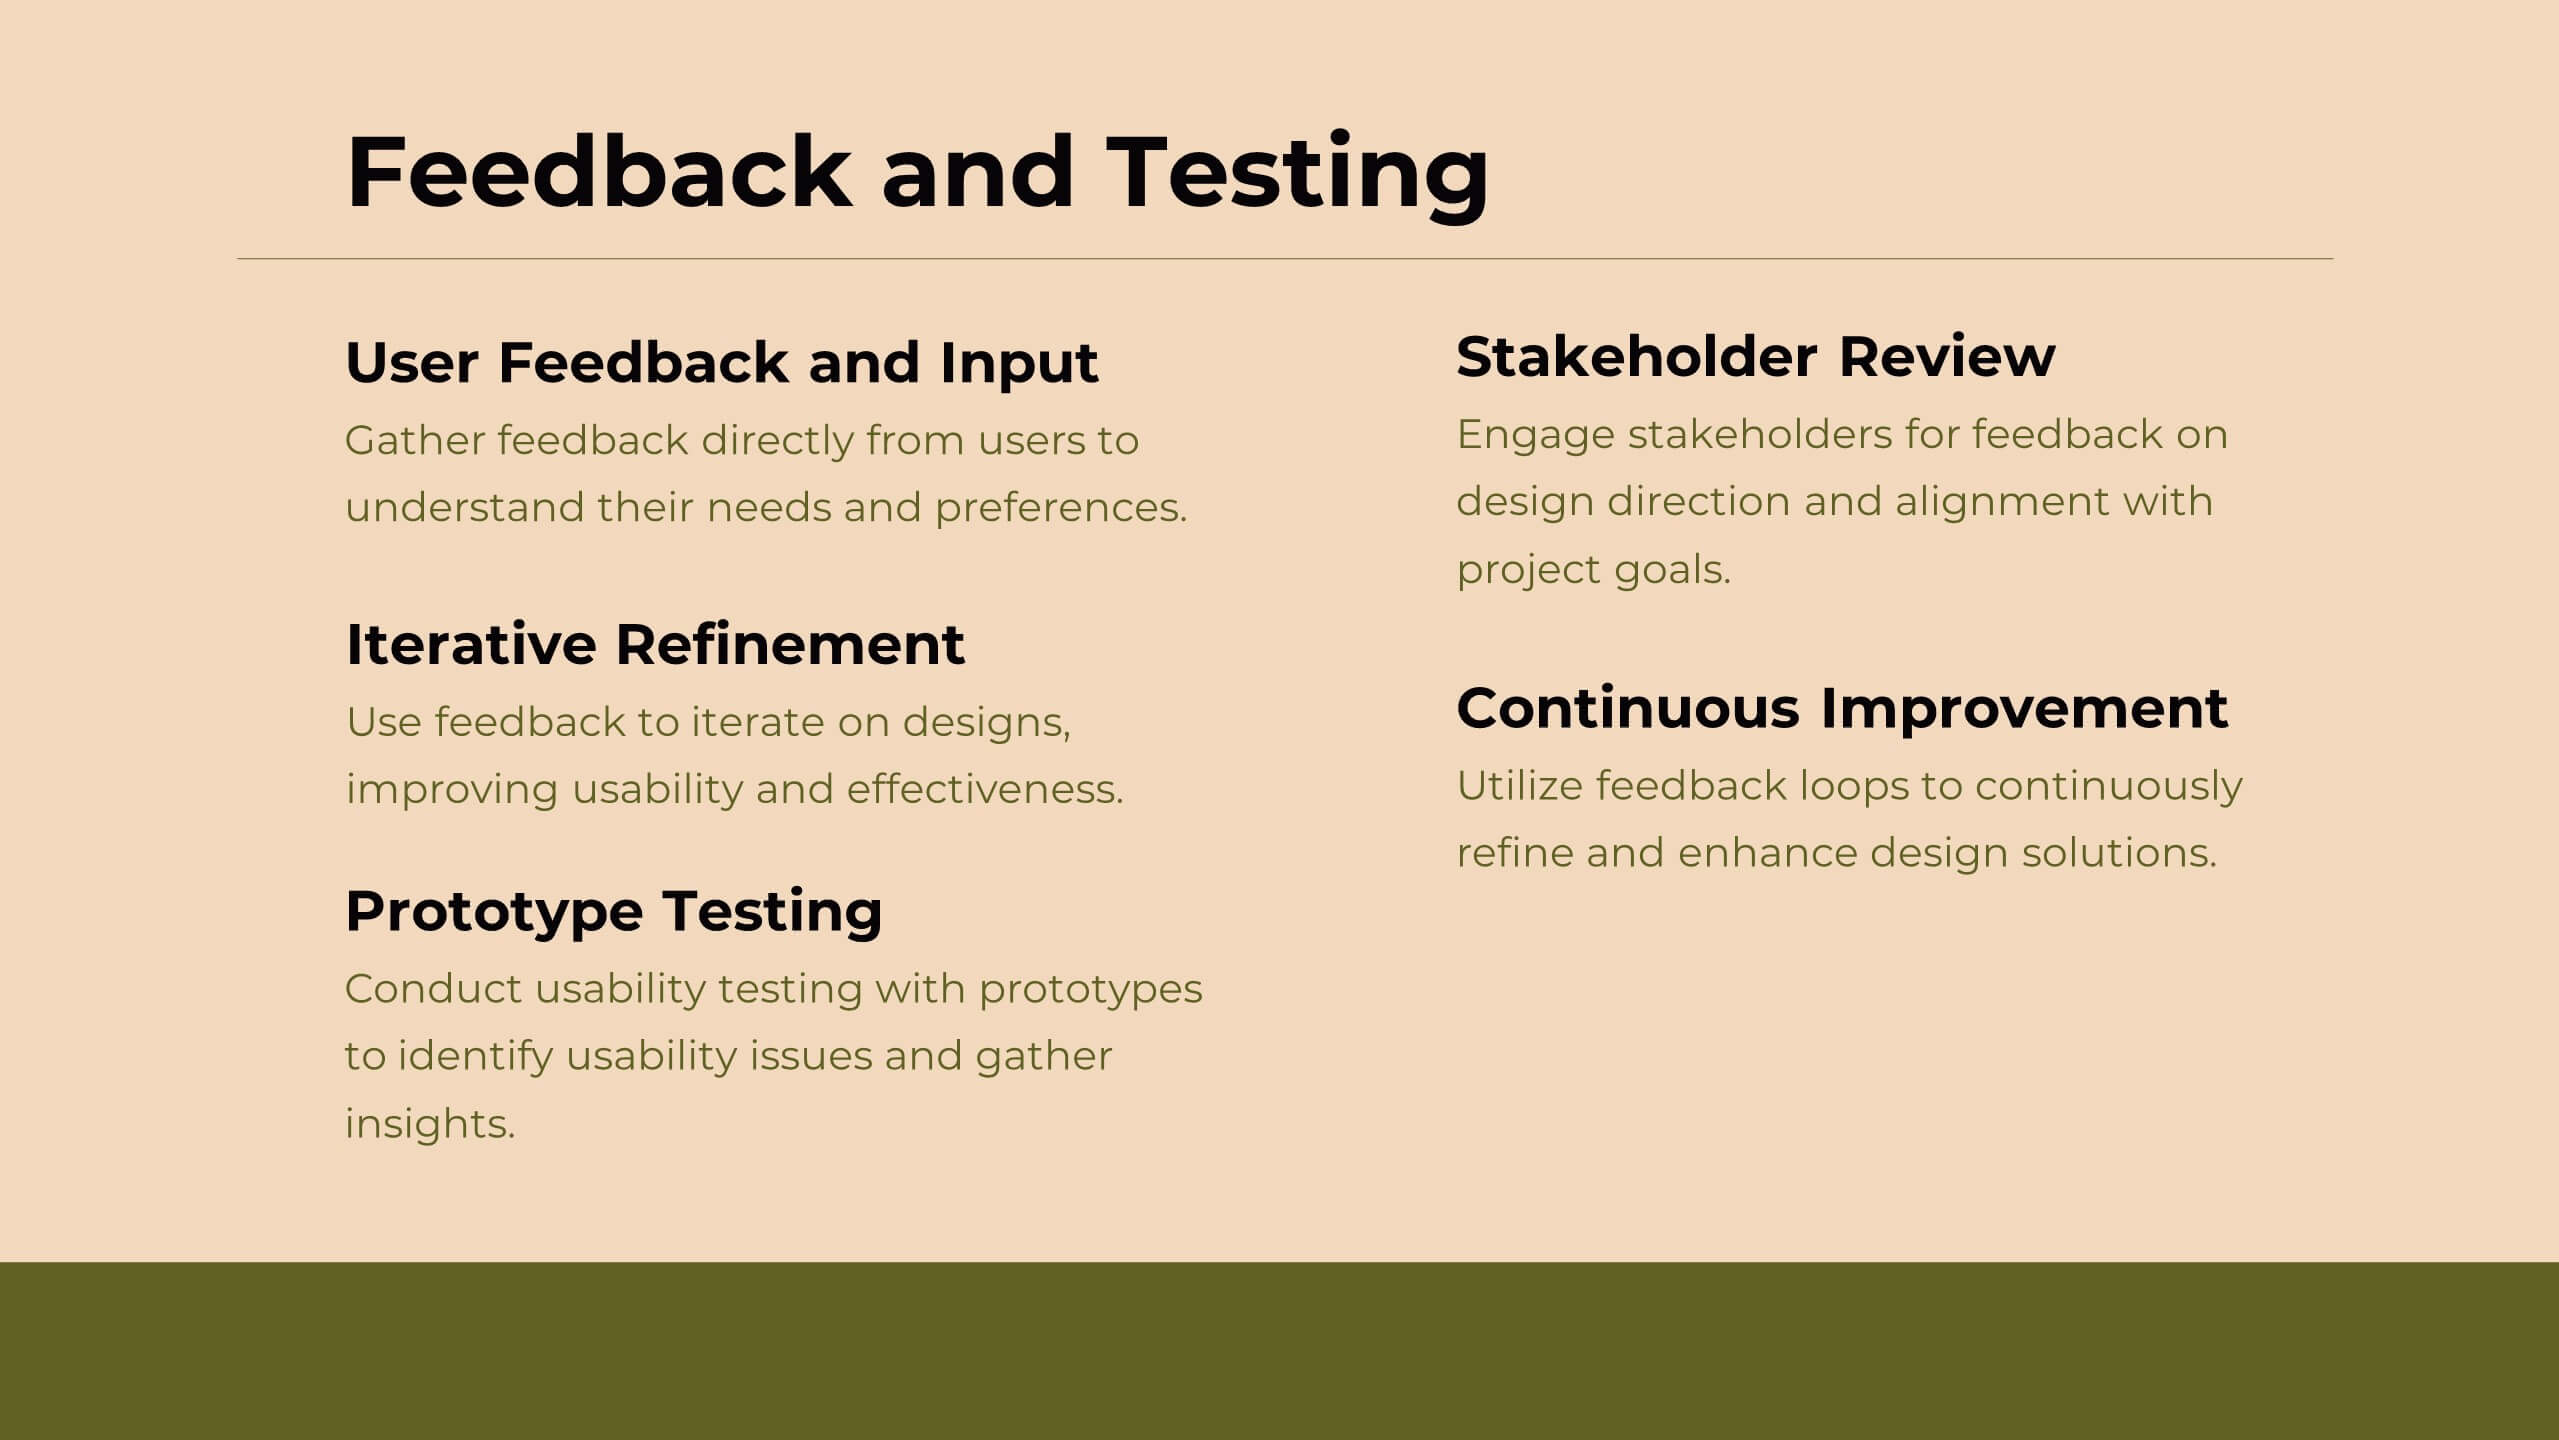
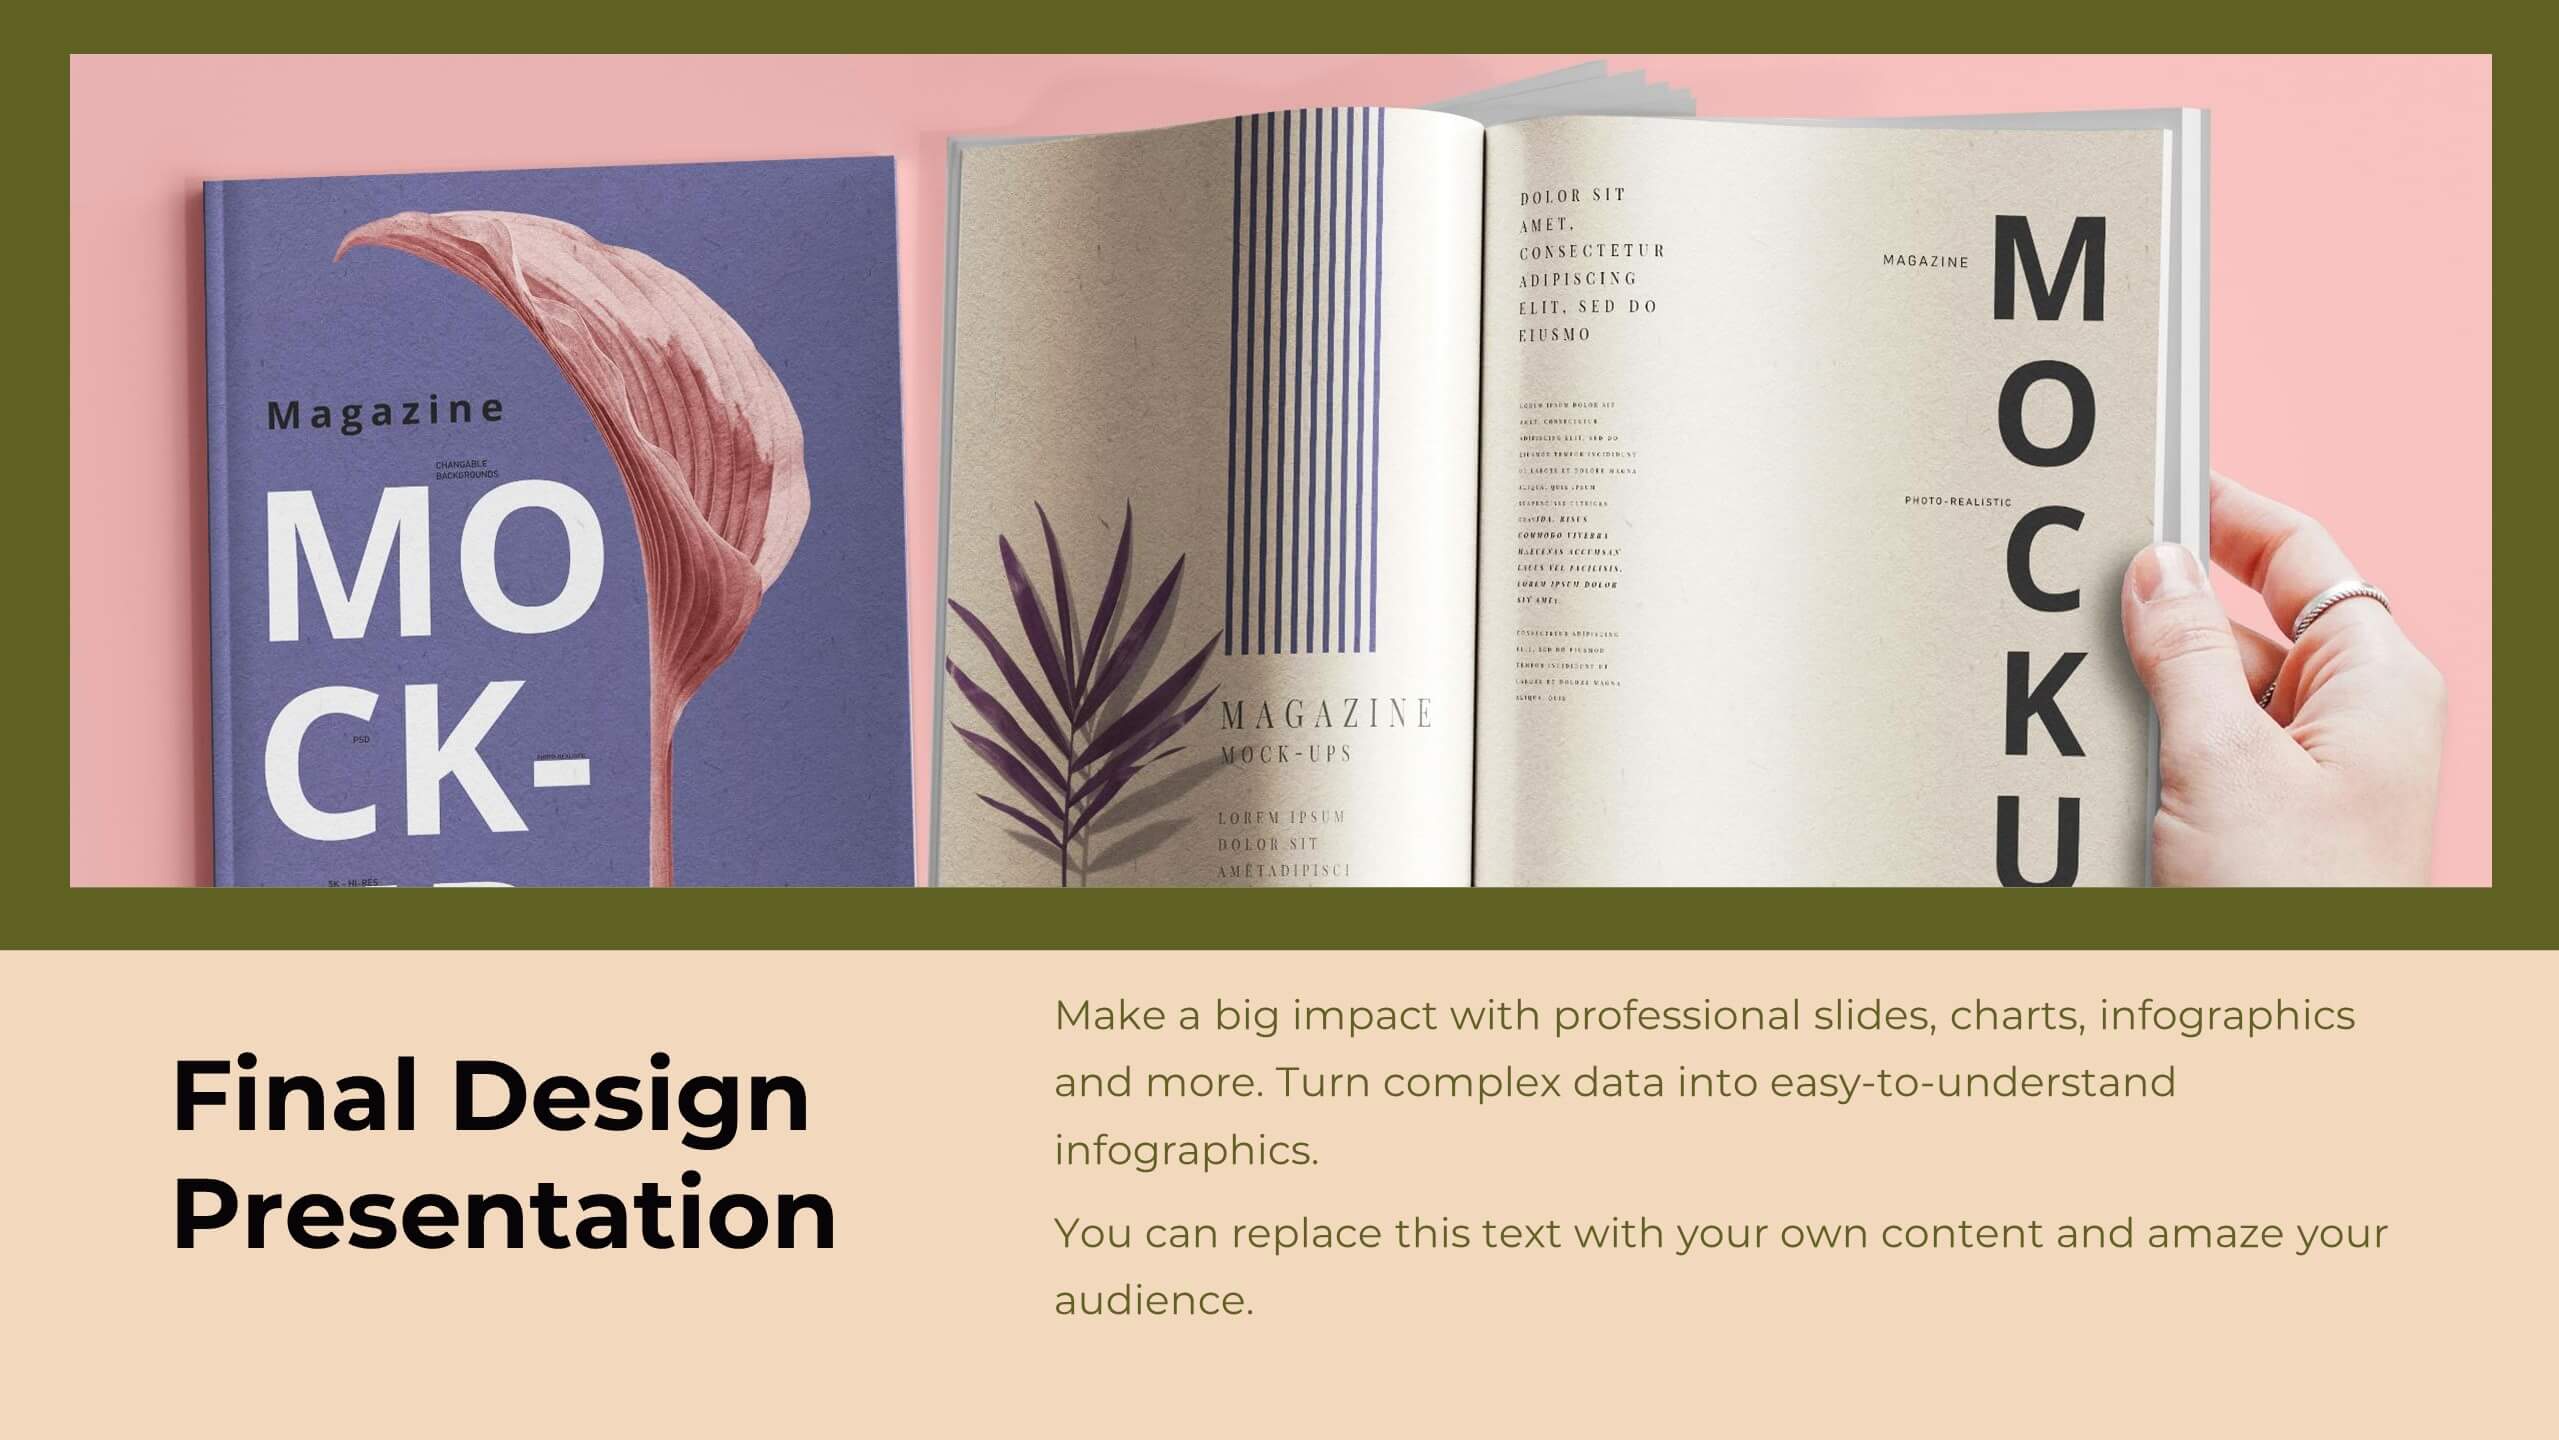
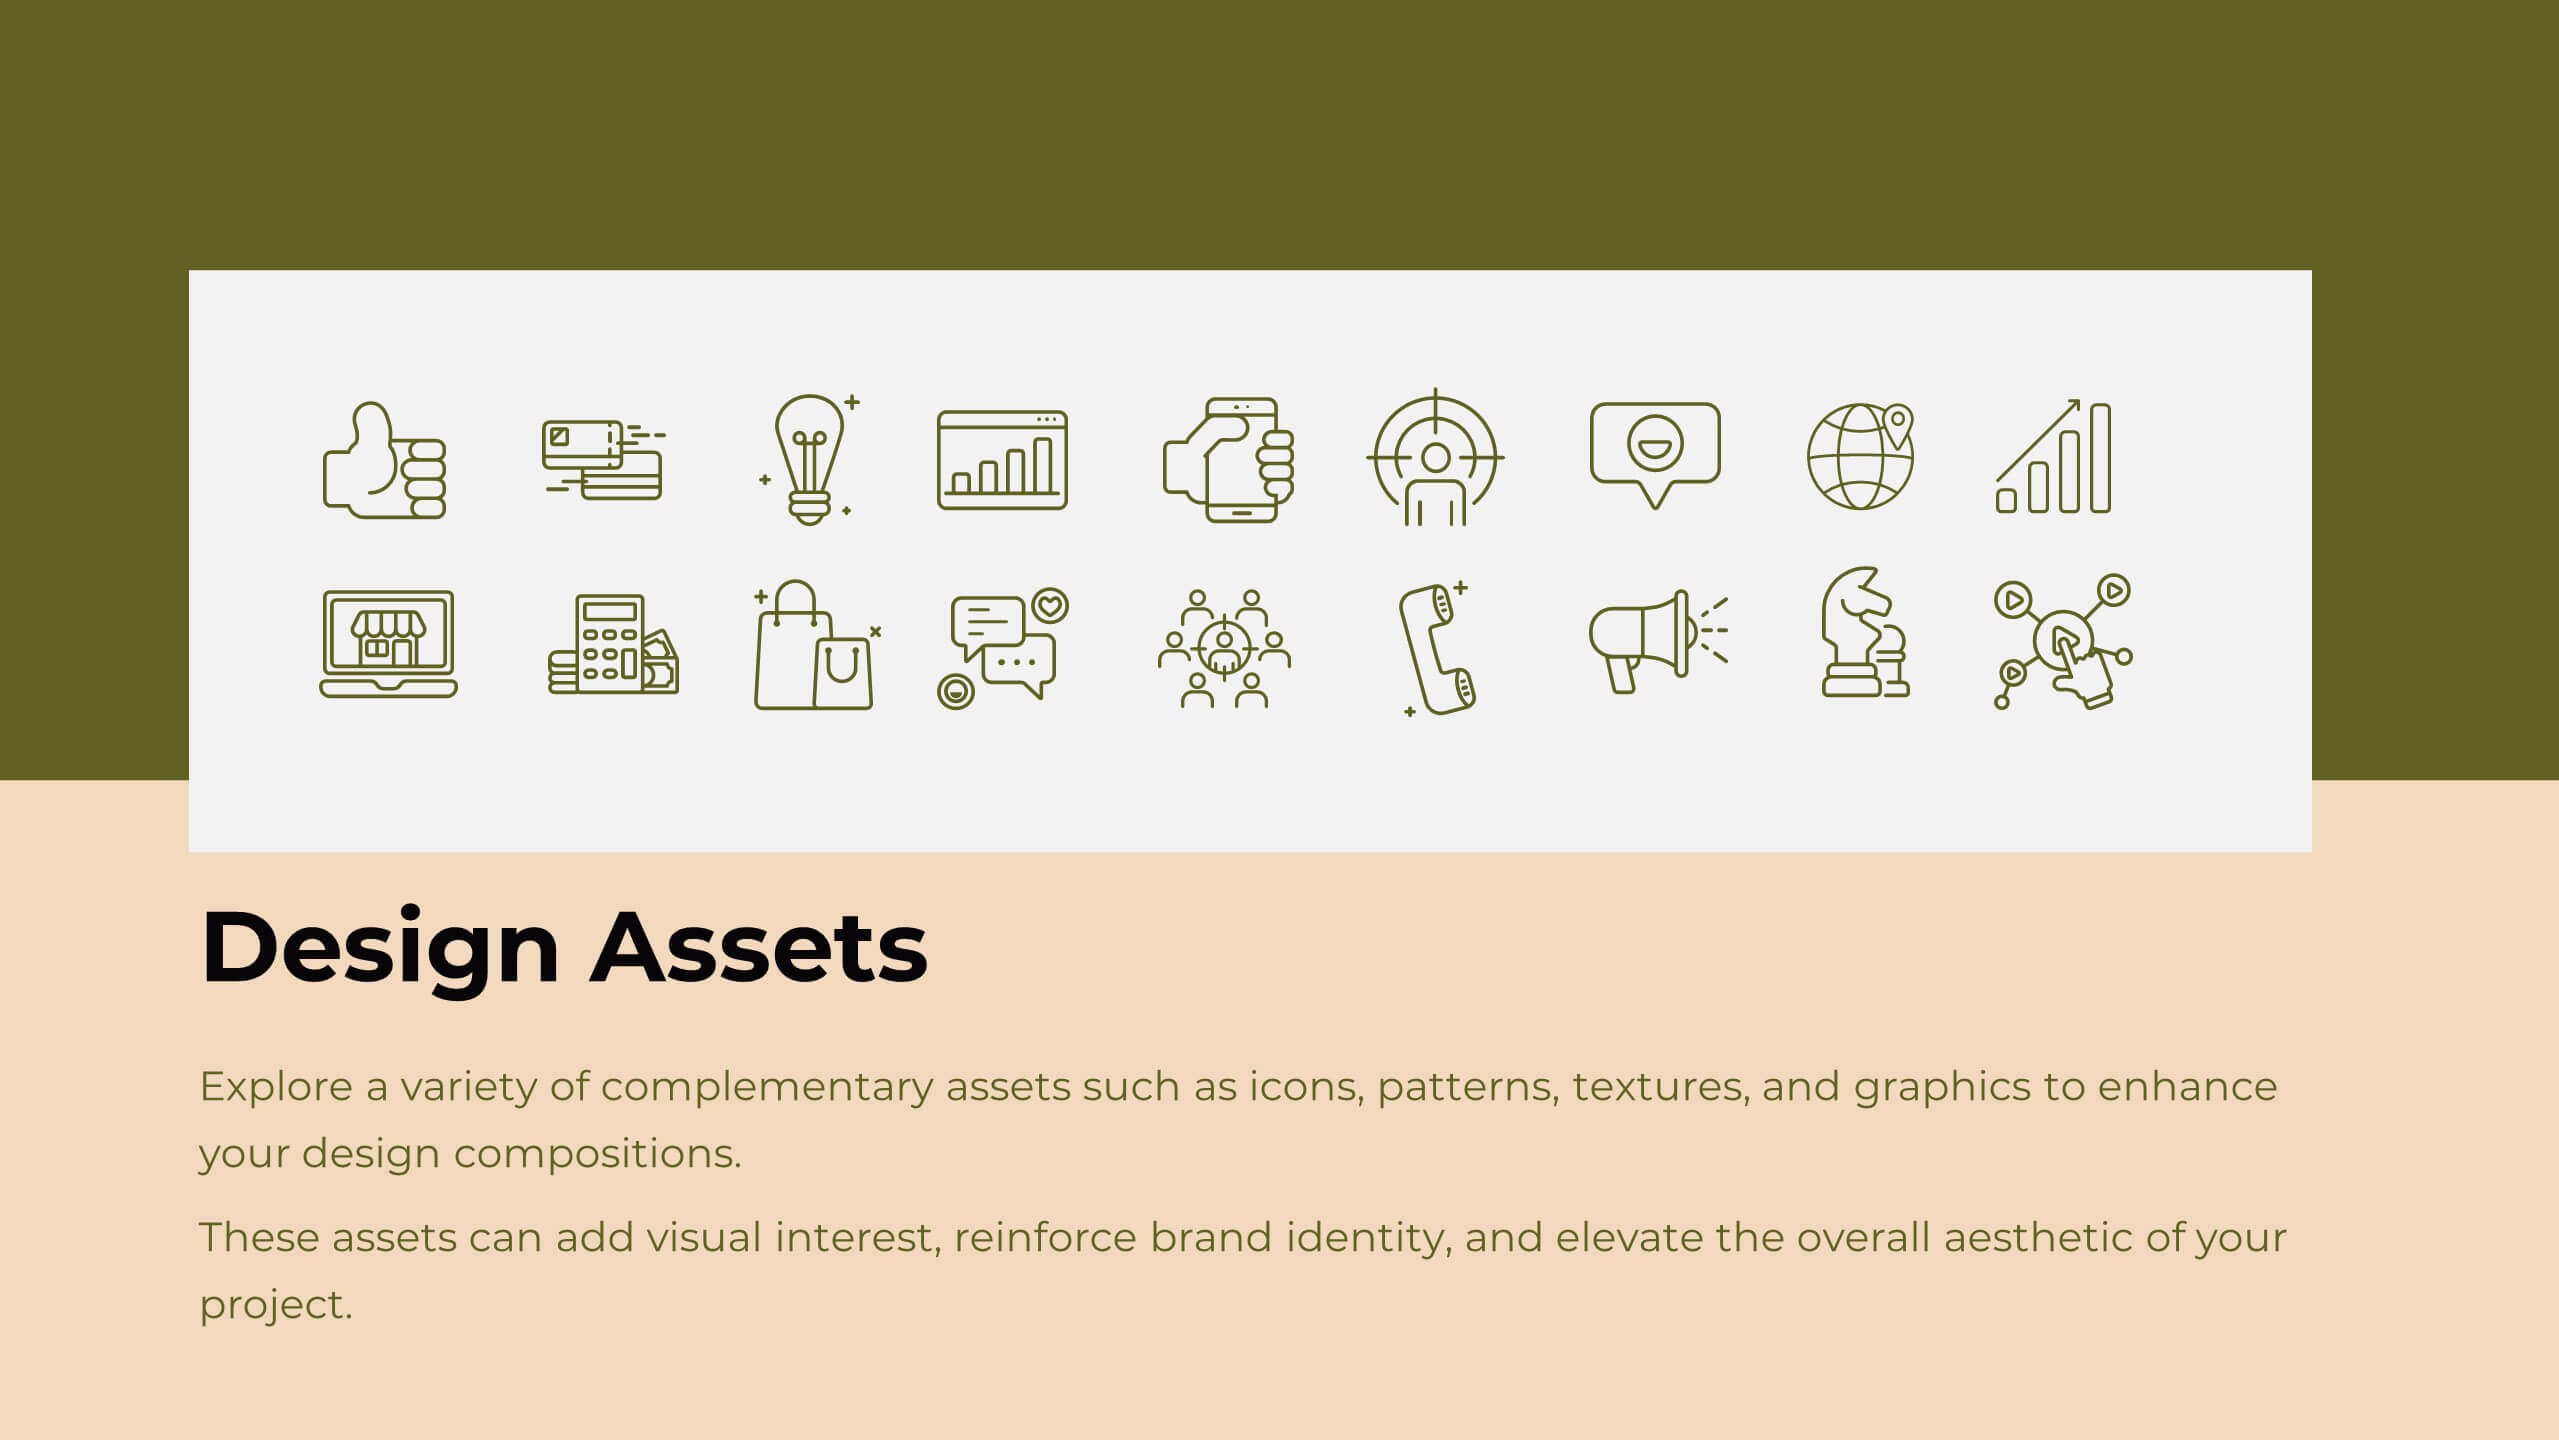
Product Development Cycles Presentation
A great product starts with a clear, engaging story—this presentation brings that journey to life. It outlines each stage of the development cycle in a simple, visual flow that helps teams communicate progress, milestones, and next steps. Perfect for strategy, planning, and updates. Fully compatible with PowerPoint, Keynote, and Google Slides.


7 slides
Sustainable Agriculture Infographic Presentation
An Agriculture Infographic presents information and data related to agriculture and the farming industry. This template is designed to cover a wide range of topics, including crop production, livestock farming, food processing, distribution, and sustainable agriculture practices. Use this infographic to provide information on the economic, social, and environmental impacts of agriculture, as well as to showcase new technologies and innovations in the farming industry. This infographic includes 7 slide layouts each with unique illustrations related to agriculture, charts, and diagrams.


5 slides
Meeting Schedule and Agenda Layout Presentation
Plan, track, and communicate multi-day meetings with this Meeting Schedule and Agenda Layout presentation. Ideal for organizing conference sessions, workshops, or internal team agendas, this layout lets you present key topics by day and time. Clean, structured, and fully editable in Canva, PowerPoint, and Google Slides for easy customization.


6 slides
Prevention and Support Breast Cancer Strategy Presentation
Deliver powerful insights with the Prevention and Support Breast Cancer Strategy Presentation. Designed for impact, this layout uses gender icons, ribbons, and clear percentage visuals to present awareness, research data, and healthcare strategies. Ideal for advocacy groups, nonprofit campaigns, or medical briefings. Fully editable in PowerPoint, Keynote, Google Slides, and Canva.


8 slides
Team Statistics and Rankings Presentation
Showcase match performance, rankings, and team metrics with this Team Statistics and Rankings Presentation. Visualize key game stats using editable diagrams, heatmaps, and comparison scores. Perfect for sports analysts, coaches, or recap slides. Compatible with PowerPoint, Keynote, and Google Slides—fully customizable for your team’s specific data and branding needs.


10 slides
Corporate Governance and Law Presentation
Master the essentials of organizational oversight with the "Corporate Governance and Law" template, which offers a structured approach to business management, effectively illustrating key elements such as performance, strategy, governance, talent, and integrity. This layout ensures easy comprehension and is ideal for illustrating the hierarchical relationships and regulatory frameworks in corporate environments. Compatible with PowerPoint, Keynote, and Google Slides.


6 slides
Digital Marketing Agency Infographic
Digital marketing refers to the use of digital channels, platforms, and technologies to promote products, services, or brands to a target audience. This infographic can help showcase the services your agency offers, your expertise, and the benefits of choosing your agency for digital marketing needs. This template is fully customizable and compatible with Powerpoint, Keynote, and Google Slides. Use icons, illustrations, and images to represent different digital marketing services and concepts. Create sections that detail the various digital marketing services your agency provides.


5 slides
Breast Cancer Treatment Infographics
Breast cancer is a type of cancer that develops in the breast cells. These vertical infographics serve as a valuable resource for healthcare professionals, patients, advocacy groups, and educational institutions involved in breast cancer awareness and support. They provide a visually engaging and informative overview of common causes, different treatment options, stages, side effects, survivorship, and ongoing research in breast cancer treatment. This template will help you convey crucial information in a clear manner, empowering individuals with knowledge about breast cancer treatment options and fostering informed decision-making.


6 slides
Business Revenue Break-Even Strategy
Visualize profitability with clarity using this dynamic break-even strategy template. Ideal for business analysts, finance teams, and consultants, this diagram highlights the balance between cost, loss, and profit at the break-even point. With intuitive icons and space for key metrics, it's fully editable in PowerPoint, Keynote, and Google Slides.


5 slides
Economic Analysis of Europe Map Presentation
Visualize key economic indicators across European regions with this impactful map-based presentation. Use shaded country highlights and accompanying bar charts to present comparative data, performance trends, and regional growth. Ideal for economic reports, investor updates, or strategic planning. Fully editable and works seamlessly with PowerPoint, Keynote, and Google Slides.


21 slides
Apollo Sales Pitch Deck Template Presentation
Create an impressive sales pitch with this sophisticated template. Highlight your company overview, problem statement, solutions, and market opportunities. Showcase your unique selling proposition and marketing strategy. Ideal for PowerPoint, Keynote, and Google Slides.


21 slides
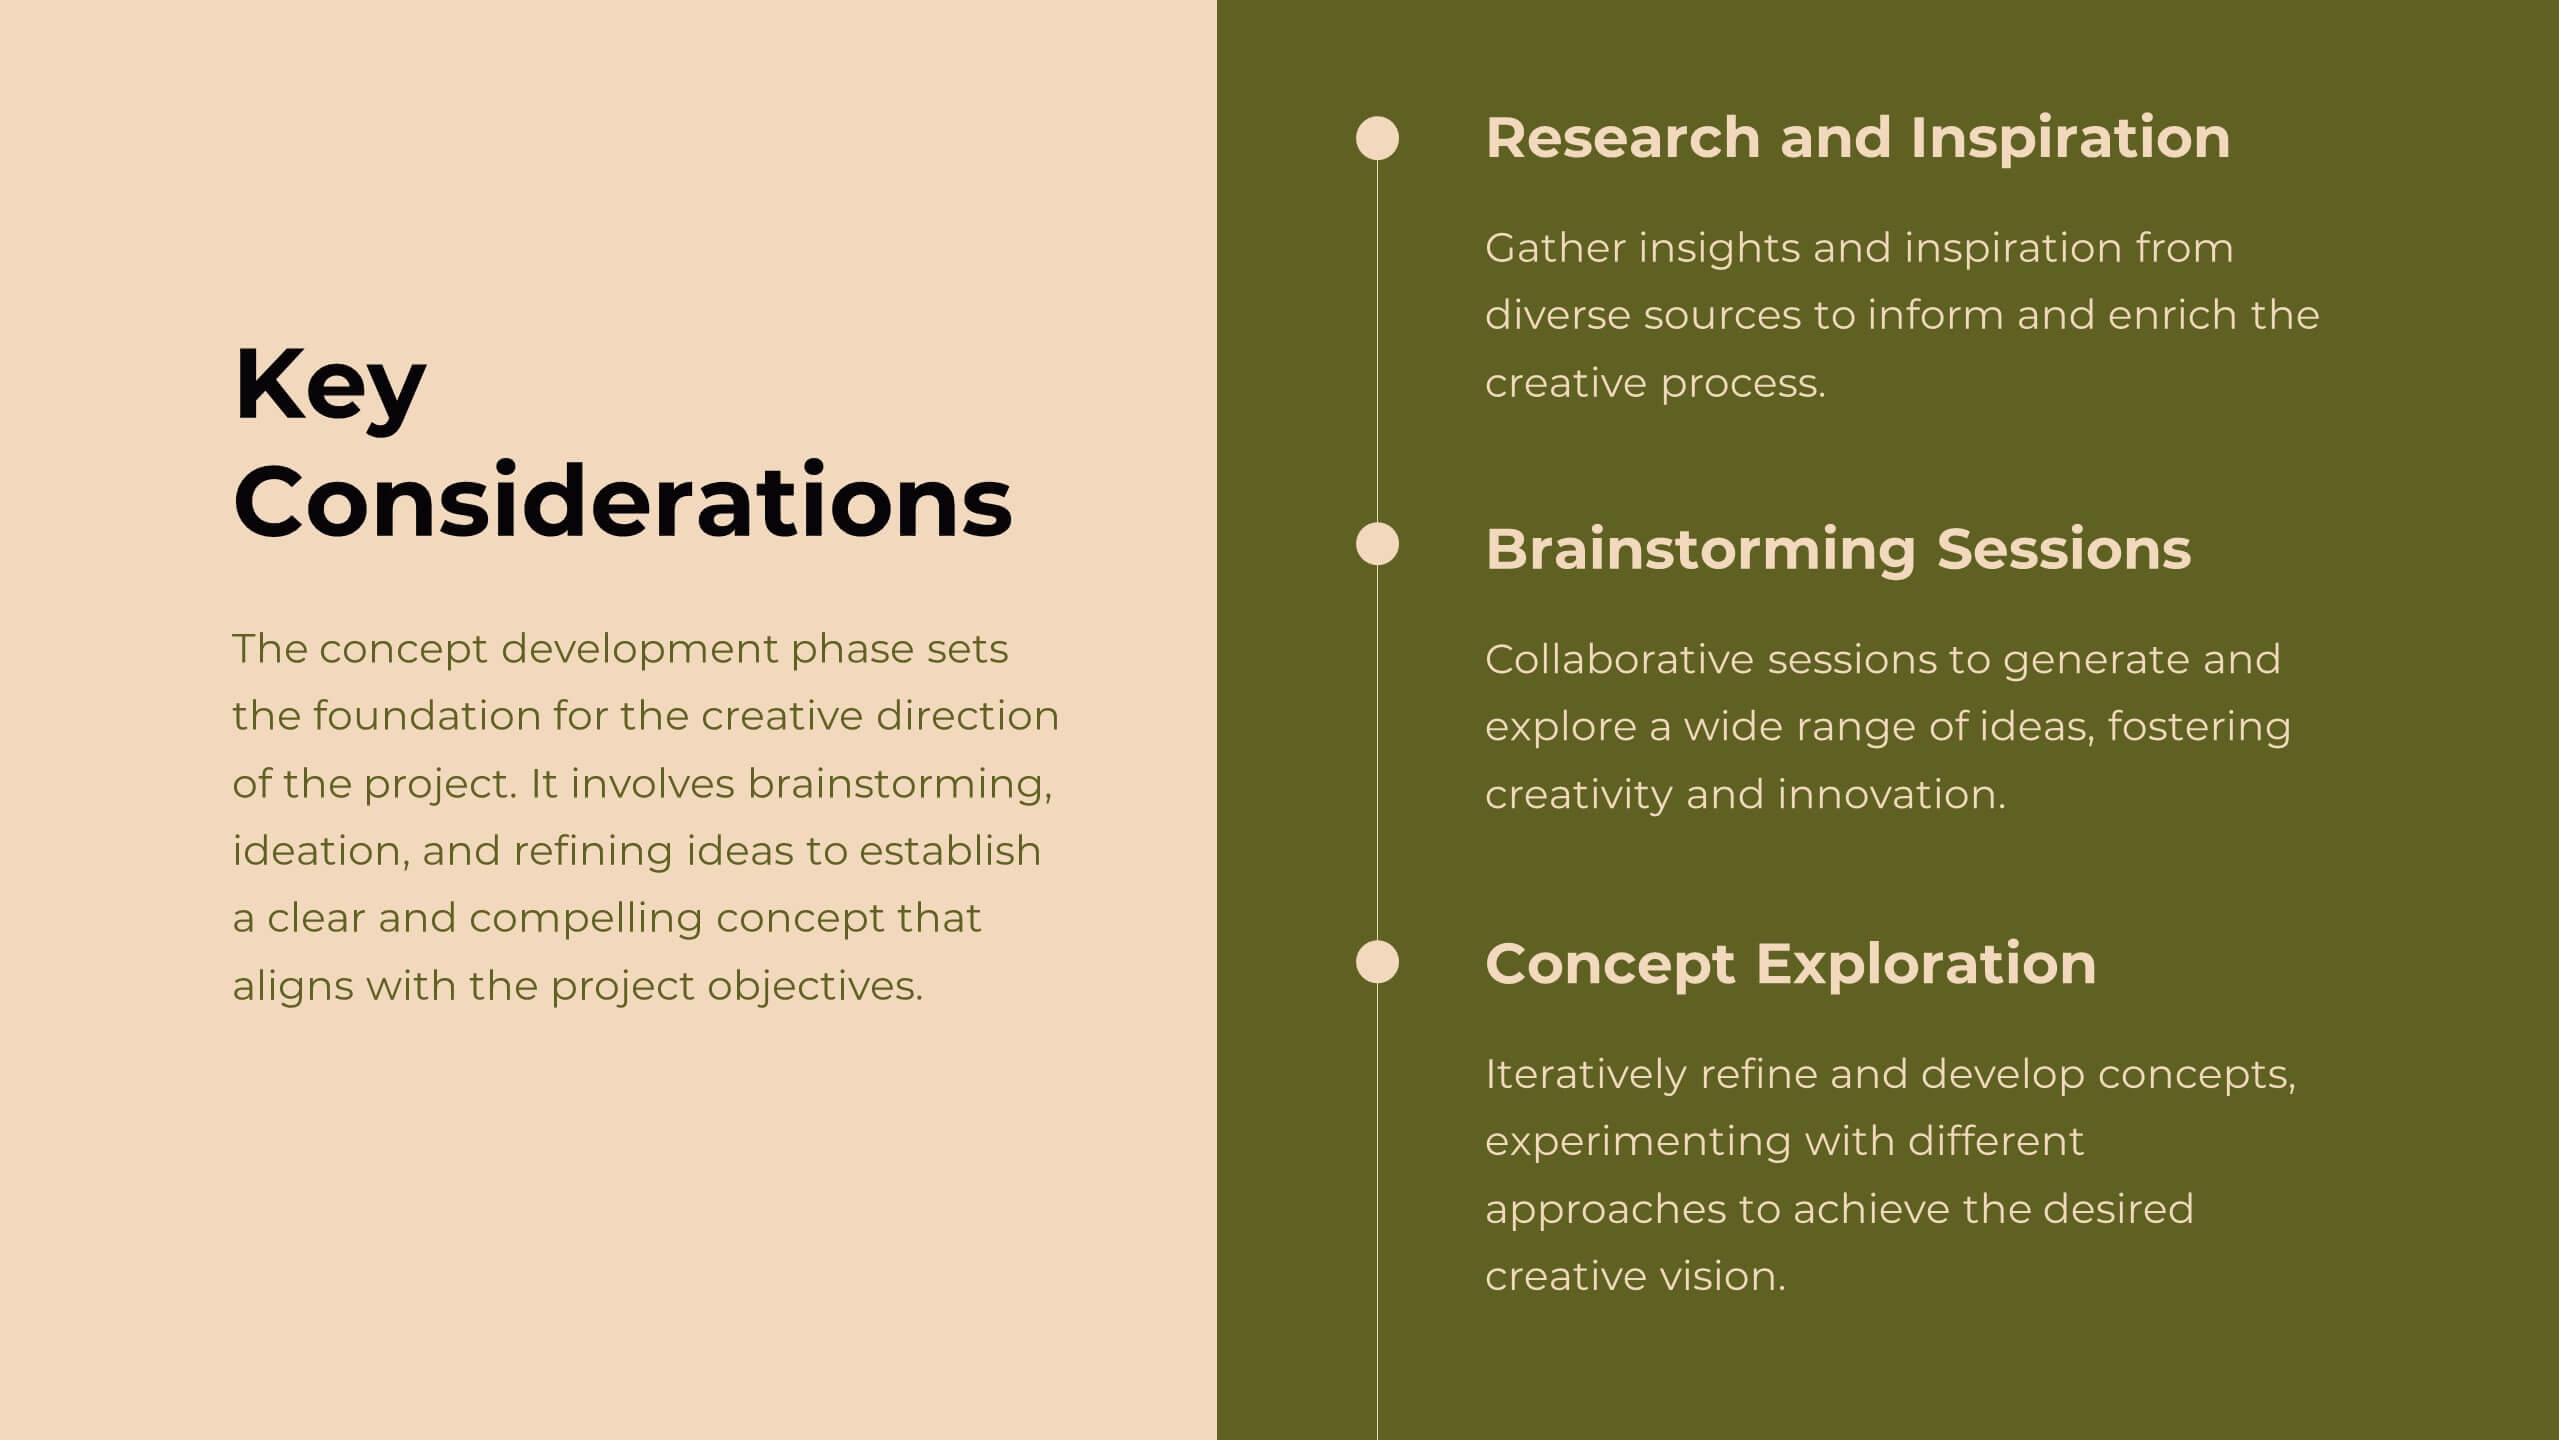
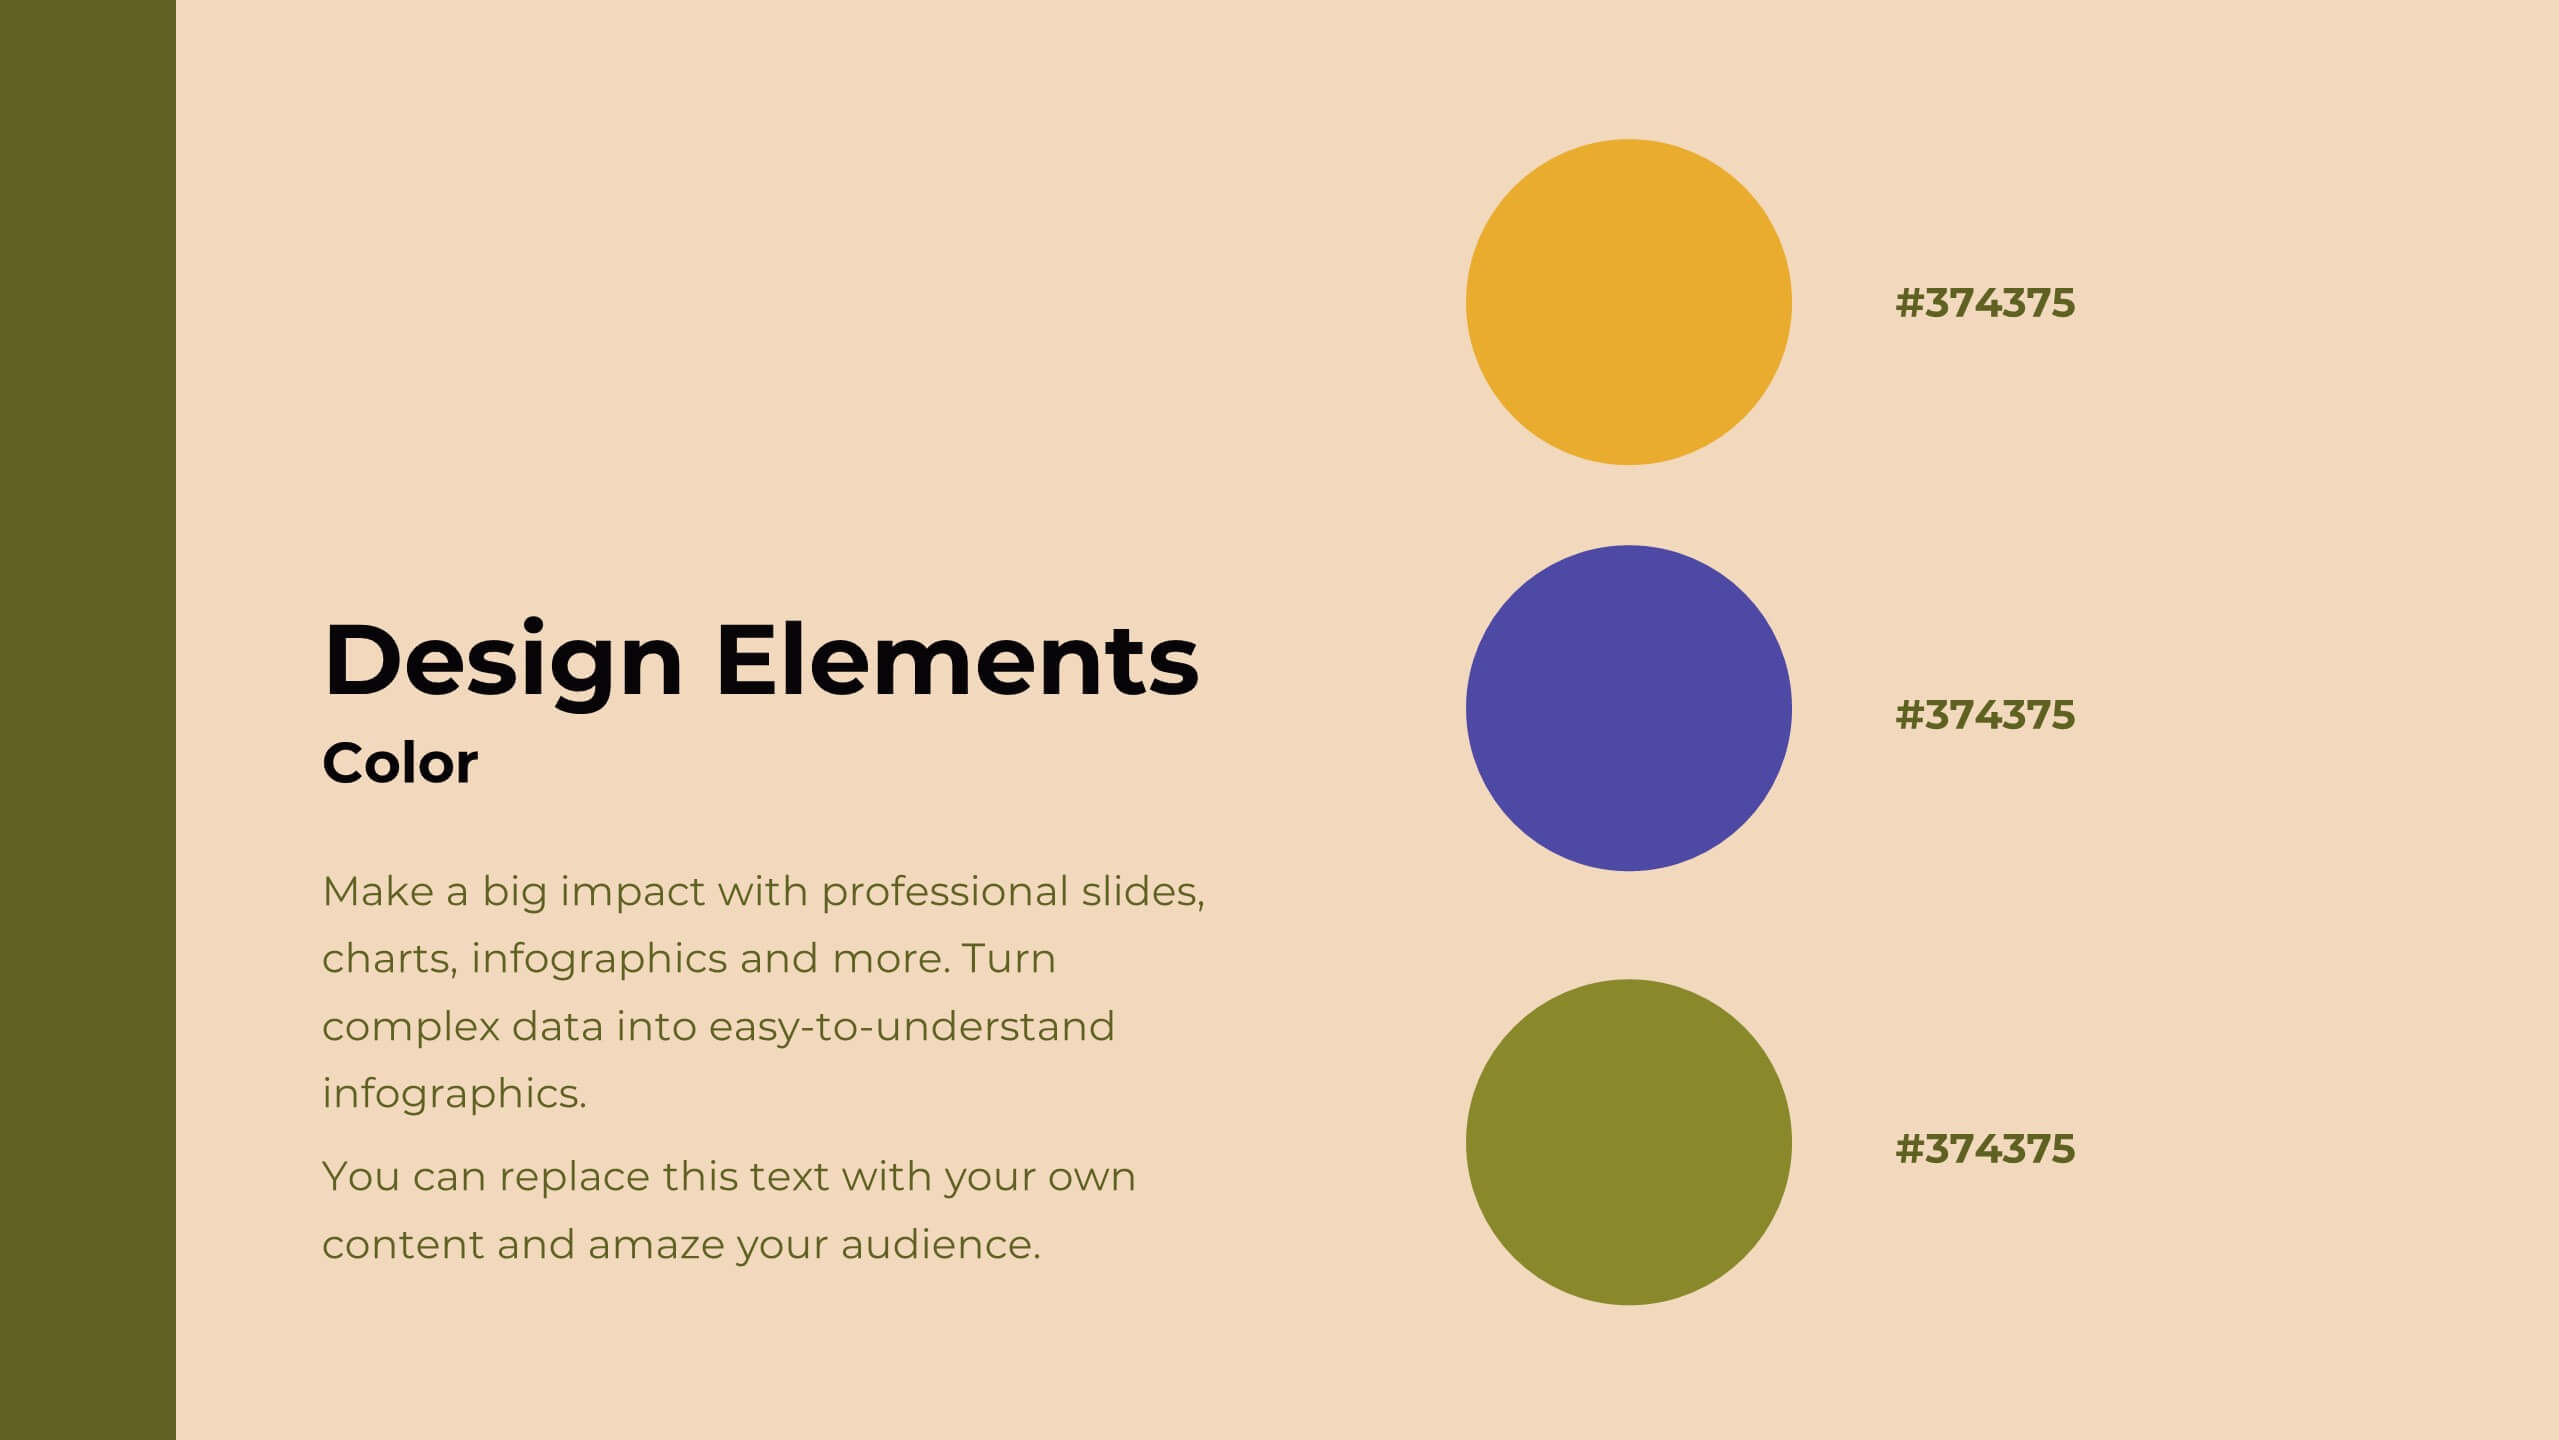
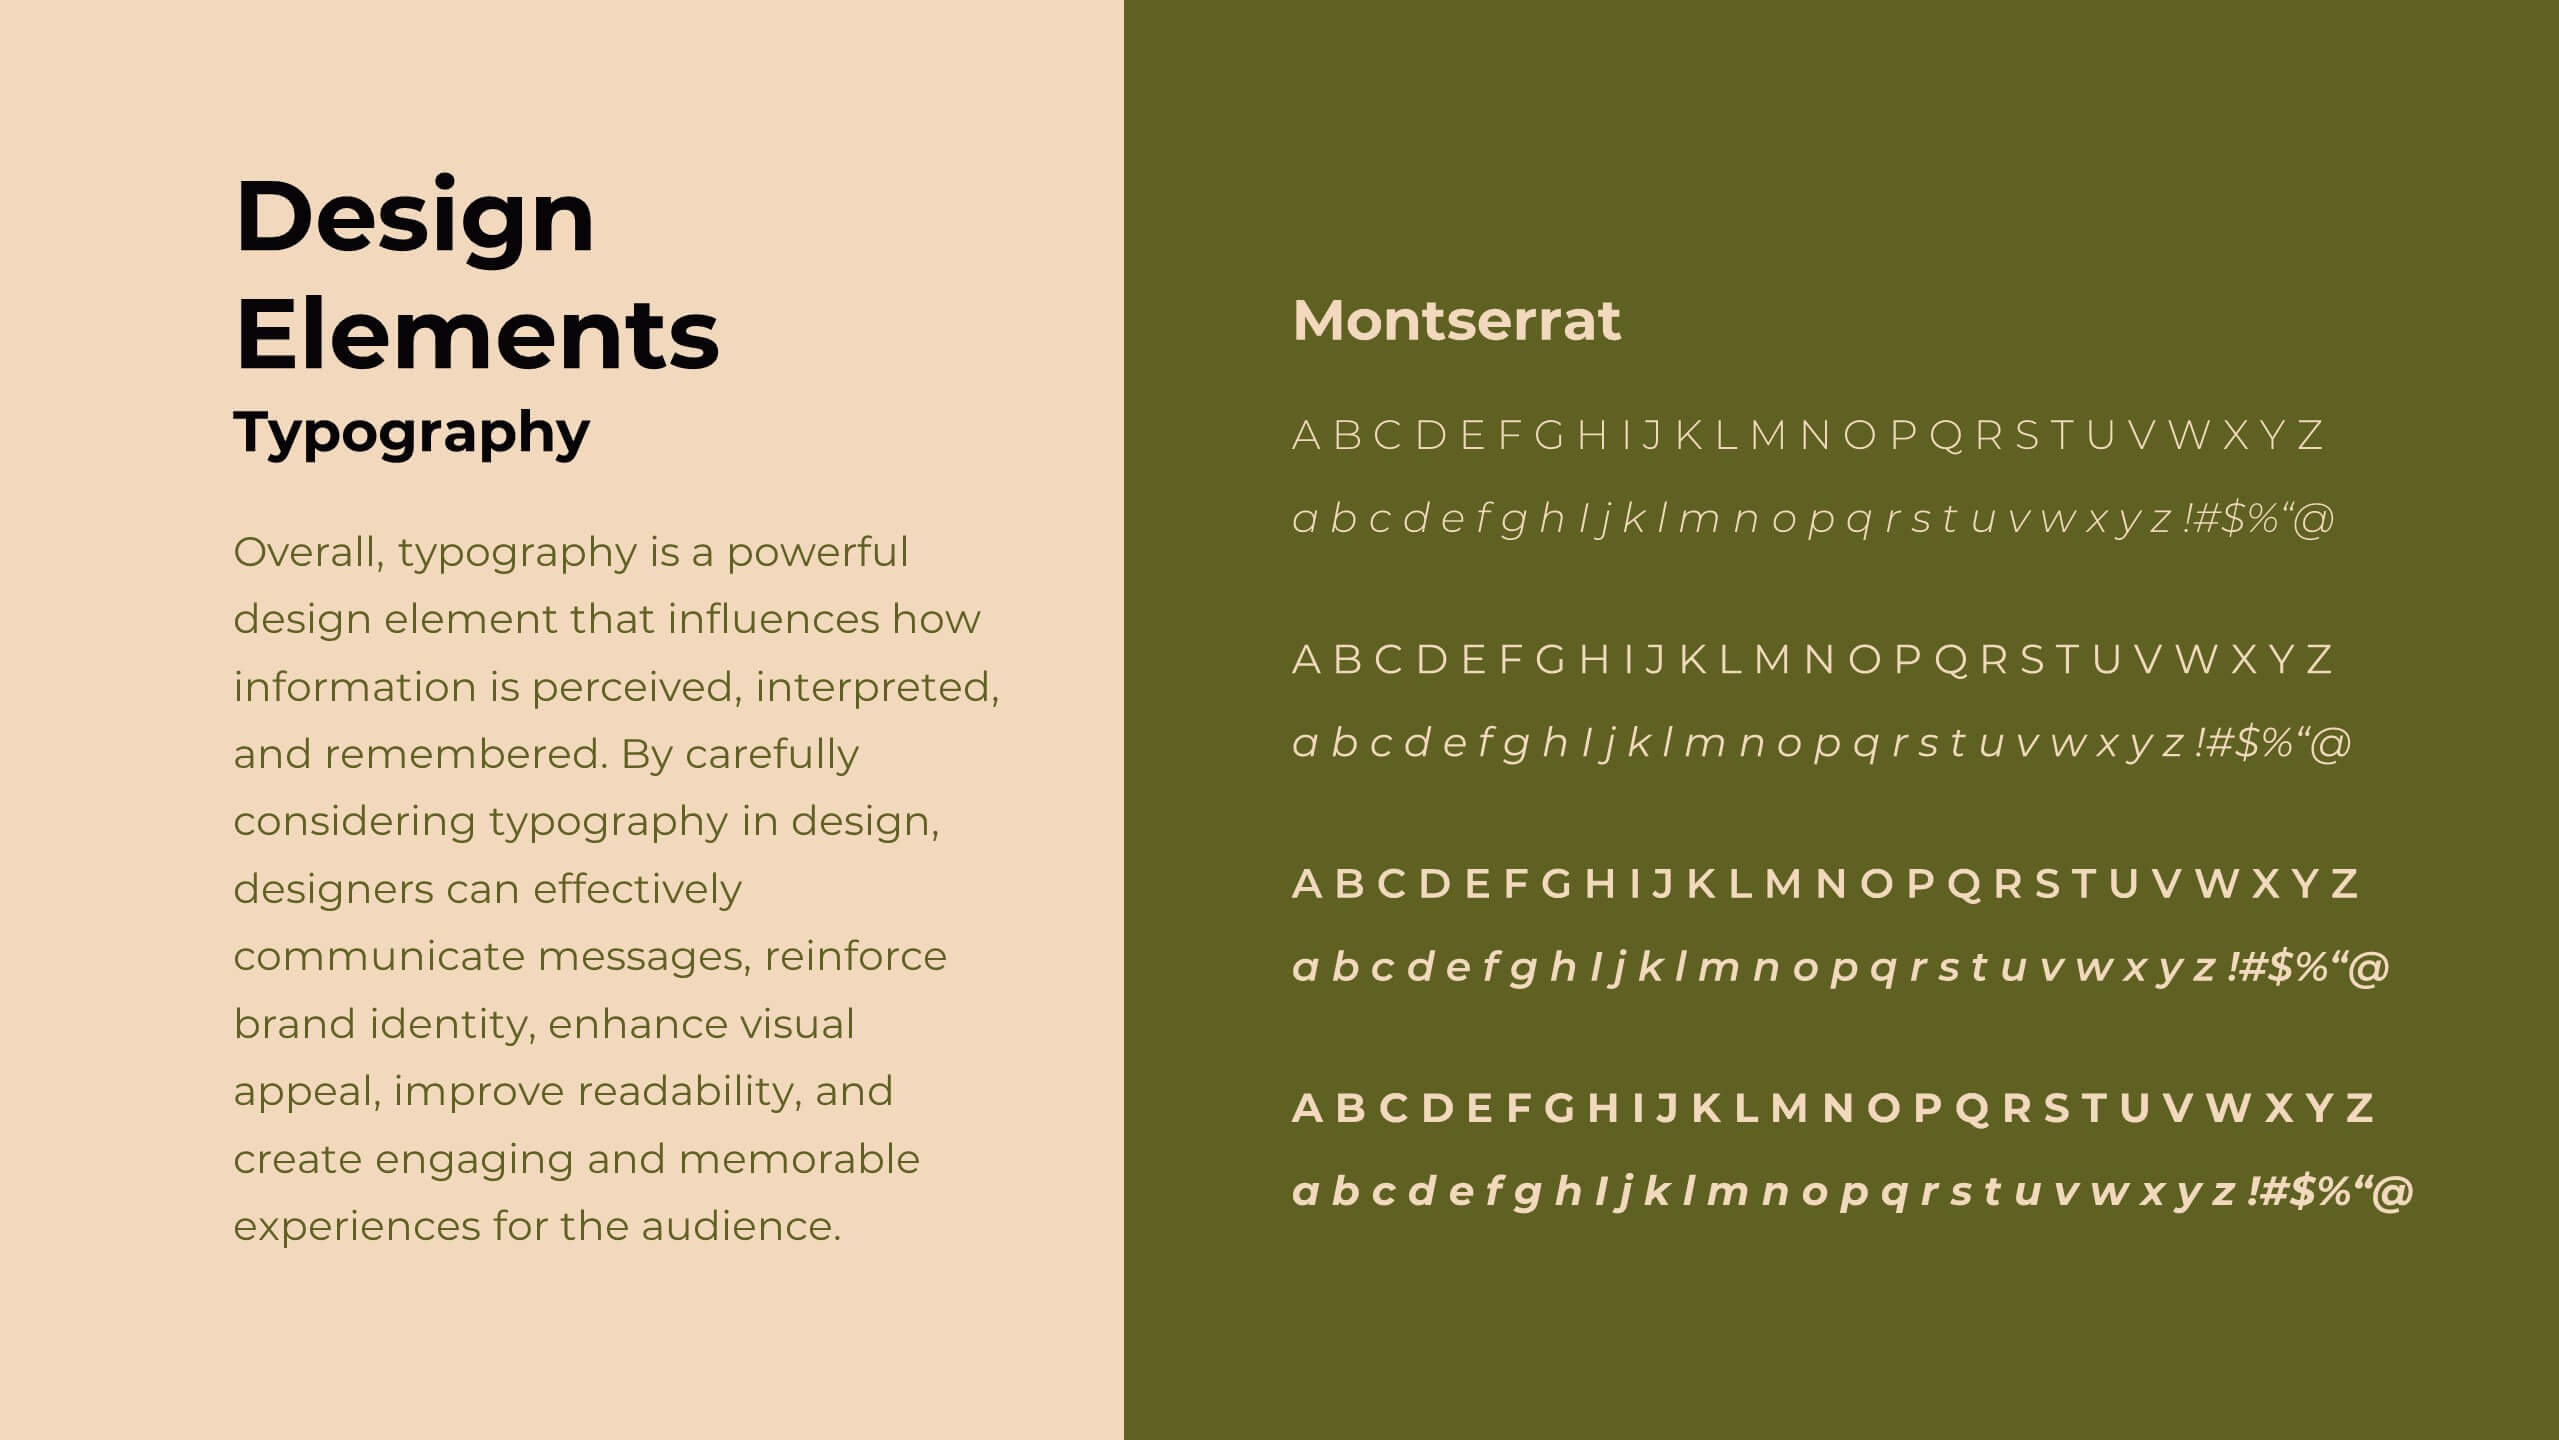
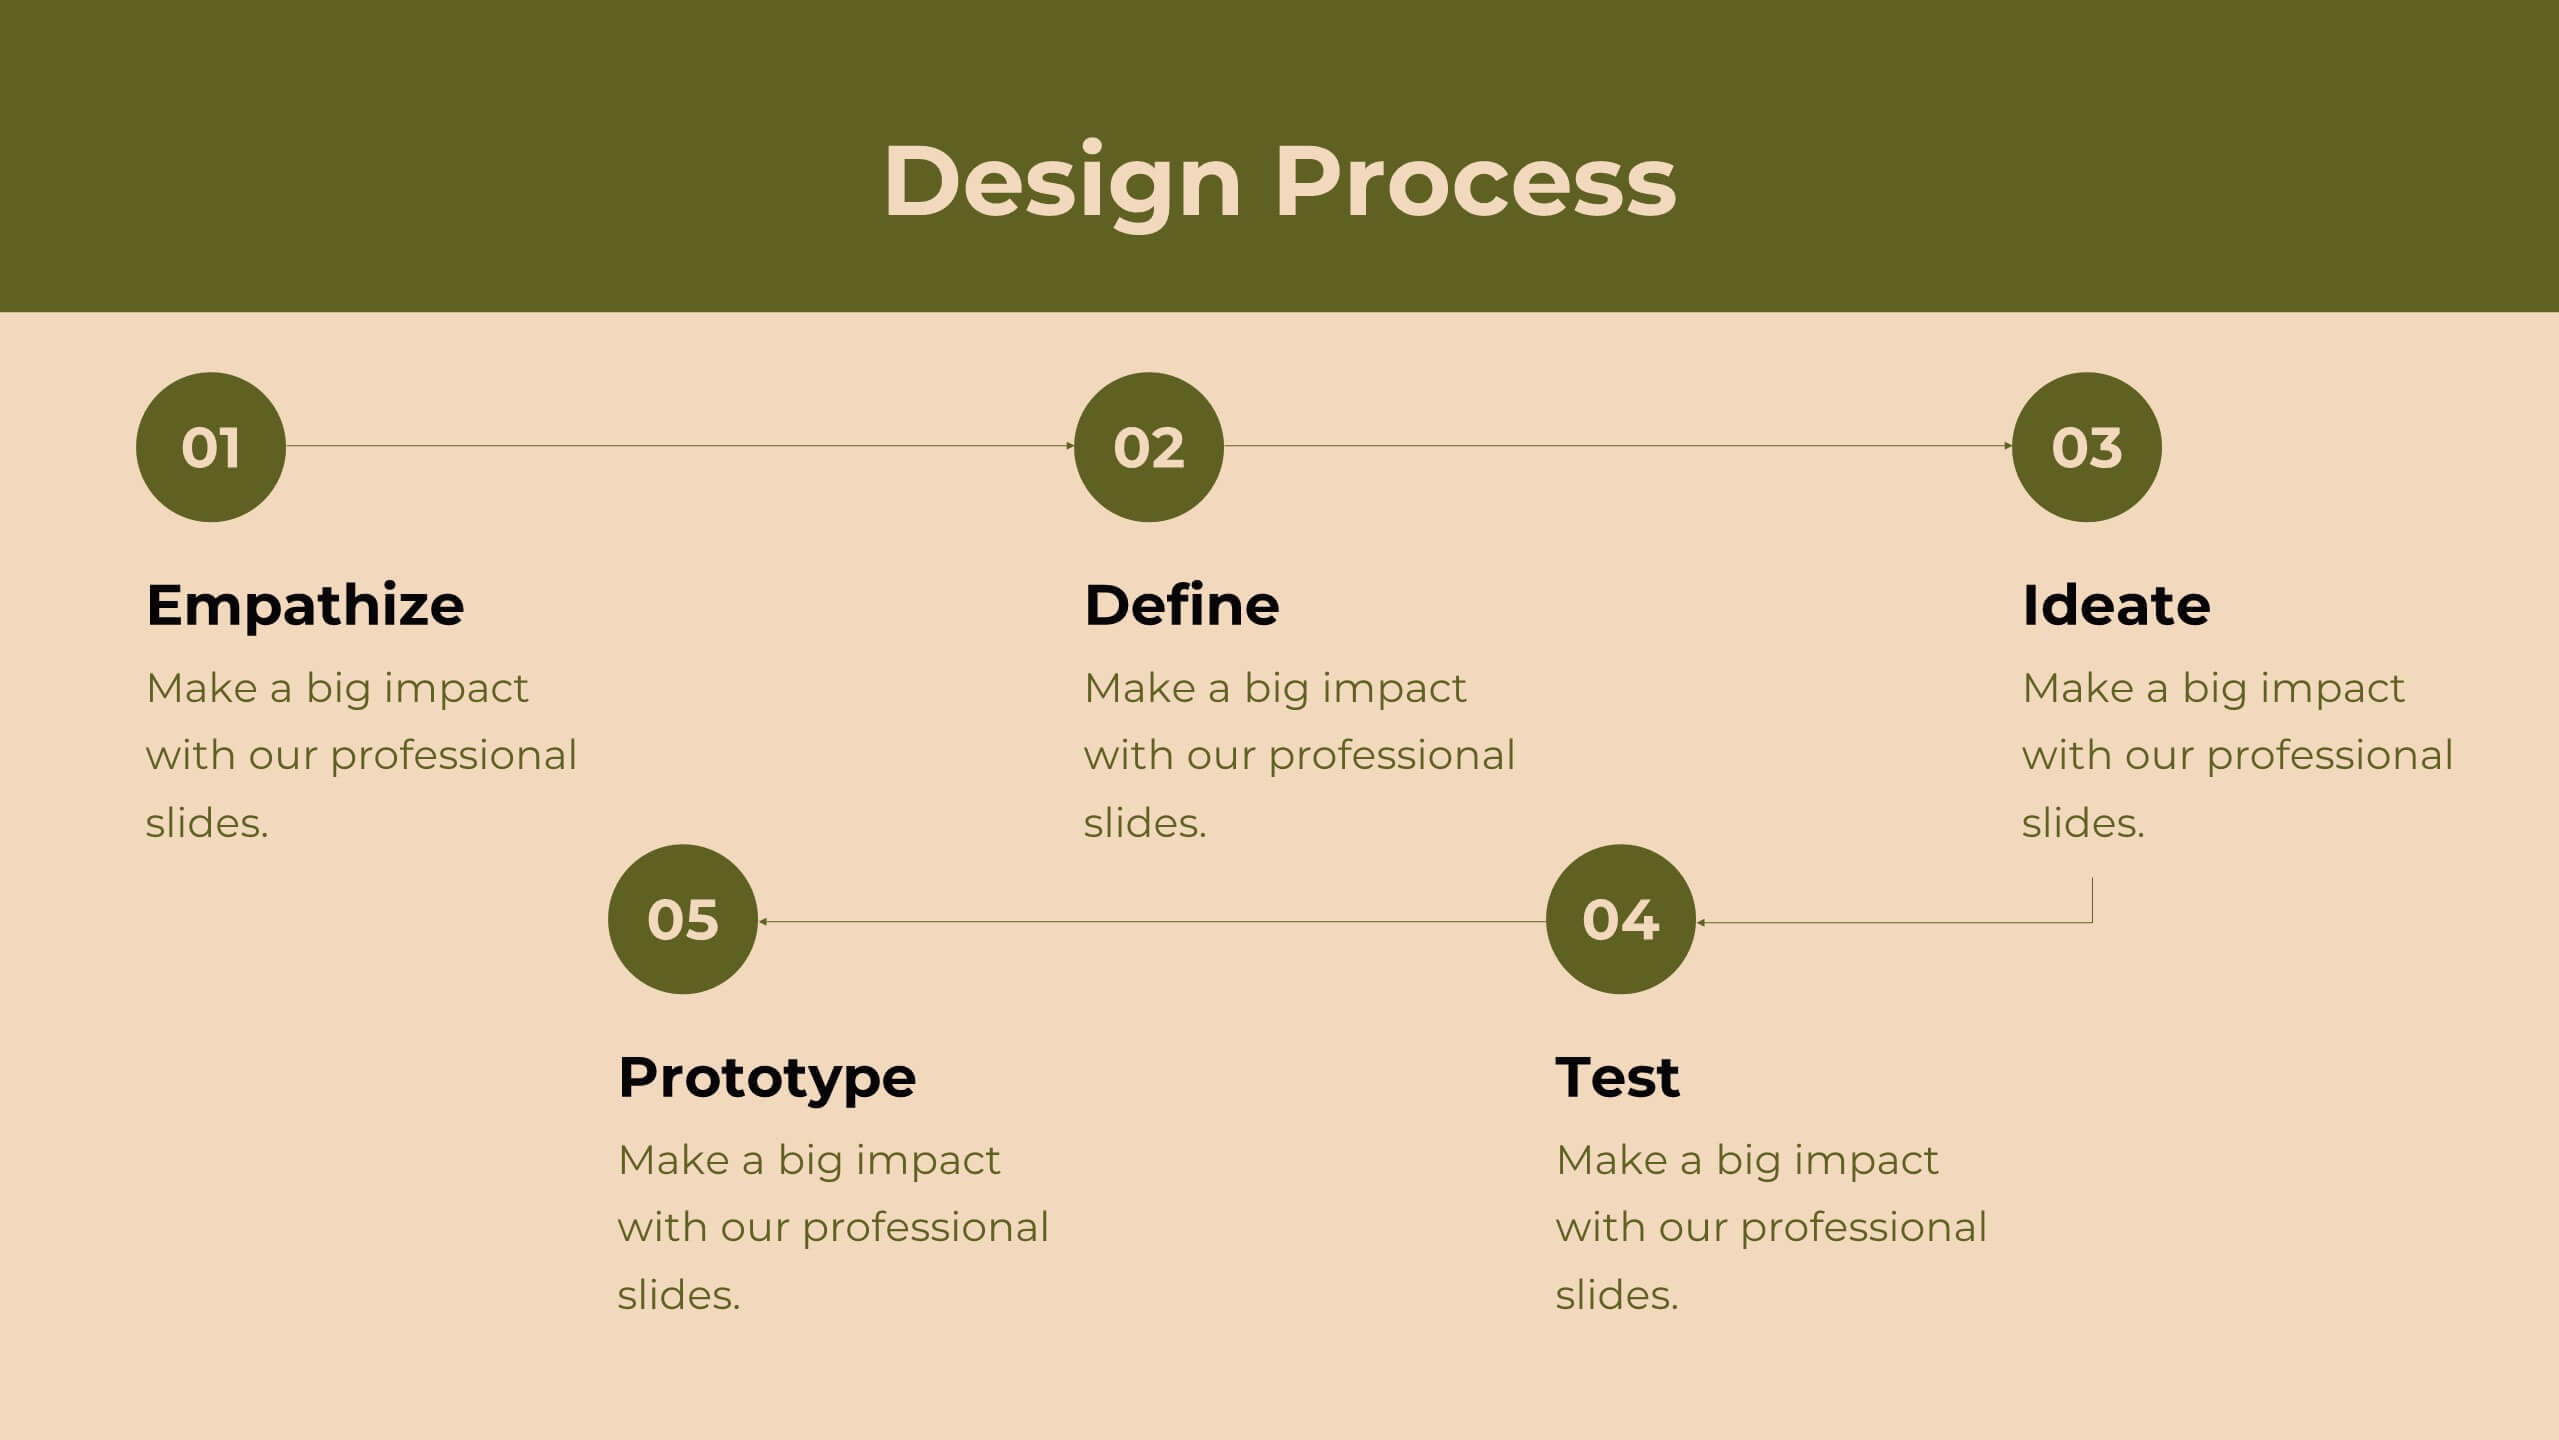
Delta Design Strategy Proposal Presentation
Transform your design strategy with this elegant proposal template! Perfect for presenting design briefs, target audience insights, and concept development. Ideal for designers and creative teams aiming to align vision and execution. Compatible with PowerPoint, Keynote, and Google Slides, this template ensures your design strategy is clear, professional, and compelling. Elevate your projects today!