


Features
- 6 Unique slides
- Fully editable and easy to edit in Microsoft Powerpoint, Keynote and Google Slides
- 16:9 widescreen layout
- Clean and professional designs
- Export to JPG, PDF or send by email


Do you have any questions?
Recommend


5 slides
Purpose-Driven Mission and Values Presentation
Present your organization’s core purpose and guiding principles with this Purpose-Driven Mission and Values presentation. This clean, flag-style layout is perfect for showcasing five key pillars such as integrity, collaboration, or innovation. Easily customizable in Canva, PowerPoint, or Google Slides to align with your brand.


22 slides
Vivid Creative Agency Pitch Deck Presentation
This sleek creative agency template is ideal for presenting your company's mission, services, and success stories. With a minimalist design, it offers a professional yet stylish approach to showcase case studies, industry trends, and partnership opportunities. It’s perfect for PowerPoint, Keynote, and Google Slides, making your agency stand out with every slide.


12 slides
Risk Management and Security Compliance Presentation
Enhance your organizational resilience with the 'Risk Management and Security Compliance' presentation template. This intuitive design helps you communicate complex compliance standards and risk mitigation strategies effectively. Ideal for training sessions, board meetings, and compliance audits, ensuring your team stays informed and proactive in managing risks.


5 slides
Marketing Strategy Wheel Diagram Presentation
Visualize your marketing framework in a clear and engaging way with this Marketing Strategy Wheel Diagram. Designed to highlight key components like audience targeting, communication channels, and campaign goals, this circular format brings strategy to life. Fully customizable and compatible with PowerPoint, Keynote, and Google Slides. Ideal for marketers, agencies, and branding professionals.


5 slides
Risk Mitigation Strategies
Visualize your risk response plan with this layered diagram that highlights five strategic levels of mitigation. Each tier features bold directional arrows guiding the viewer from risk source to solution, perfect for decision-makers, auditors, or risk managers. Fully editable and easy to adapt to any industry. Compatible with PowerPoint, Keynote, and Google Slides.


6 slides
Hierarchical Pyramid Model Presentation
Break down organizational structures or business strategies effectively with the Hierarchical Pyramid Model Presentation. This slide features a five-tier pyramid design, perfect for representing levels of authority, team structures, or sequential priorities. Each layer includes matching labels and icons for added clarity. Fully editable and compatible with PowerPoint, Keynote, and Google Slides.


4 slides
Wheel of Progress Planning Tool Presentation
Visualize goals, track development stages, or outline key initiatives with the Wheel of Progress Planning Tool Presentation. This dynamic circular design divides progress into four customizable quadrants (A–D), perfect for strategic planning, KPI tracking, or team milestone updates. Each segment features editable labels and supporting descriptions. Ideal for PowerPoint, Keynote, and Google Slides.


6 slides
Branching Structure Tree Chart Presentation
Visualize ideas, processes, or team structures with the Branching Structure Tree Chart Presentation. This elegant tree diagram layout allows you to display six key points or stages branching out naturally from a central concept. Ideal for organizational charts, decision flows, or brainstorming visuals. Fully editable in PowerPoint, Keynote, and Google Slides.


6 slides
Project Summary and Final Thoughts Presentation
Wrap up your presentation with clarity using the Project Summary and Final Thoughts Presentation. This clean, structured layout helps you highlight key milestones, insights, and takeaways across six points—perfect for recapping project goals and outcomes. Fully customizable and compatible with PowerPoint, Keynote, and Google Slides.


5 slides
Energy Sources in The United States Infographics
Energy Sources in The United States Infographics is a bold, colorful, and modern presentation


5 slides
Iceberg Model Infographics
Introducing our Iceberg Model Infographic, this is a visual representation of the Iceberg Model which is a metaphor for understanding a problem or issue. It is based on the idea that just like an iceberg, only a small portion of the problem or issue is visible on the surface, while the majority of it lies beneath. In this vertical infographic use the top visible part of the iceberg to represent the things that are easily observed, and the larger hidden part of the iceberg can be the underlying causes or factors that are not easily visible. This is designed to help people understand the complexity of a problem and encourage them to look beyond the surface level.


4 slides
Mirror Data Distribution Butterfly Format Presentation
Present side-by-side comparisons with clarity using the Mirror Data Distribution Butterfly Format Presentation. This layout helps visualize balanced data sets, performance comparisons, or goal vs. outcome metrics with mirrored bars and intuitive icons. Fully customizable in Canva, PowerPoint, Google Slides, and Keynote to match your brand's aesthetic and message.


6 slides
Actionable Steps with Visual Checklist Presentation
Simplify complex processes with the Actionable Steps with Visual Checklist Presentation. This engaging layout uses a curved flow and bold circular icons to represent each step in a clear, logical sequence. Ideal for outlining strategic plans, onboarding procedures, or milestone-driven workflows. With five customizable steps and tick-mark visuals, it's easy to showcase completed and pending tasks. Fully compatible with PowerPoint, Keynote, and Google Slides—great for any team-driven or instructional presentation.


21 slides
Parthenon Marketing Proposal Template Presentation
Create an impactful marketing proposal with this vibrant and modern presentation template! Covering key sections such as industry overview, consumer behavior, social media strategies, and emerging technologies, it helps you present your marketing insights with style. Fully customizable and perfect for data-driven marketing plans, this template is compatible with PowerPoint, Keynote, and Google Slides for seamless presentation delivery.


21 slides
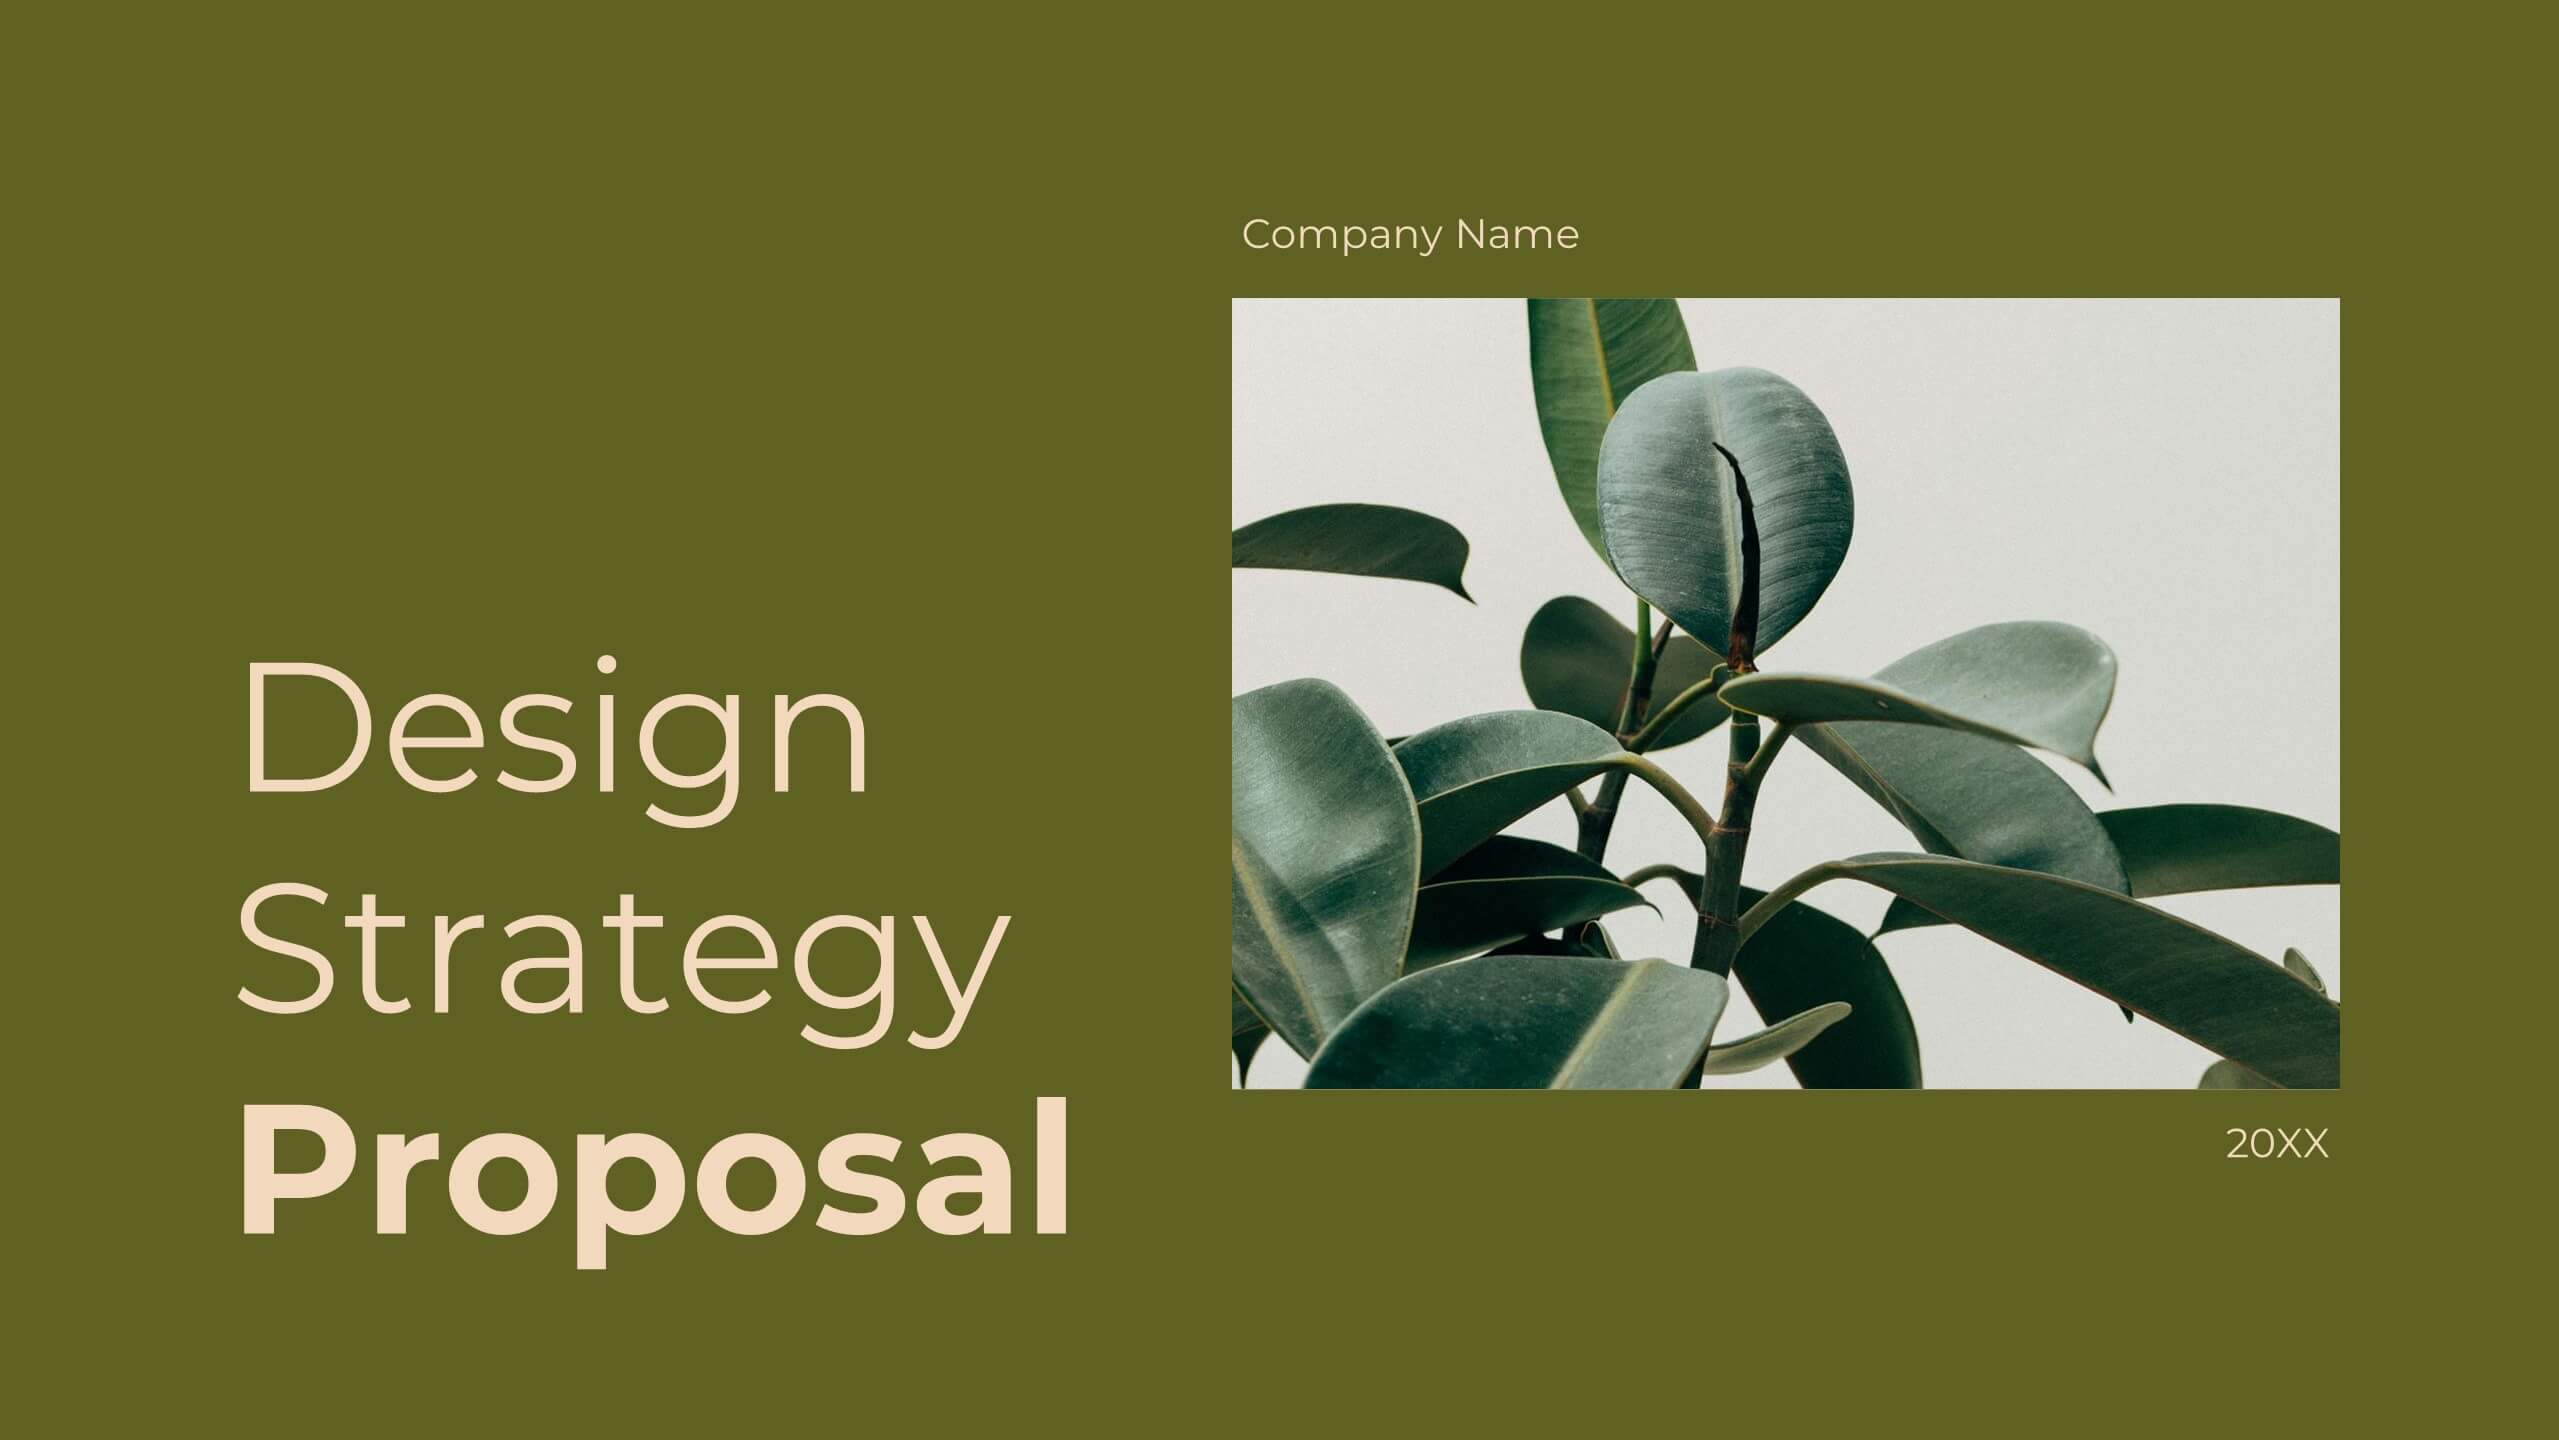
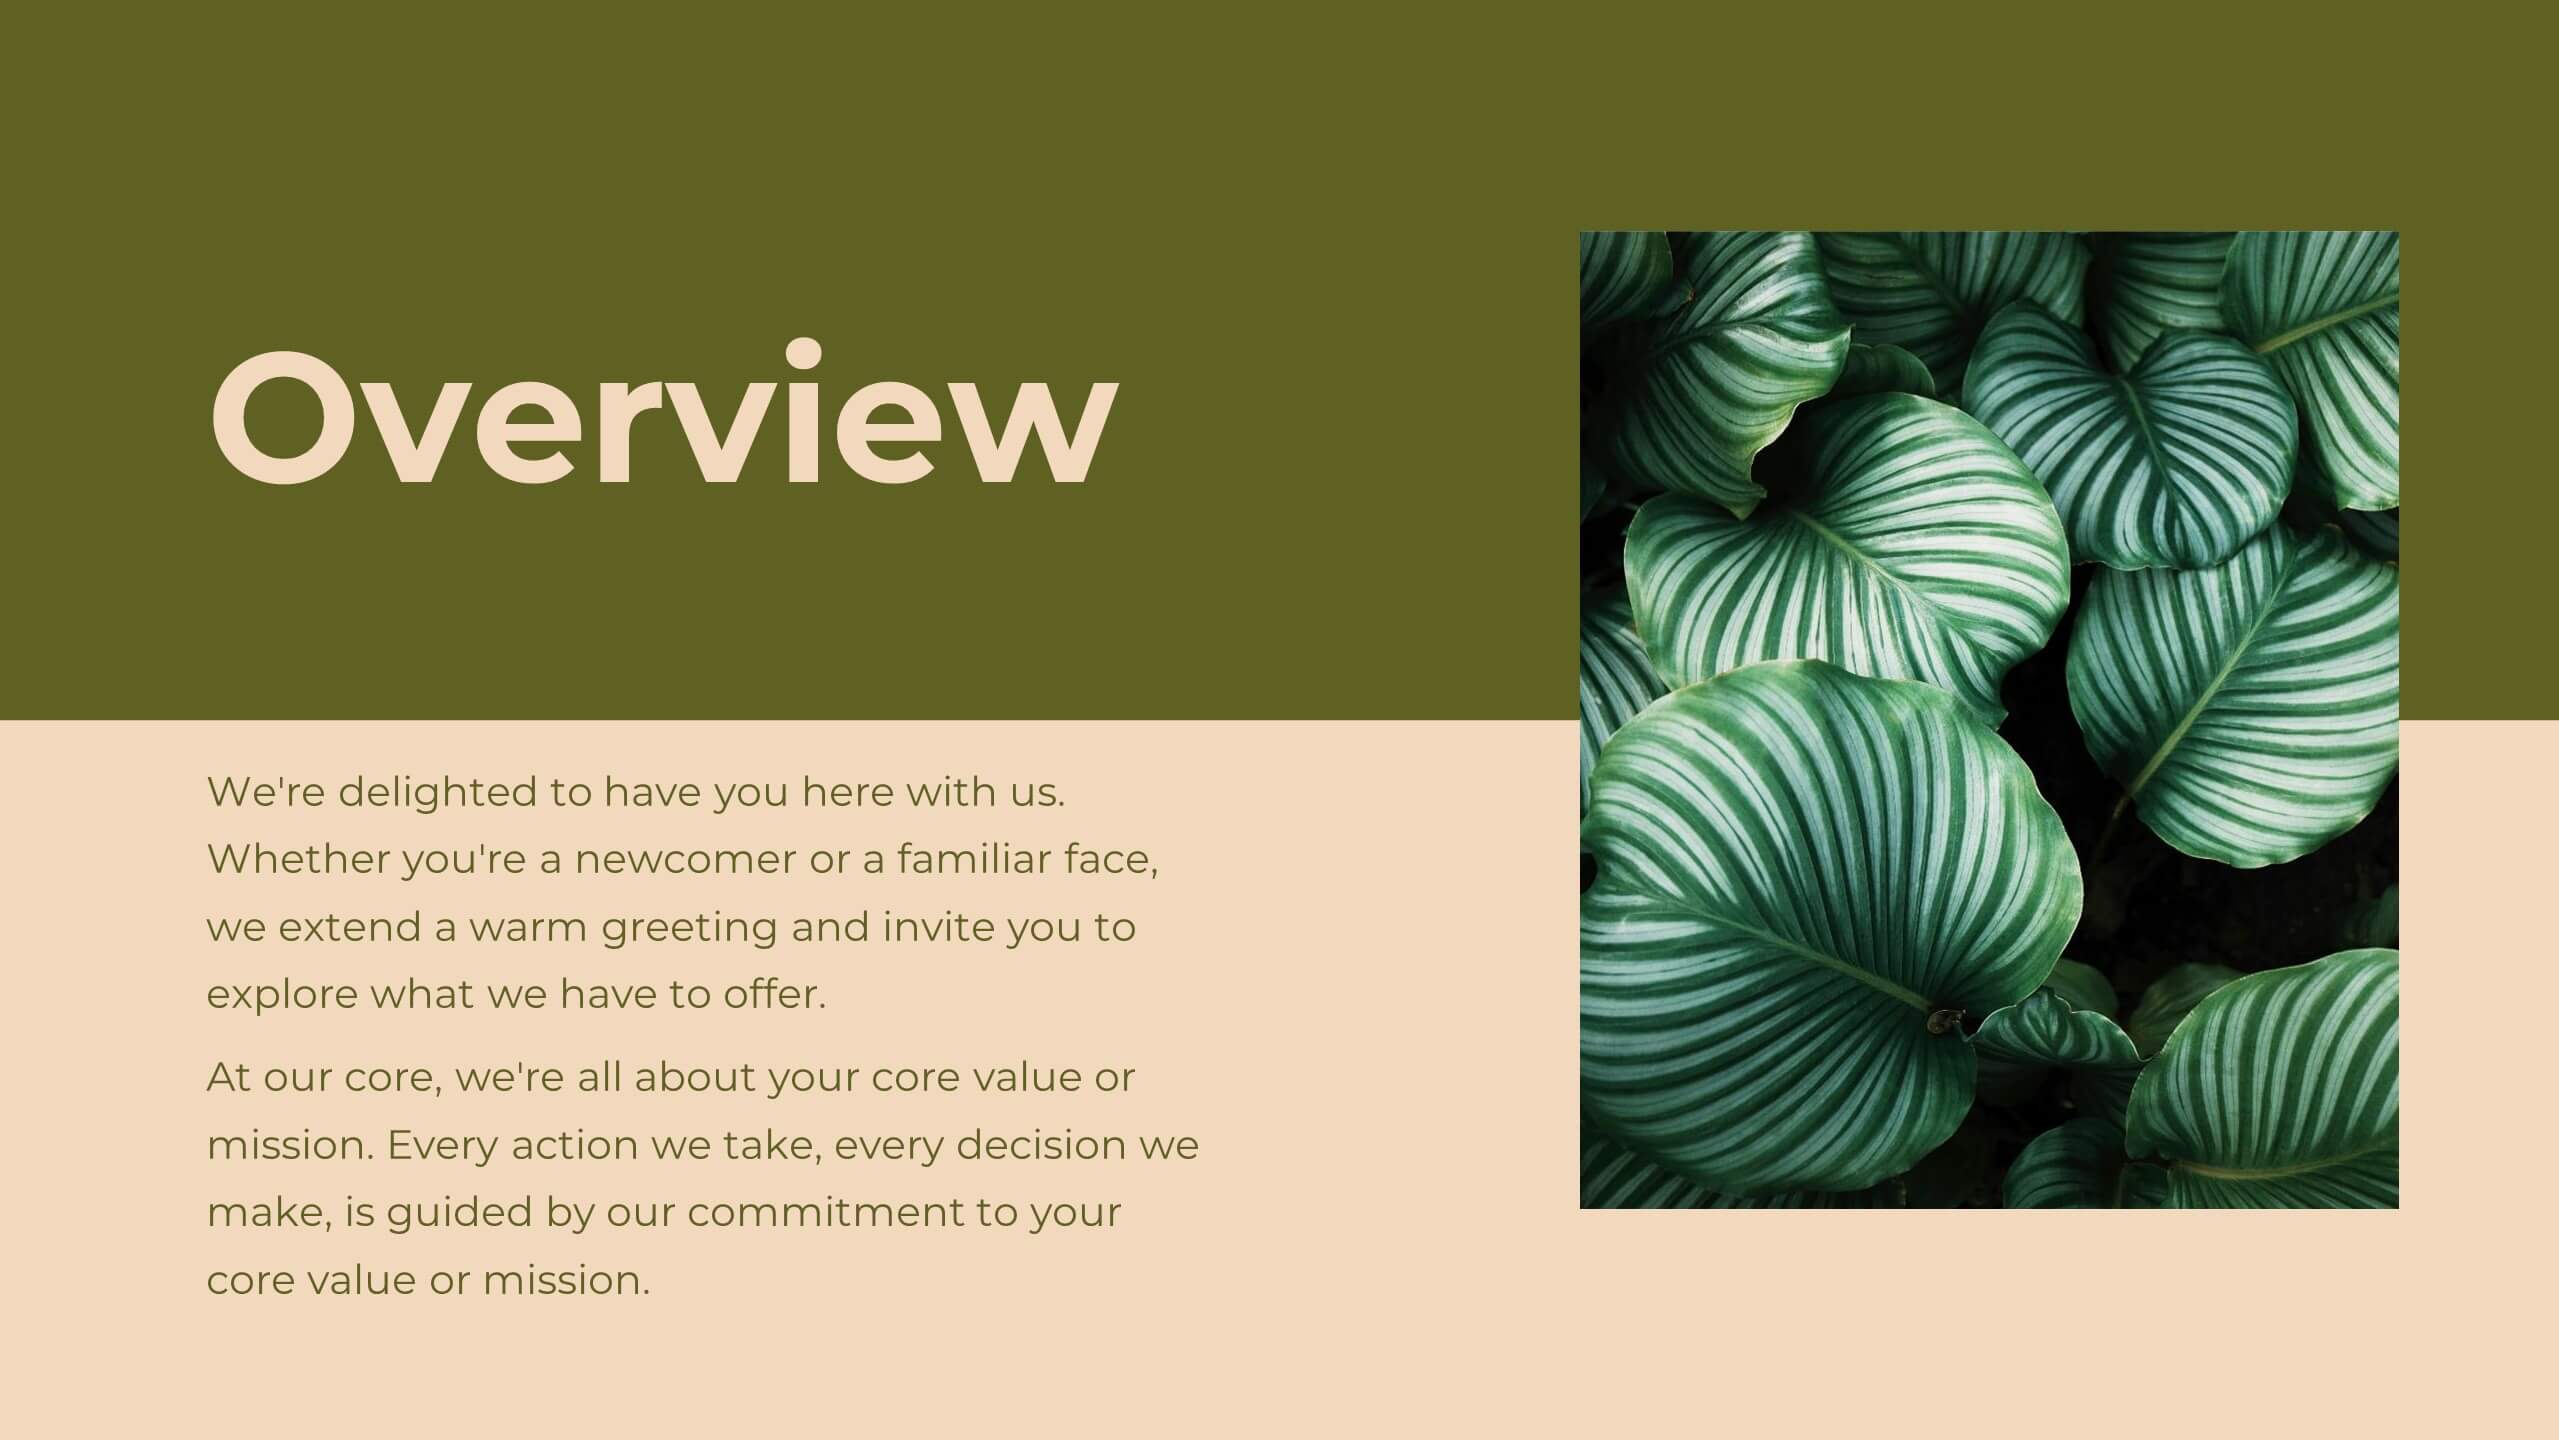
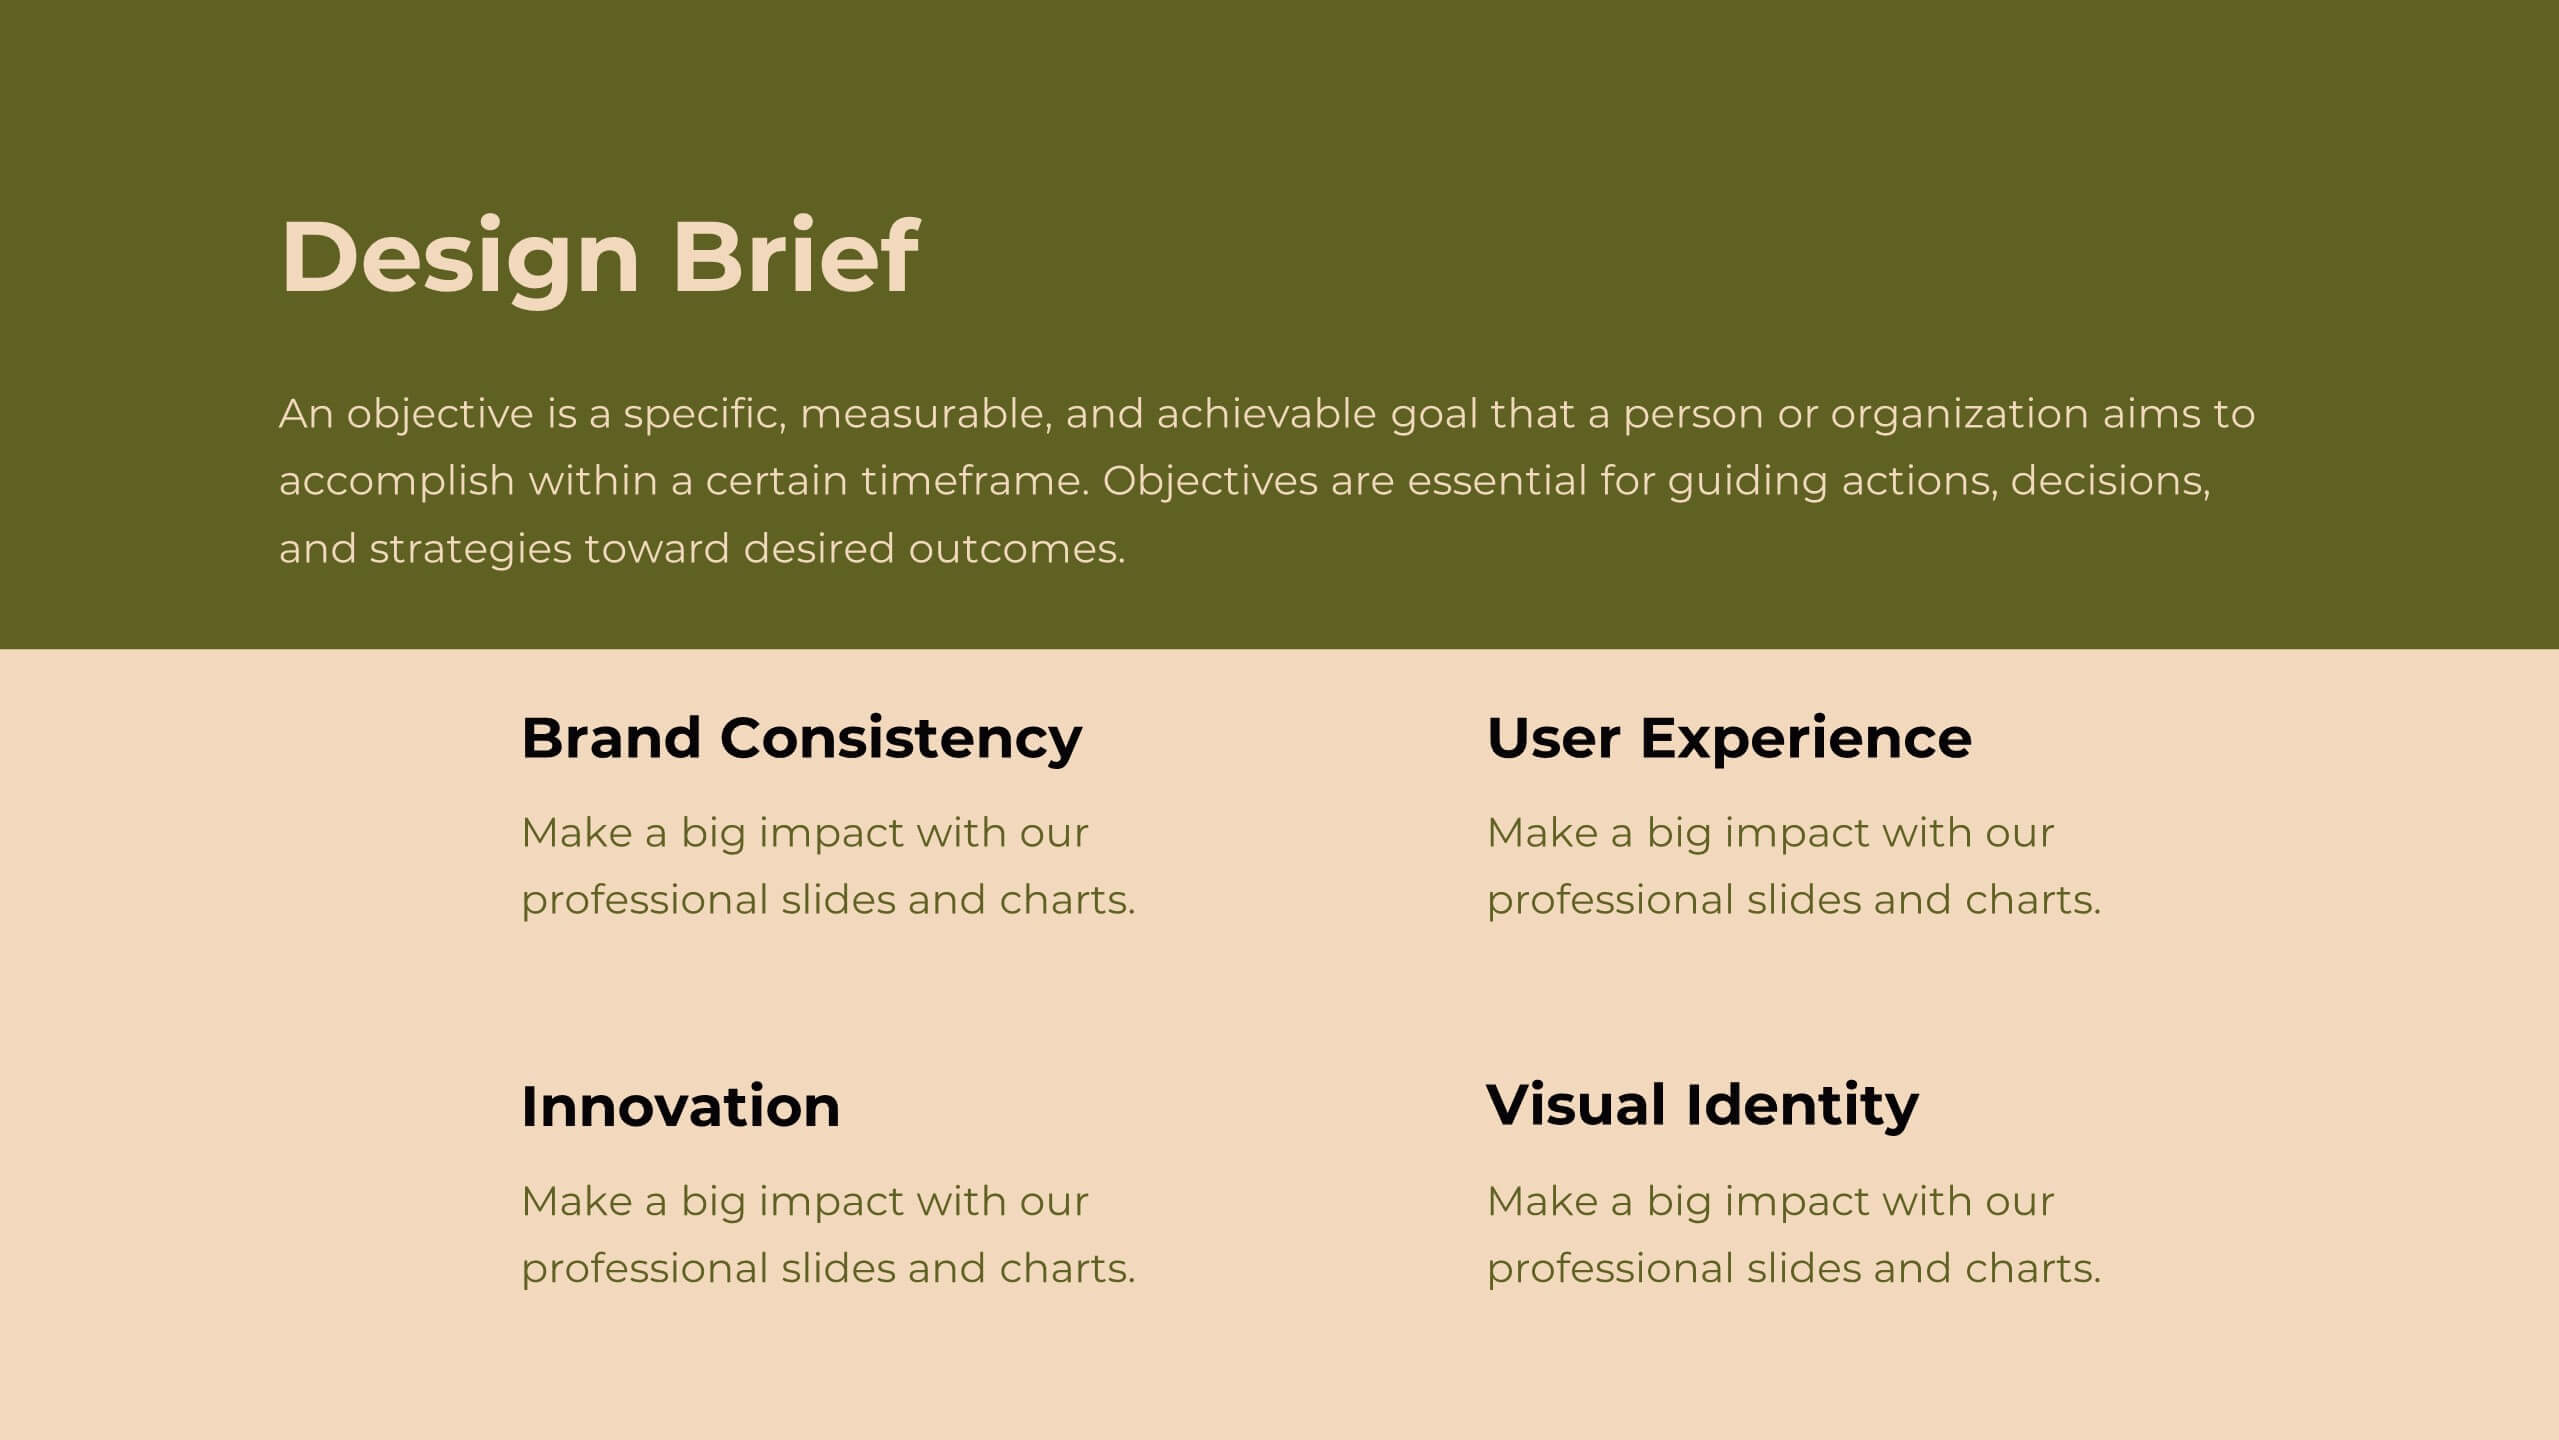
Delta Design Strategy Proposal Presentation
Transform your design strategy with this elegant proposal template! Perfect for presenting design briefs, target audience insights, and concept development. Ideal for designers and creative teams aiming to align vision and execution. Compatible with PowerPoint, Keynote, and Google Slides, this template ensures your design strategy is clear, professional, and compelling. Elevate your projects today!


22 slides
Crystal Business Plan Presentation
This business plan template is ideal for presenting strategies, conference overviews, and session details. With slides for keynote speakers, breakout sessions, and networking breaks, it offers a dynamic and professional layout. Compatible with PowerPoint, Keynote, and Google Slides, it ensures a clear and organized flow for any business presentation.


7 slides
Geometric Sequence Infographic Presentation
Geometric infographics typically involve the use of various shapes to convey different pieces of information. This Geometric Template is a professional way to show your great designworks and ideas. This template can be used in a variety of contexts, from business and marketing to education and journalism. This clean design includes many categories, dividers and icons which will help you show your data in the best way. Start creating your own customized presentation by adding your text, images and other content from your slides, just download in PowerPoint, Keynote or Google Slides.