


Features
- 20 Unique slides
- Fully editable and easy to edit in Microsoft Powerpoint, Keynote and Google Slides
- 16:9 widescreen layout
- Clean and professional designs
- Export to JPG, PDF or send by email


Do you have any questions?
Recommend


5 slides
Employee Feedback Survey Report Presentation
Deliver clear insights into team sentiment with this employee rating slide. Designed with star rating visuals and thumbs-up iconography, it's perfect for showcasing staff satisfaction, engagement, and performance reviews. Easy to customize in PowerPoint, Keynote, and Google Slides.


5 slides
Decision Matrix Presentation
Make tough choices feel simple with this clear, color-coded layout designed to compare options side-by-side. This presentation helps you evaluate criteria, score alternatives, and present well-structured reasoning with confidence. Clean, intuitive, and fully editable. Compatible with PowerPoint, Keynote, and Google Slides.


6 slides
Business Framework Strategy Presentation
Dive into strategic planning with our Business Framework Strategy presentation template. This design brilliantly visualizes the essentials of business frameworks, guiding users through critical insights with a visually appealing, color-coded process. Ideal for strategists and planners, it offers a streamlined way to present complex information effectively. Compatible with PowerPoint, Keynote, and Google Slides, this template is a versatile tool for delivering impactful business strategies.


26 slides
Quantum Computing Presentation
Step into the future of technology with this fascinating presentation on quantum computing. Covering key concepts like quantum bits, superposition, entanglement, and real-world applications, this template helps simplify complex ideas for any audience. Fully customizable and compatible with PowerPoint, Keynote, and Google Slides for a seamless and insightful presentation experience.


8 slides
Customer Survey Results Analysis Presentation
Visualize feedback clearly and confidently with this dynamic results breakdown template. Featuring circular percentage graphics around a central report icon, this slide is ideal for presenting survey insights, NPS metrics, or user feedback summaries. Fully editable in PowerPoint, Keynote, and Google Slides.


4 slides
Green Initiatives & Climate Strategy Presentation
Highlight your sustainability roadmap with the Green Initiatives & Climate Strategy Presentation. Designed with a quadrant tree layout, this slide communicates four key environmental focus areas. Ideal for eco-friendly proposals, CSR updates, or climate reports. Fully customizable in PowerPoint, Keynote, and Google Slides—perfect for green strategies, goals, or impact summaries.


4 slides
Corporate Governance Structure Presentation
Build transparency and leadership clarity with this clean, layered presentation layout that visualizes company hierarchies and decision-making systems. Ideal for explaining organizational roles, responsibilities, and reporting flows, it simplifies complex structures into easy visuals. Fully editable and compatible with PowerPoint, Keynote, and Google Slides for professional, flexible use.


5 slides
Annual Achievements and Highlights Presentation
Celebrate your progress with the Annual Achievements and Highlights Presentation. This timeline-style layout guides viewers along a visual path of milestones year by year. Each pin represents a key accomplishment, backed by icons and editable text for context. Perfect for end-of-year reviews or company retrospectives. Compatible with PowerPoint, Google Slides, and Canva.


6 slides
Central Idea Spider Layout Presentation
Bring your big idea to life with a sleek, organized layout that keeps every supporting point perfectly connected. This presentation is ideal for mapping strategies, goals, or project concepts in a clear, visual way. Fully customizable and compatible with PowerPoint, Keynote, and Google Slides for effortless editing.


23 slides
Infinitum Business Plan Presentation
Present your ideas with confidence using this sleek and professional business plan presentation template. Designed for entrepreneurs, startups, and business professionals, this template offers a clear structure to articulate your vision, strategy, and goals effectively. Featuring sections for executive summaries, SWOT analysis, market research, and financial forecasts, this template ensures every detail is covered. Visually engaging charts, graphs, and infographics make data presentation straightforward and compelling. Team profiles, product highlights, and future projections allow you to showcase your competitive edge. Fully editable in PowerPoint, Google Slides, and Keynote, this template is easy to adapt to your branding and business requirements. With its modern design and structured format, it’s perfect for pitching to investors, stakeholders, or clients. Make an impact and leave a lasting impression with this versatile and comprehensive business plan presentation tool.


4 slides
Team and Department Setup Structure Presentation
Organize your team with clarity using the Team and Department Setup Structure Presentation. This template is perfect for showcasing internal team hierarchies, departmental layouts, or functional groupings in a clean and professional layout. Each slide is fully customizable, allowing you to edit icons, titles, and structure to suit your organization. Compatible with Canva, PowerPoint, Keynote, and Google Slides.


6 slides
Environmental Ecology Report Presentation
Bring sustainability to life with a clear, refreshing design that makes complex environmental insights easy to share. This presentation helps you explain key ecological data, conservation efforts, and resource impact using simple visuals and structured points. Perfect for reports or awareness talks. Fully compatible with PowerPoint, Keynote, and Google Slides.


21 slides
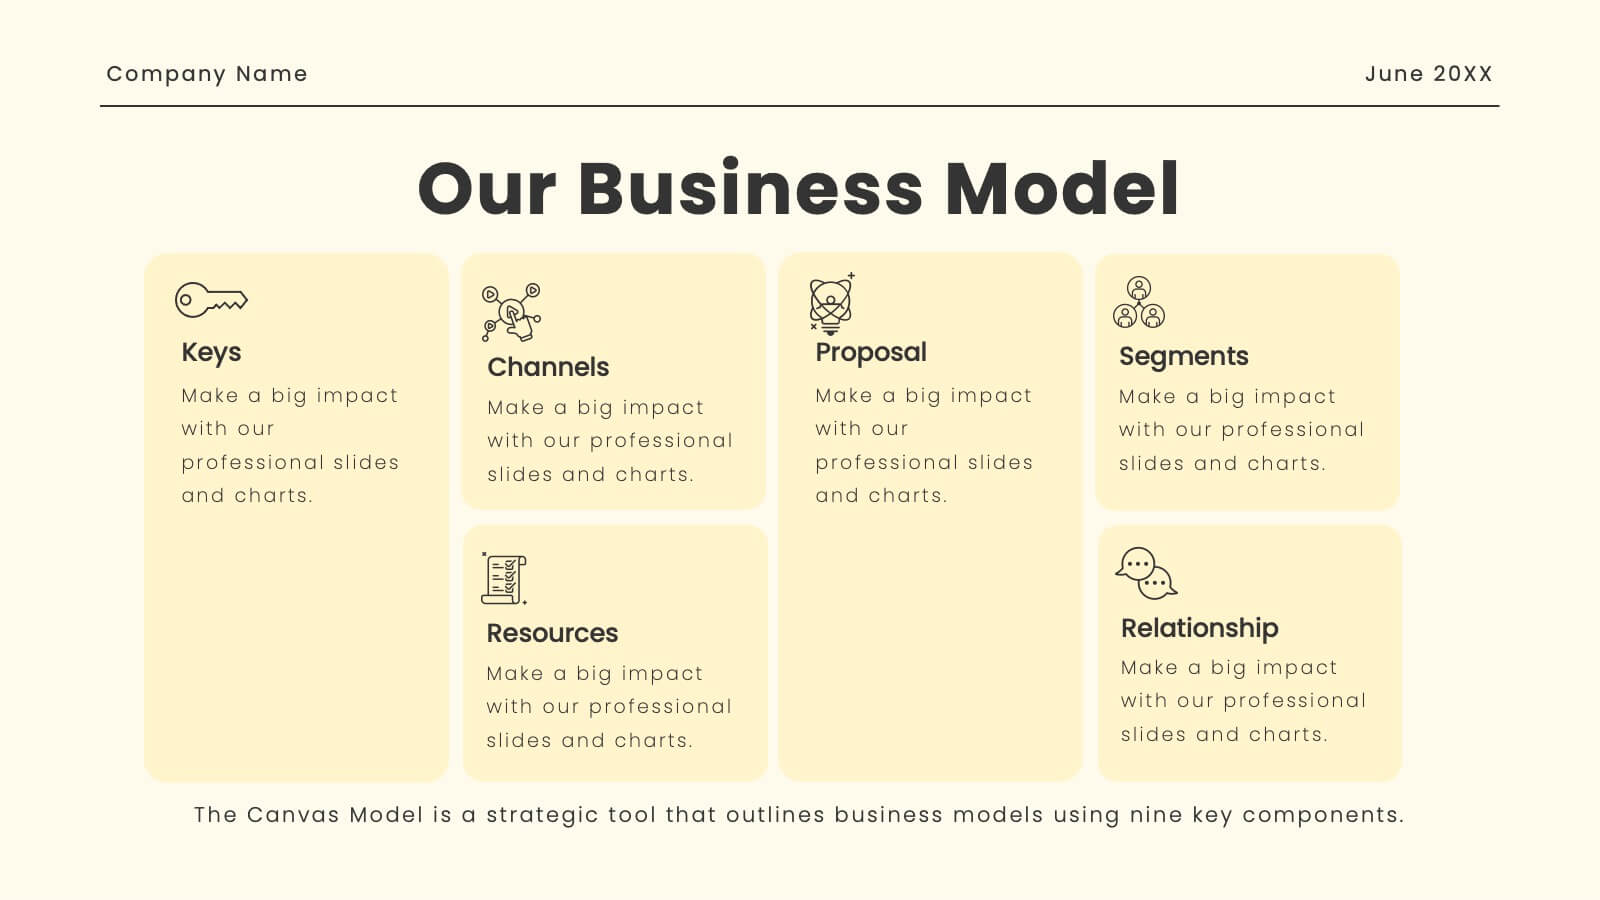
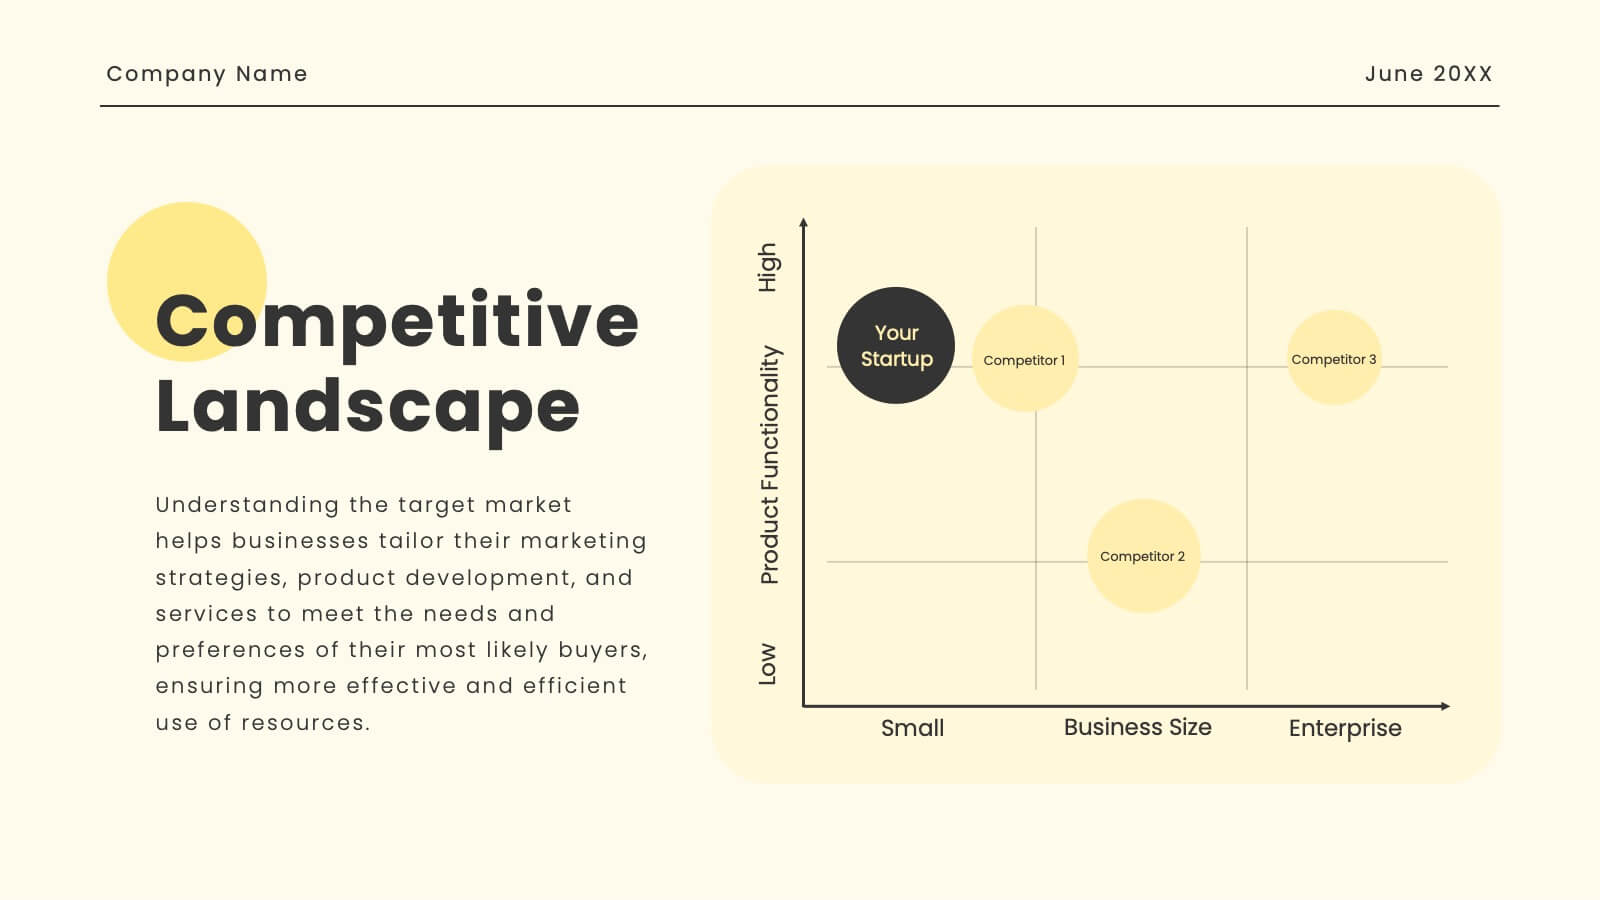
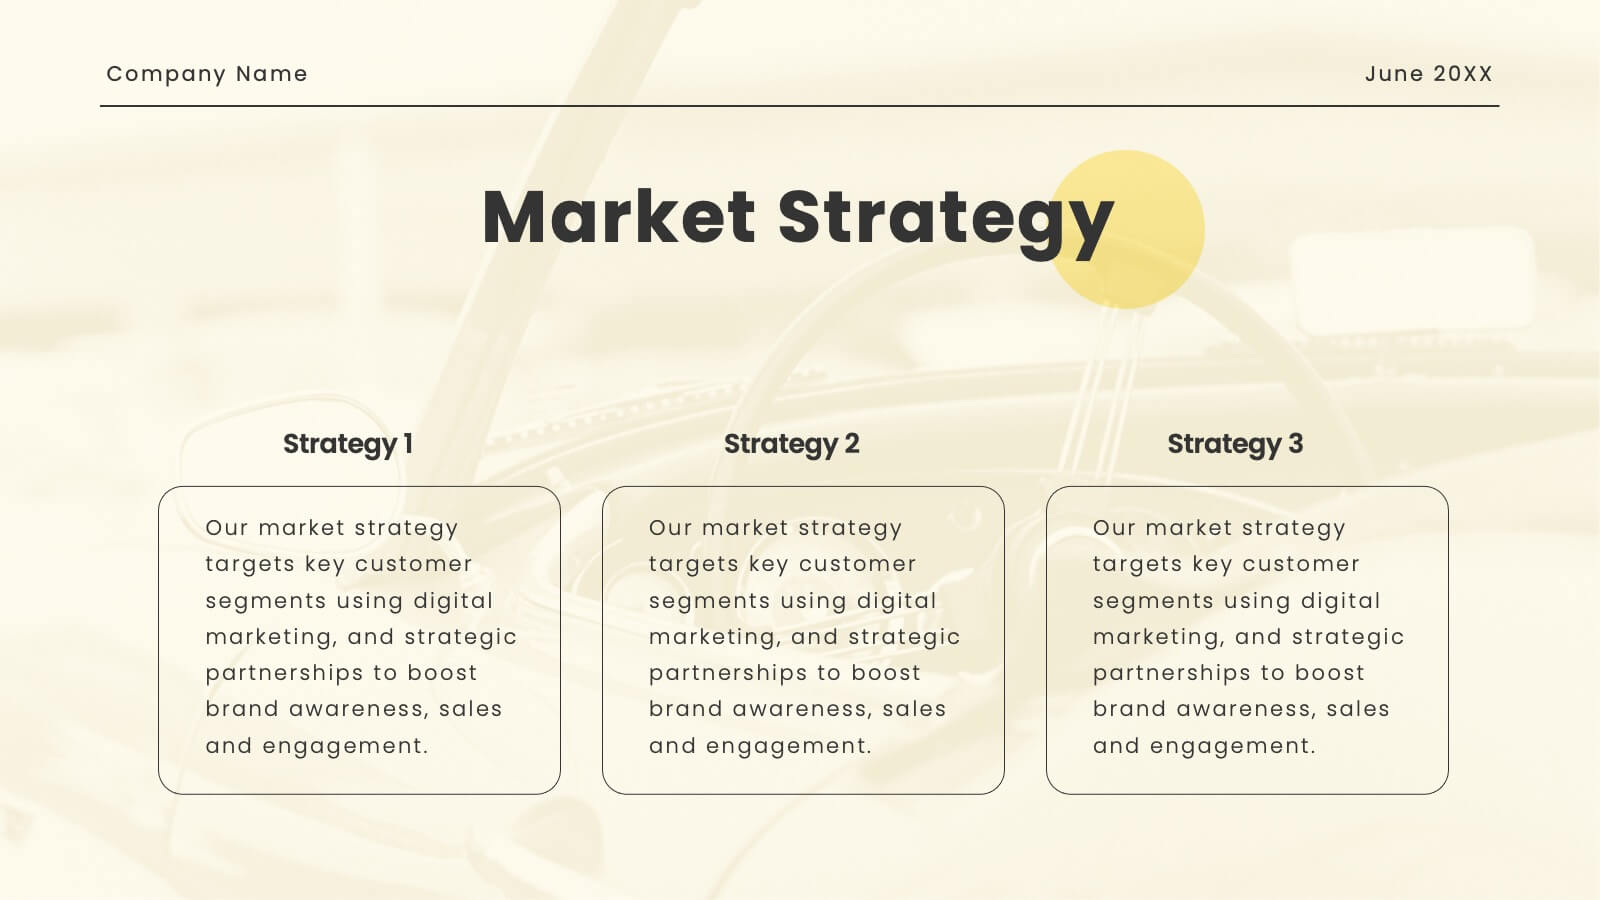
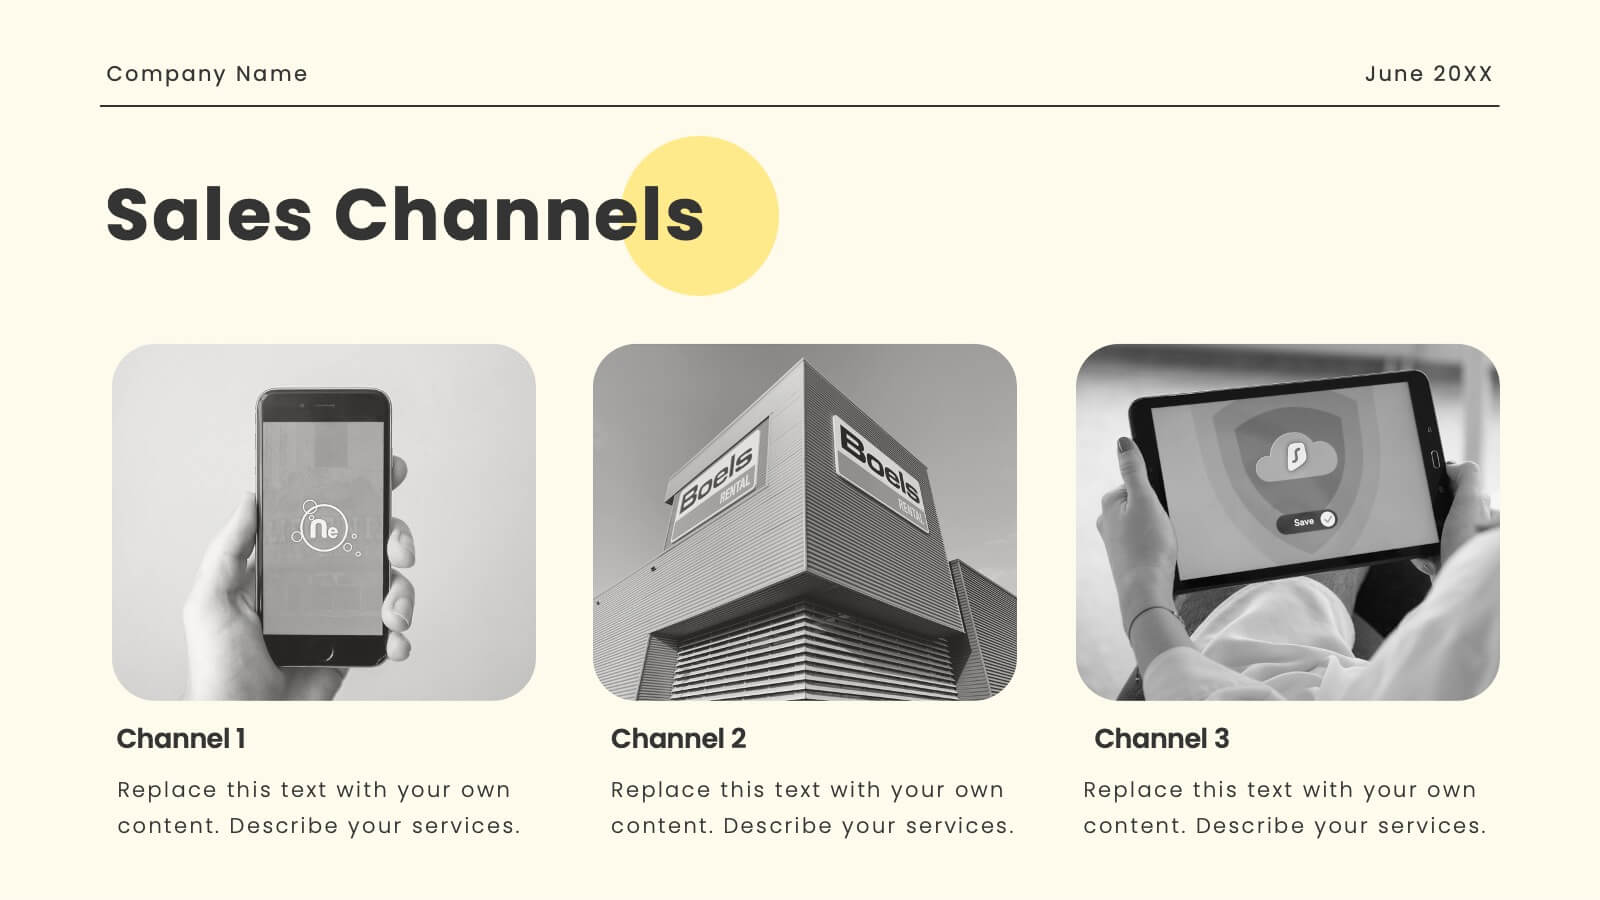
Oasis Startup Business Plan Presentation
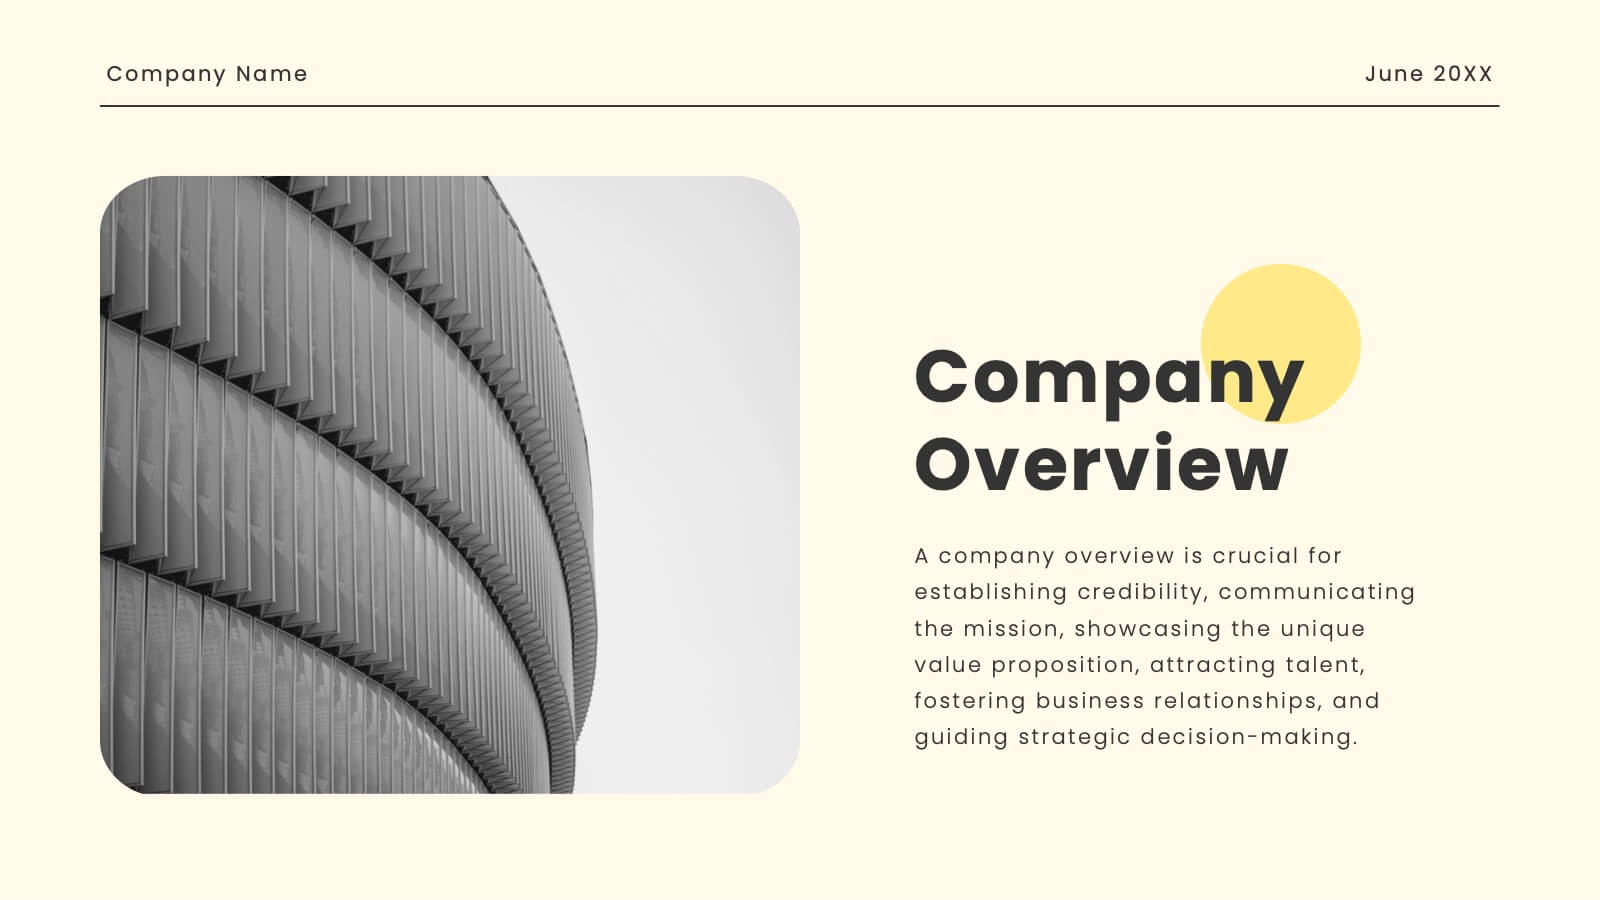
Present your corporate business plan with confidence! This template includes sections for company overview, mission, vision, services, target market, and more. Showcase your market strategy, sales channels, growth plan, and financial overview. Perfect for conveying a professional and comprehensive business plan. Compatible with PowerPoint, Keynote, and Google Slides. Impress your audience today!


26 slides
Digital Art Tools and Techniques Presentation
Unleash your creativity with this vibrant presentation on digital art tools and techniques. Covering essential topics like graphic design software, digital brushes, layering methods, and creative workflows, this template helps artists and designers enhance their skills. Fully customizable and compatible with PowerPoint, Keynote, and Google Slides for a seamless and visually stunning presentation experience.


6 slides
Innovative Design Thinking Steps Presentation
Bring structure to creativity with a bold, modern layout that walks your audience through each phase of innovation. Perfect for showcasing processes, strategy development, or brainstorming frameworks, this presentation makes complex ideas feel simple and engaging. Fully compatible with PowerPoint, Keynote, and Google Slides for effortless editing and presentation.


21 slides
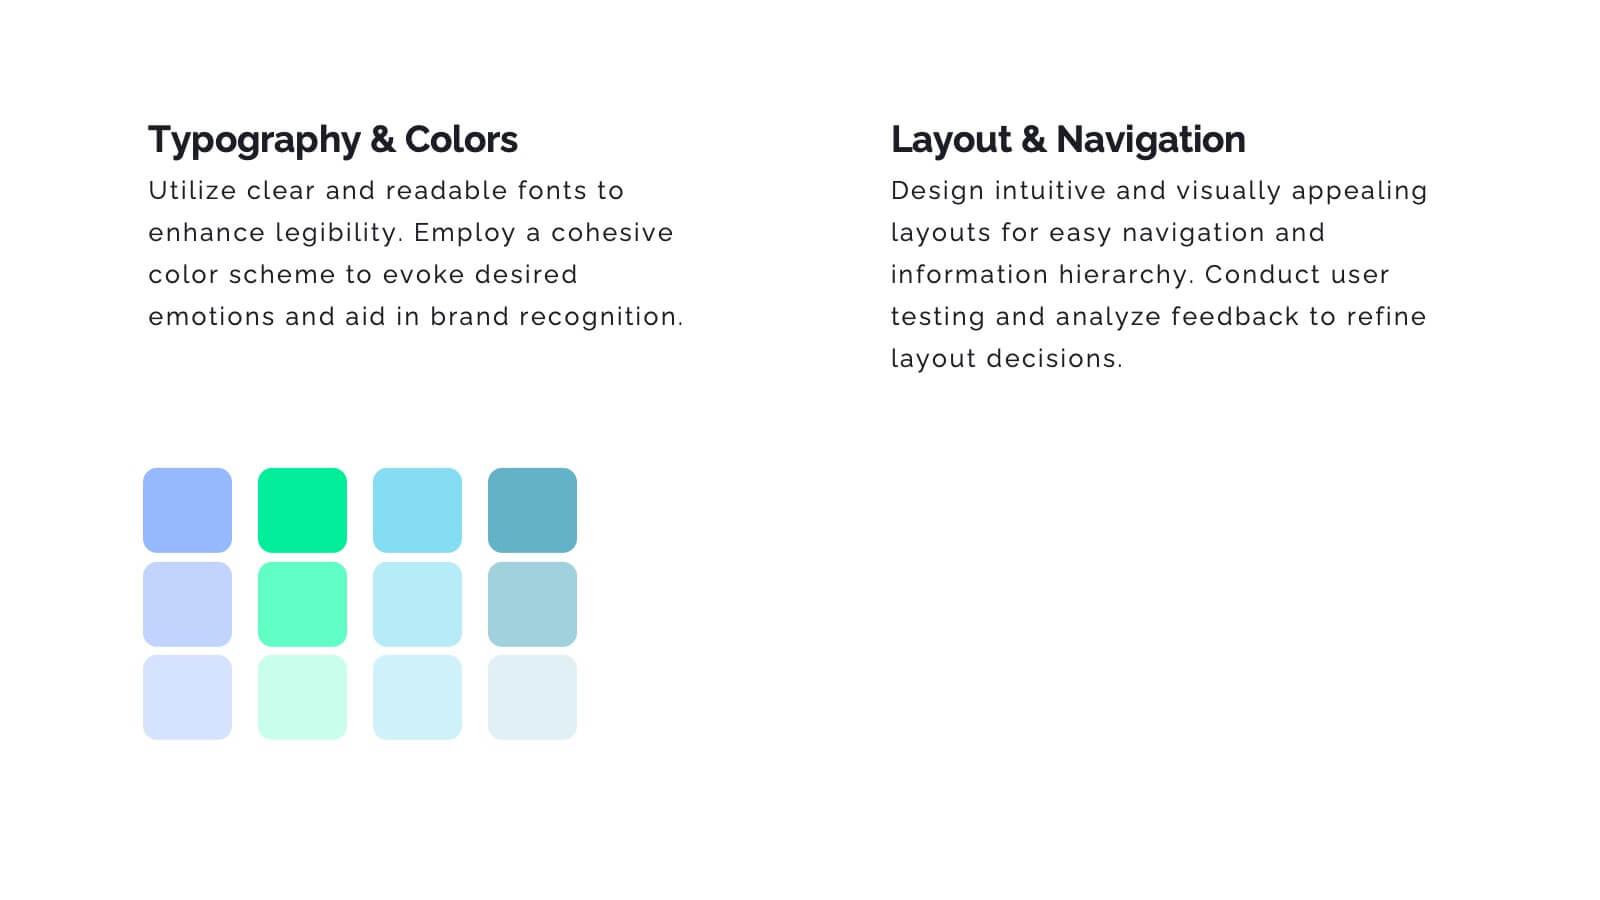
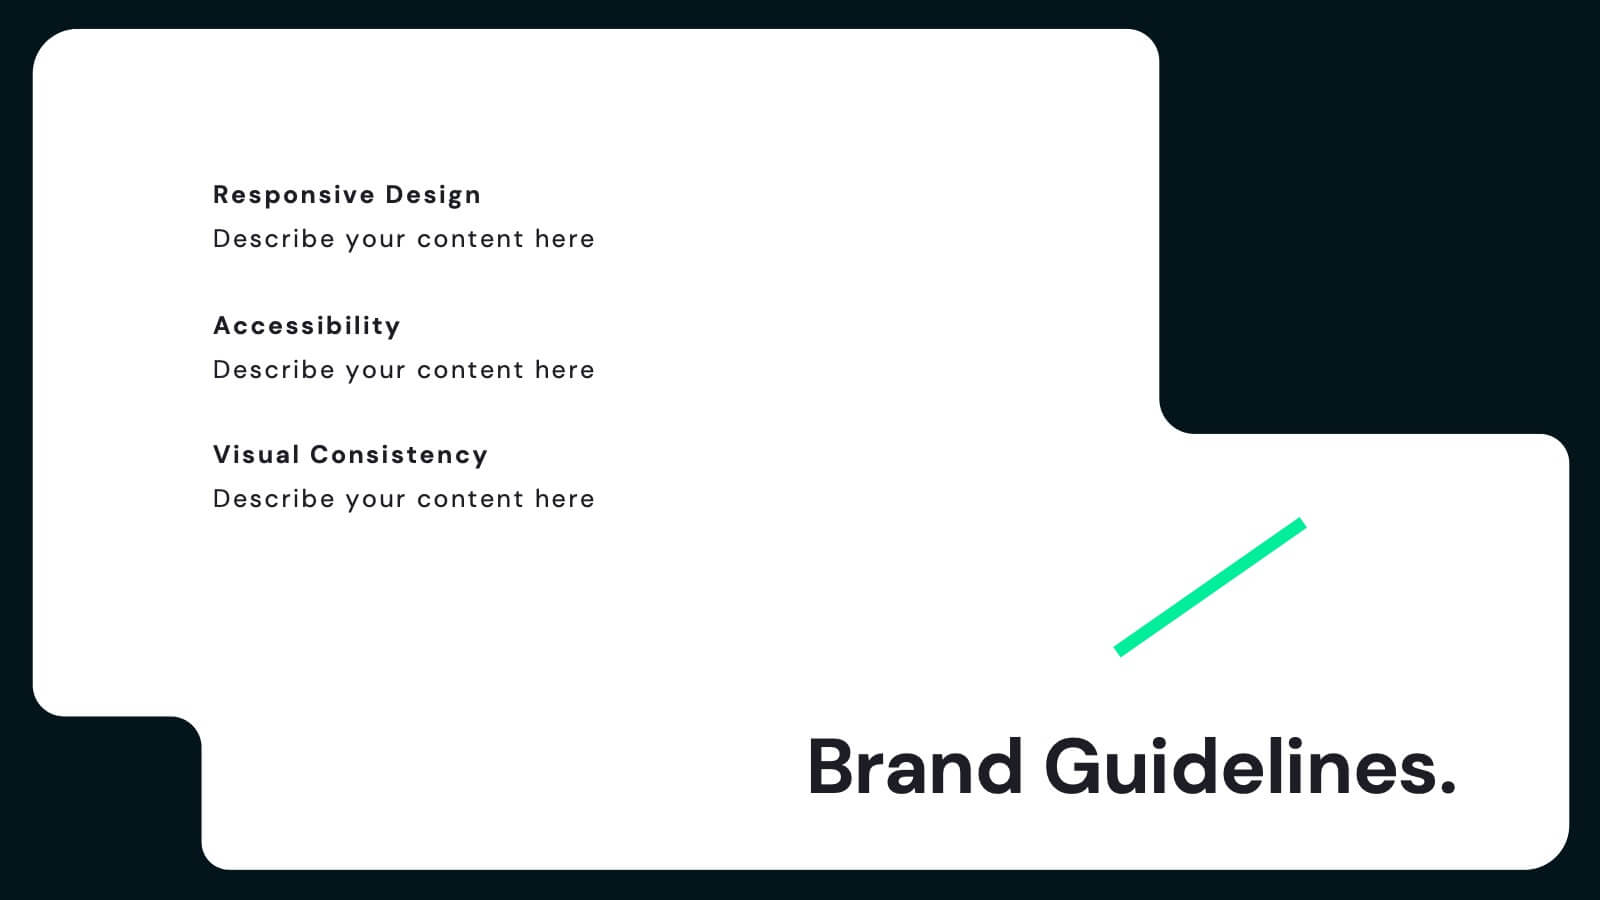
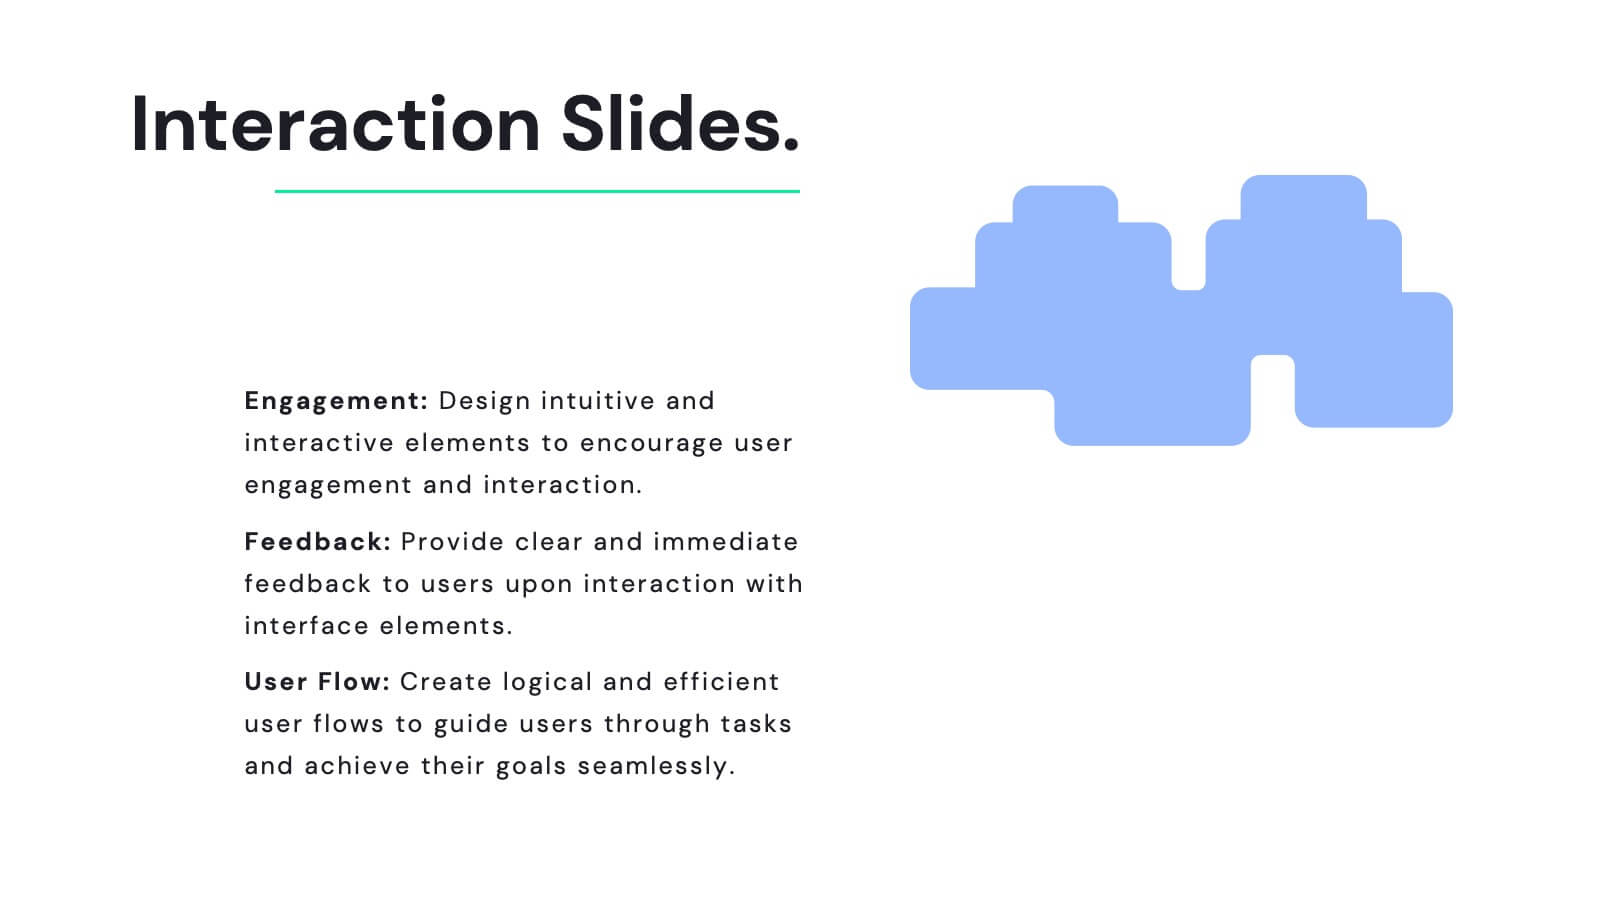
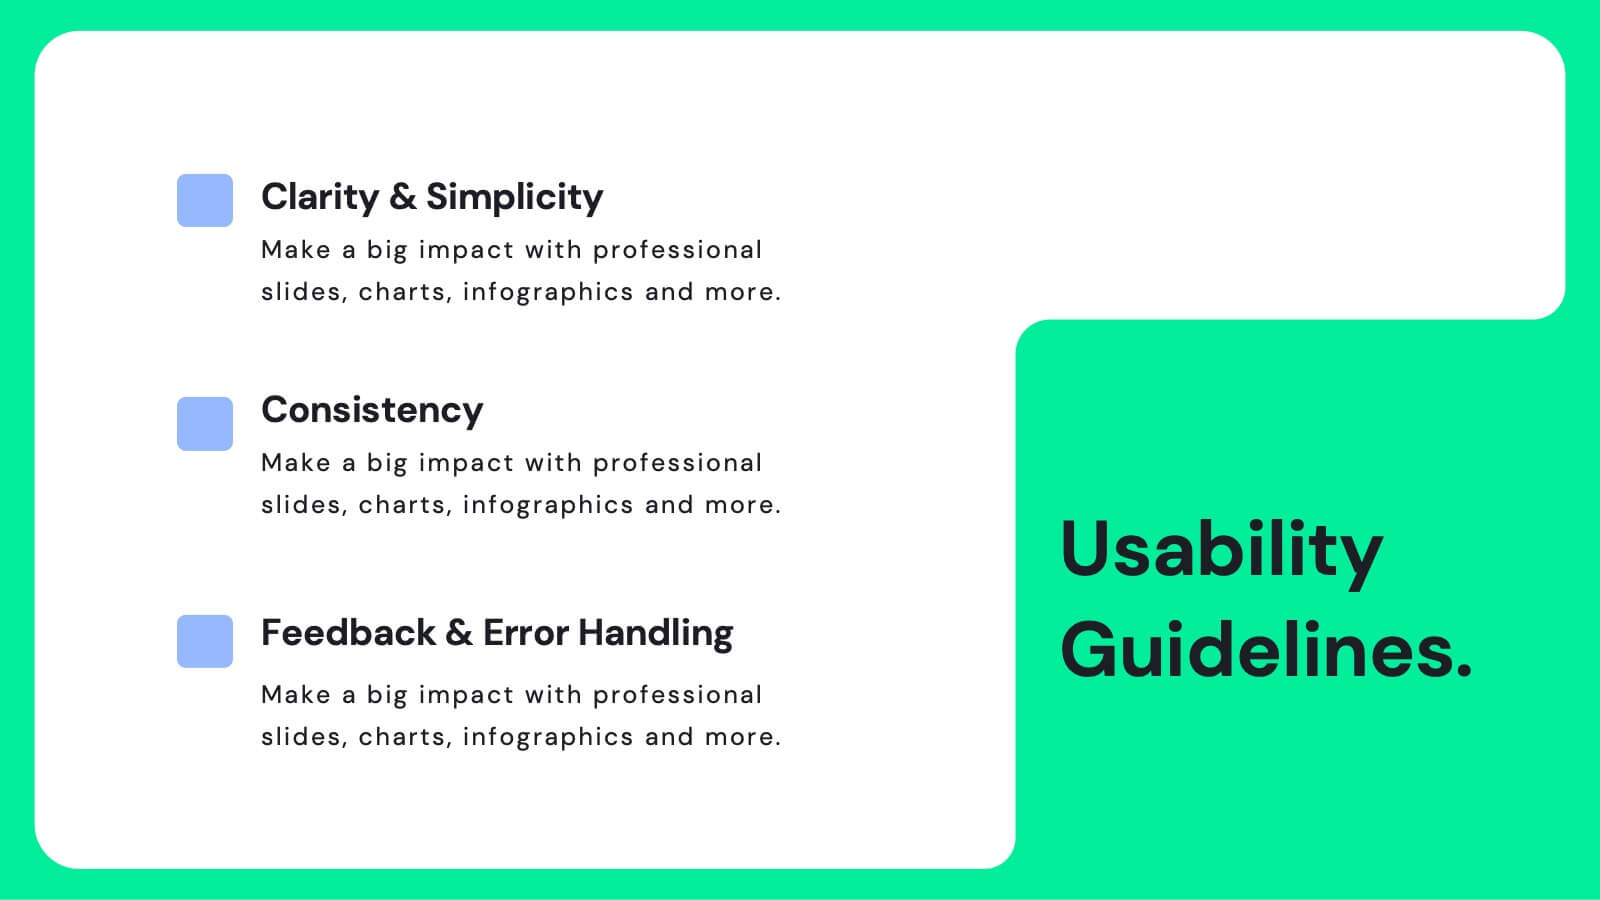
Juno UX Case Study Presentation
Enhance your UX presentations with this sleek, user-friendly template designed for showcasing detailed case studies and user research. With a modern layout and clear sections for user journey mapping, prototyping, and usability guidelines, this template ensures a professional and engaging presentation. Compatible with PowerPoint, Keynote, and Google Slides, it's perfect for any platform.


26 slides
Corporate and Investment Company Profile Presentation
A corporate and investment company profile is a comprehensive document that provides detailed information about a company engaged in corporate and investment services. This presentation template is an effective way to introduce your company's services, capabilities, and track record to your audience. This template can be used to reflect your company's professionalism, expertise, and value proposition. This presentation is fully customizable and compatible with Powerpoint, Keynote, and Google Slides. This allows you to incorporate your company logo, brand colors, and relevant images that reflect your corporate identity.