


Features
- 6 Unique slides
- Fully editable and easy to edit in Microsoft Powerpoint, Keynote and Google Slides
- 16:9 widescreen layout
- Clean and professional designs
- Export to JPG, PDF or send by email


Do you have any questions?
Recommend


4 slides
Execution Phase Project Status Dashboard Presentation
Track execution phase progress at a glance with the Execution Phase Project Status Dashboard presentation slide. Featuring a visual traffic light indicator and pie charts, this layout helps communicate key metrics, task status, and completion percentages in a clear, engaging way. Ideal for internal reviews, stakeholder updates, or project team briefings. Fully editable in PowerPoint, Keynote, and Google Slides.


4 slides
Commonly Asked Questions Analysis Presentation
Simplify and clarify key topics using this FAQ-style layout, ideal for addressing top customer or stakeholder questions. With a clean lightbulb design and three-part structure, this template keeps content digestible and professional. Fully editable in Canva, PowerPoint, or Google Slides—perfect for onboarding, reports, or support documentation.


21 slides
Everwyrm Startup Strategy Presentation
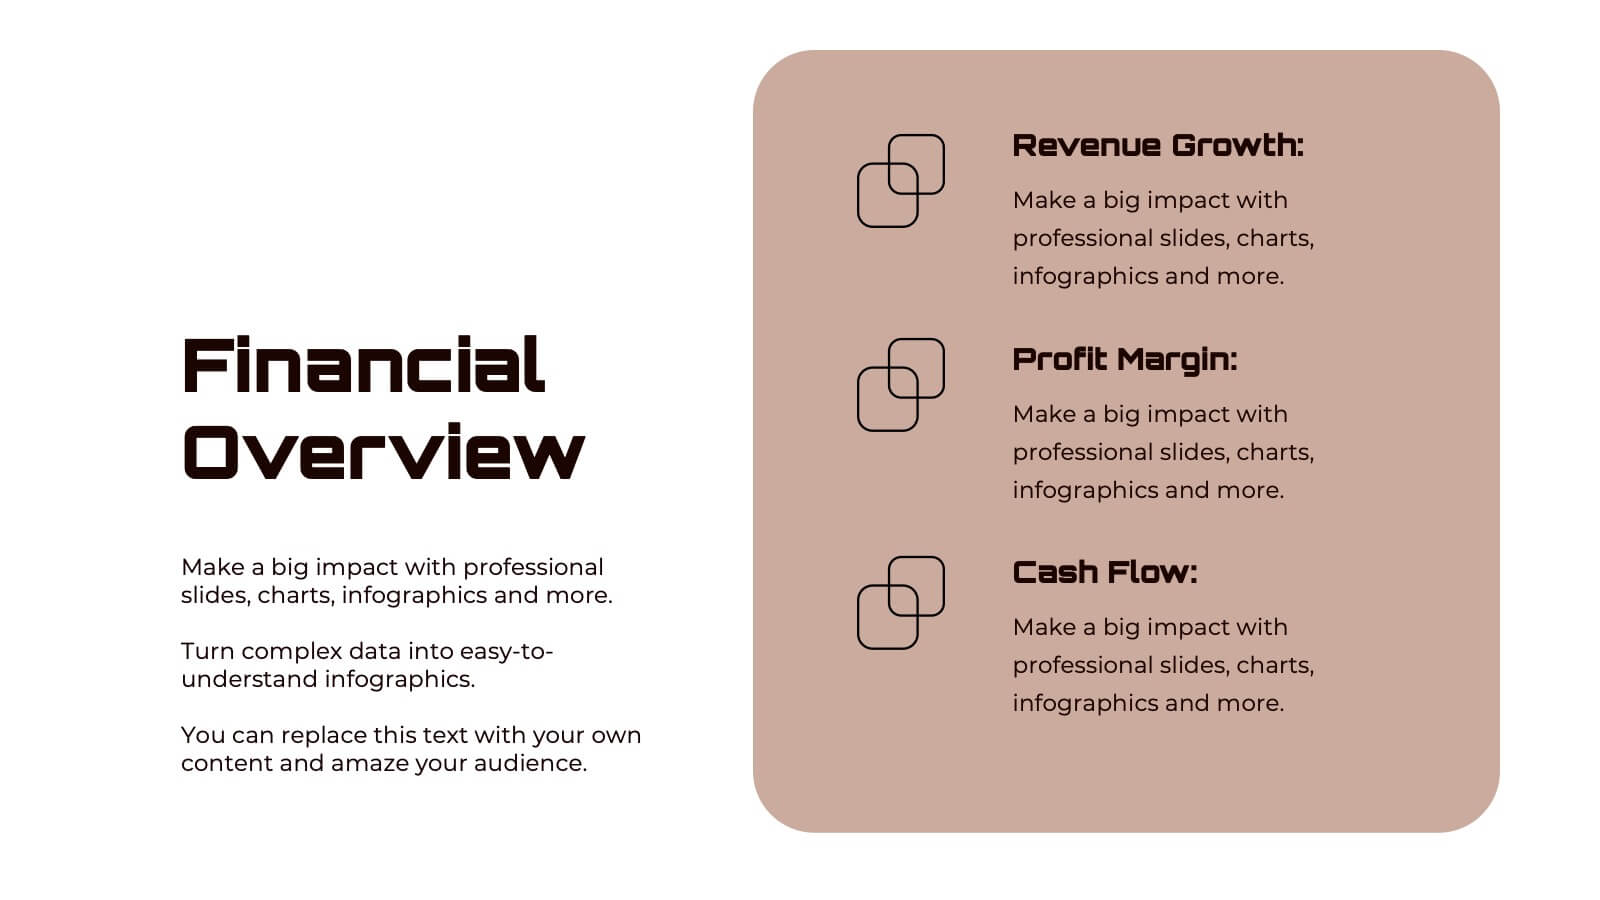
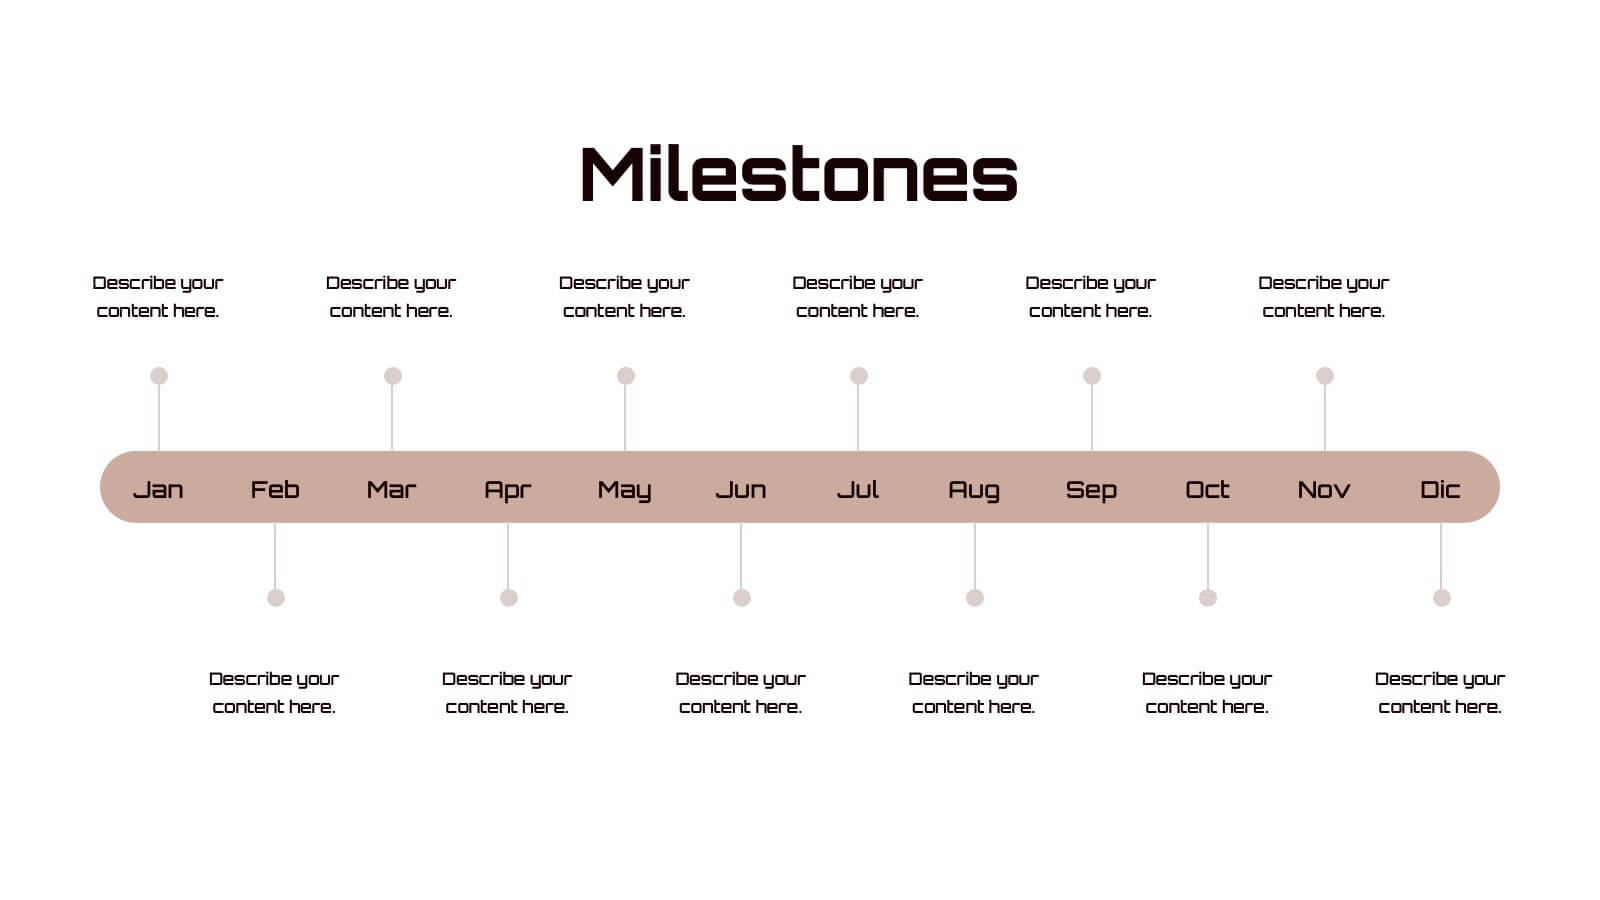
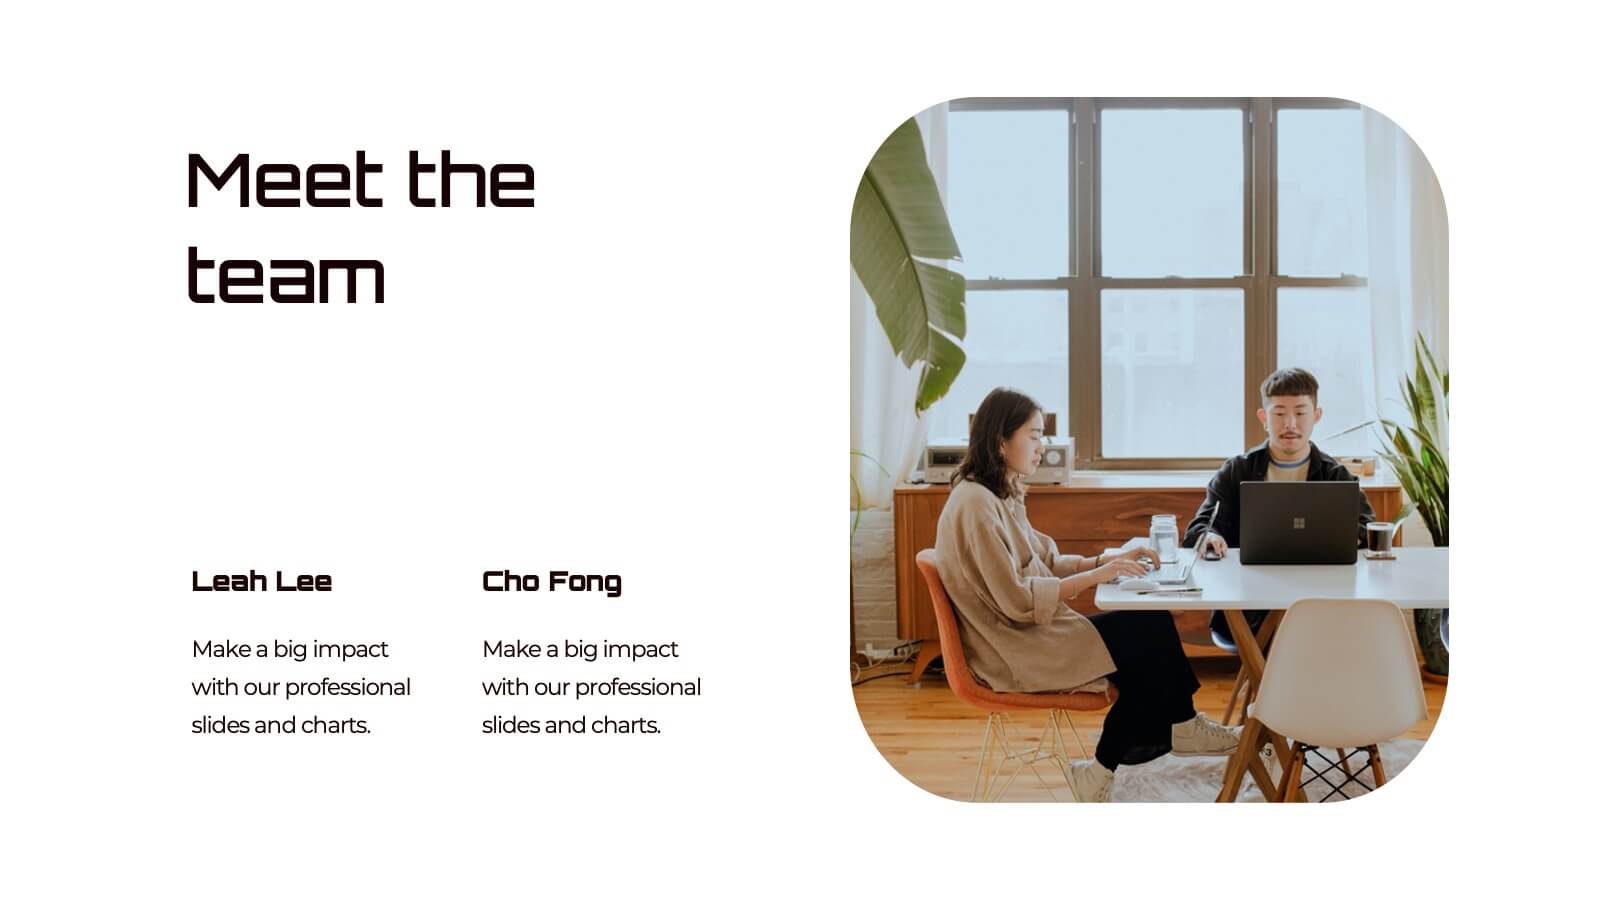
The Startup Strategy Presentation Template is crafted to highlight your business vision, growth plans, and financial insights. With 21 fully editable slides, it covers areas like business model, market analysis, and milestones. Perfect for entrepreneurs and investors, compatible with PowerPoint, Keynote, and Google Slides.


7 slides
Enforcement Law Infographic Presentation
A Law Enforcement Infographic is a visual representation of key concepts, statistics, and procedures related to law enforcement. This template can be used to provide an overview of various aspects of law enforcement, such as crime rates, policing strategies, and legal procedures. This infographic includes a variety of icons, illustrations, and other design elements law themed to enhance the visual appeal and make it more appealing for your viewers. This template is compatible with Powerpoint, Keynote and Google Slides making it easy to customize and edit with your own text and information.


4 slides
Project Development Progress Report Presentation
Track milestones with precision using this clean, data-driven slide designed for showcasing project completion percentages. Circular progress visuals paired with text blocks allow you to highlight achievements, issues, or next steps at a glance. Perfect for project managers, teams, and stakeholders. Fully editable in PowerPoint, Keynote, and Google Slides.


8 slides
Investor Business Plan Presentation
The "Investor Business Plan Presentation" template is innovatively designed to illustrate the balance and interdependence of various business elements critical for attracting investors. Utilizing a seesaw mechanism as a metaphor, this template vividly demonstrates how key aspects like Partners, Resources, Activities, and Channels contribute to maintaining a stable and functional business model. Each section of the seesaw is colored differently to distinguish between the categories, providing a clear visual hierarchy. This presentation format is excellent for startups and existing businesses preparing to pitch to investors, highlighting how each strategic component is vital for overall success and stability in the market.


5 slides
IT Operations Management
Illustrate complex workflows with this gear-themed infographic designed for IT operations management. Each gear represents a key step or stage, perfect for showcasing interconnected processes, system automation, or IT service flow. Easy to customize in PowerPoint, Keynote, and Google Slides. Clean, professional layout with space for icons and concise text.


8 slides
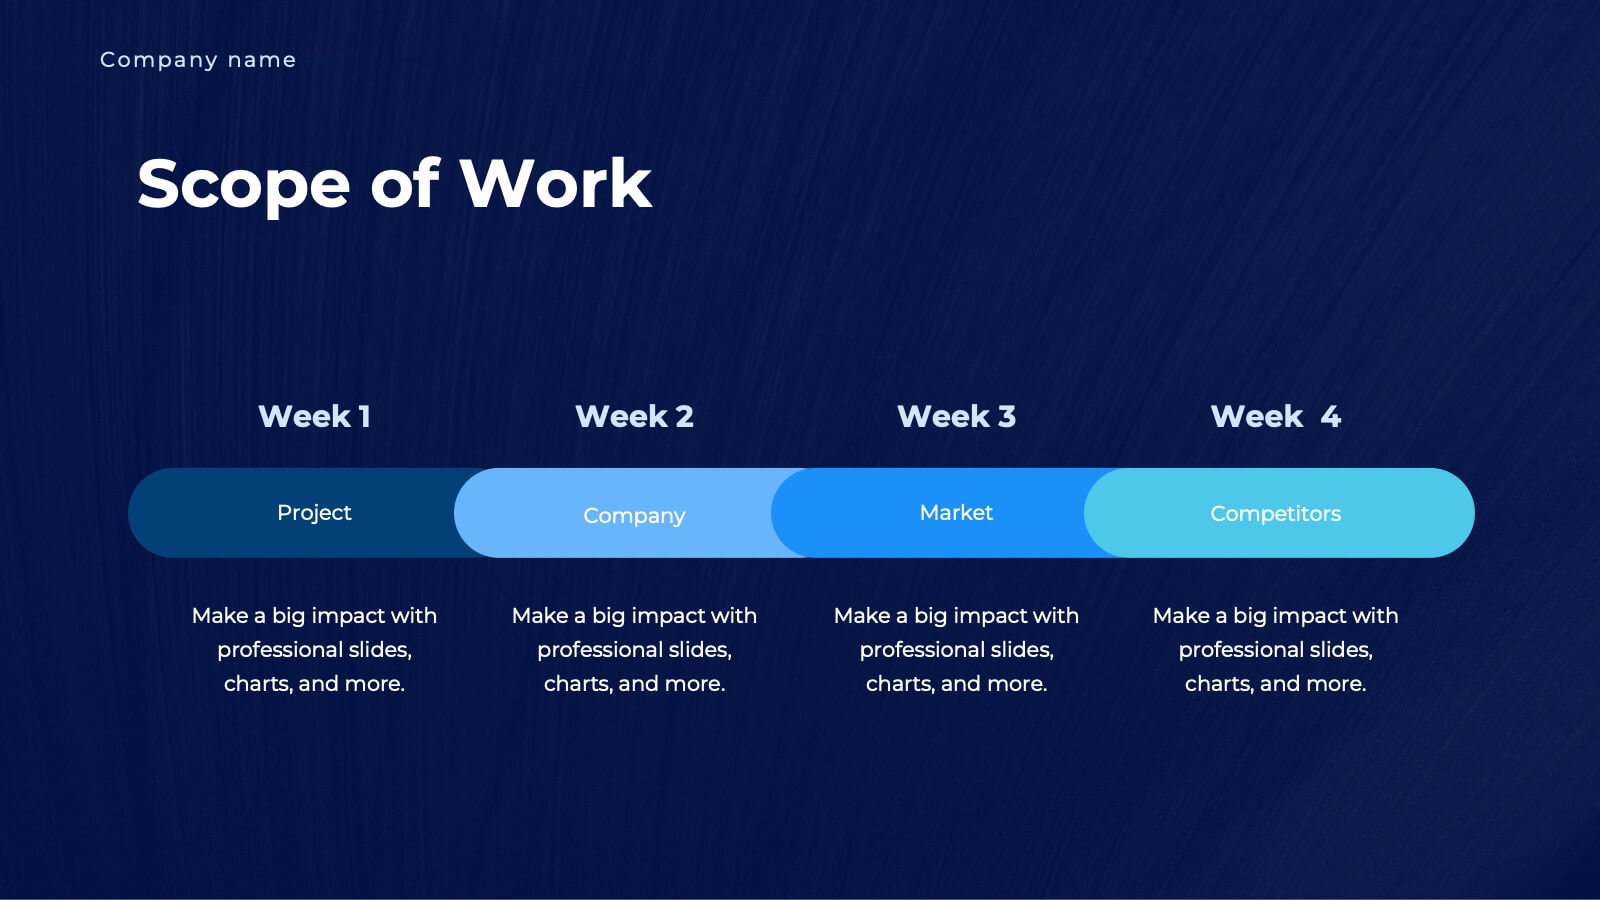
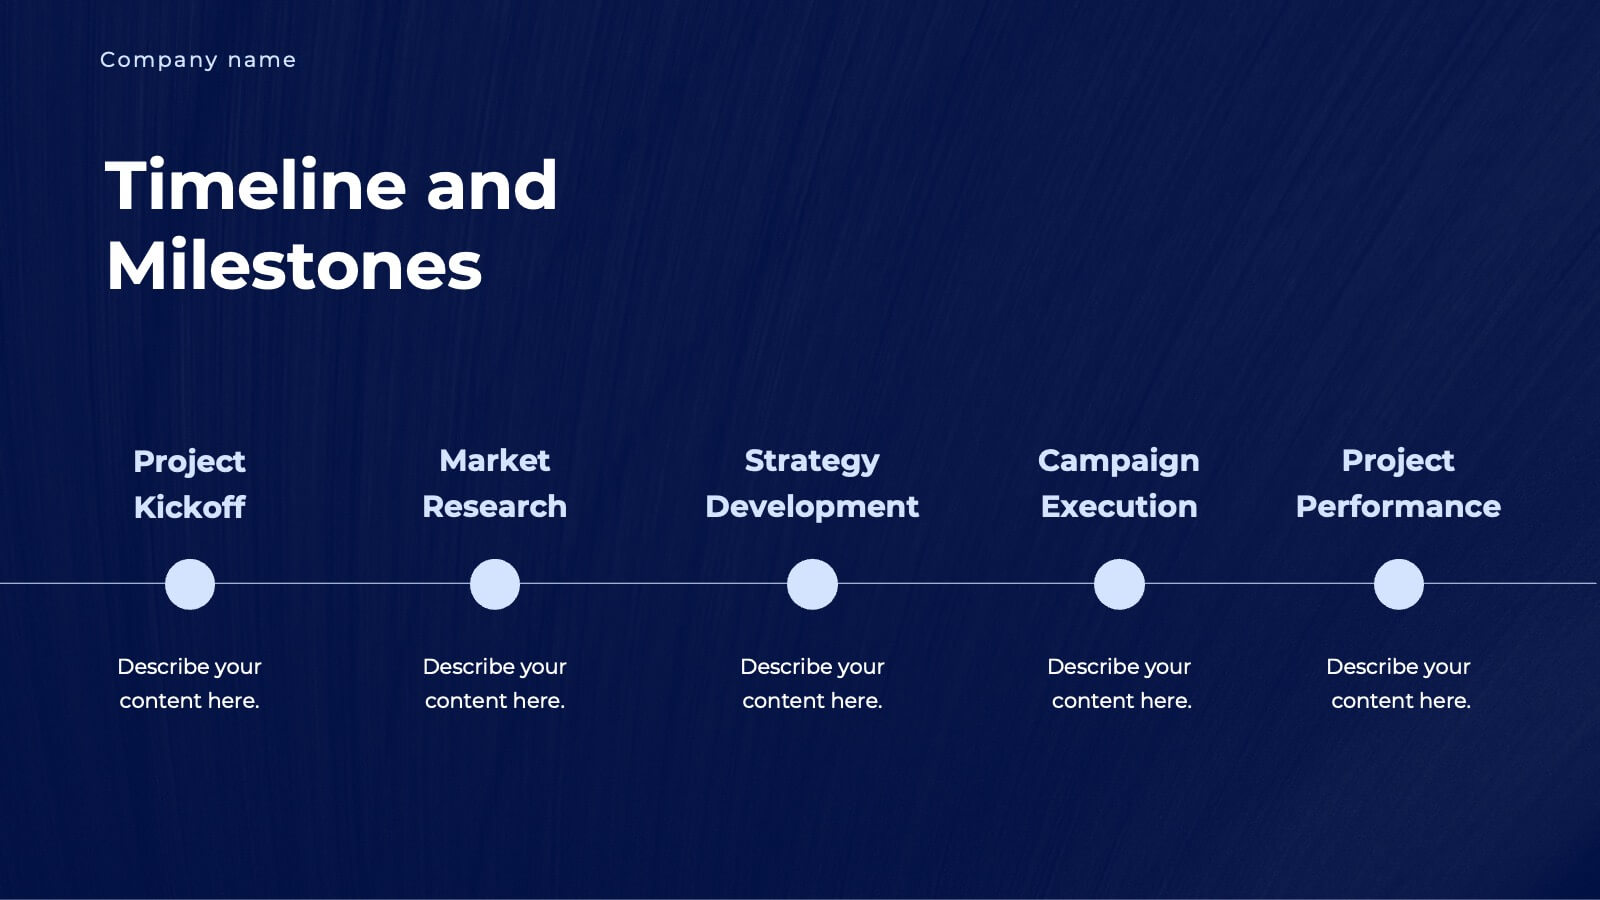
Project Timeline and Schedule Presentation
Keep your projects on track with this clear and professional timeline layout. This presentation is designed to help you outline tasks, milestones, and deadlines week by week. Easily visualize the flow of work, allocate resources efficiently, and ensure everyone stays aligned on the project schedule. Perfect for business meetings, project proposals, team updates, and academic planning. Fully editable and compatible with PowerPoint, Keynote, and Google Slides.


3 slides
Financial Cost Management Strategies
Break down your financial action plan with the Financial Cost Management Strategies Presentation. Featuring a dynamic 3-step arc design, this template is ideal for illustrating cost-saving initiatives, expense control methods, or phased budget implementation strategies. Each curved step includes space for icons, step numbers, titles, and concise descriptions, making it easy to communicate each stage clearly. Fully editable in PowerPoint, Keynote, and Google Slides, it’s perfect for finance teams, consultants, or operations leaders.


5 slides
RAPID Decision-Making Model
Take the guesswork out of group decisions with this bold and clear template. It’s designed around the RAPID framework—Recommend, Agree, Perform, Input, Decide—to help teams define roles and make faster, more accountable choices. Perfect for leadership, strategy, and project planning sessions. Fully compatible with PowerPoint, Keynote, and Google Slides.


6 slides
Alphabet Learning Presentation
Make learning fun and engaging with this alphabet learning presentation template! Designed with vibrant visuals and a structured layout, this template helps educators, parents, and trainers introduce letters effectively. Perfect for early childhood education, homeschooling, and interactive lessons. Fully customizable and compatible with PowerPoint, Keynote, and Google Slides.


6 slides
Bubble Diagram for Idea Development Presentation
Visualize your creative process with this Bubble Diagram for Idea Development template. Ideal for brainstorming sessions, project planning, and innovation strategies, this slide uses color-coded lightbulbs and numbered bubbles to illustrate key ideas and their relationships. Perfect for entrepreneurs, teams, and educators, it simplifies complex concepts into a clear, engaging format. Fully editable and compatible with PowerPoint, Keynote, and Google Slides for seamless customization.
22 slides
Pearl Product Launch Pitch Deck Presentation
Make your product launch shine with this sleek, pearl-inspired presentation! Perfect for pitching your product’s unique value, market positioning, and growth potential, this template is designed to captivate investors and stakeholders. Its elegant, minimalist layout keeps your message front and center. Compatible with PowerPoint, Keynote, and Google Slides.


5 slides
Marijuana Cultivation Infographics
Marijuana cultivation refers to the process of growing and cultivating marijuana plants for various purposes, primarily for medicinal or recreational use. These vertical infographics are designed to provide essential information about the cultivation of marijuana. It offers an in-depth overview of the cultivation process, growing techniques, equipment, and best practices. The template outlines the step-by-step cultivation process of marijuana, starting from seed germination to harvesting and drying. It includes visuals and icons to illustrate each stage, making it easy to understand for beginners and everyone.
20 slides
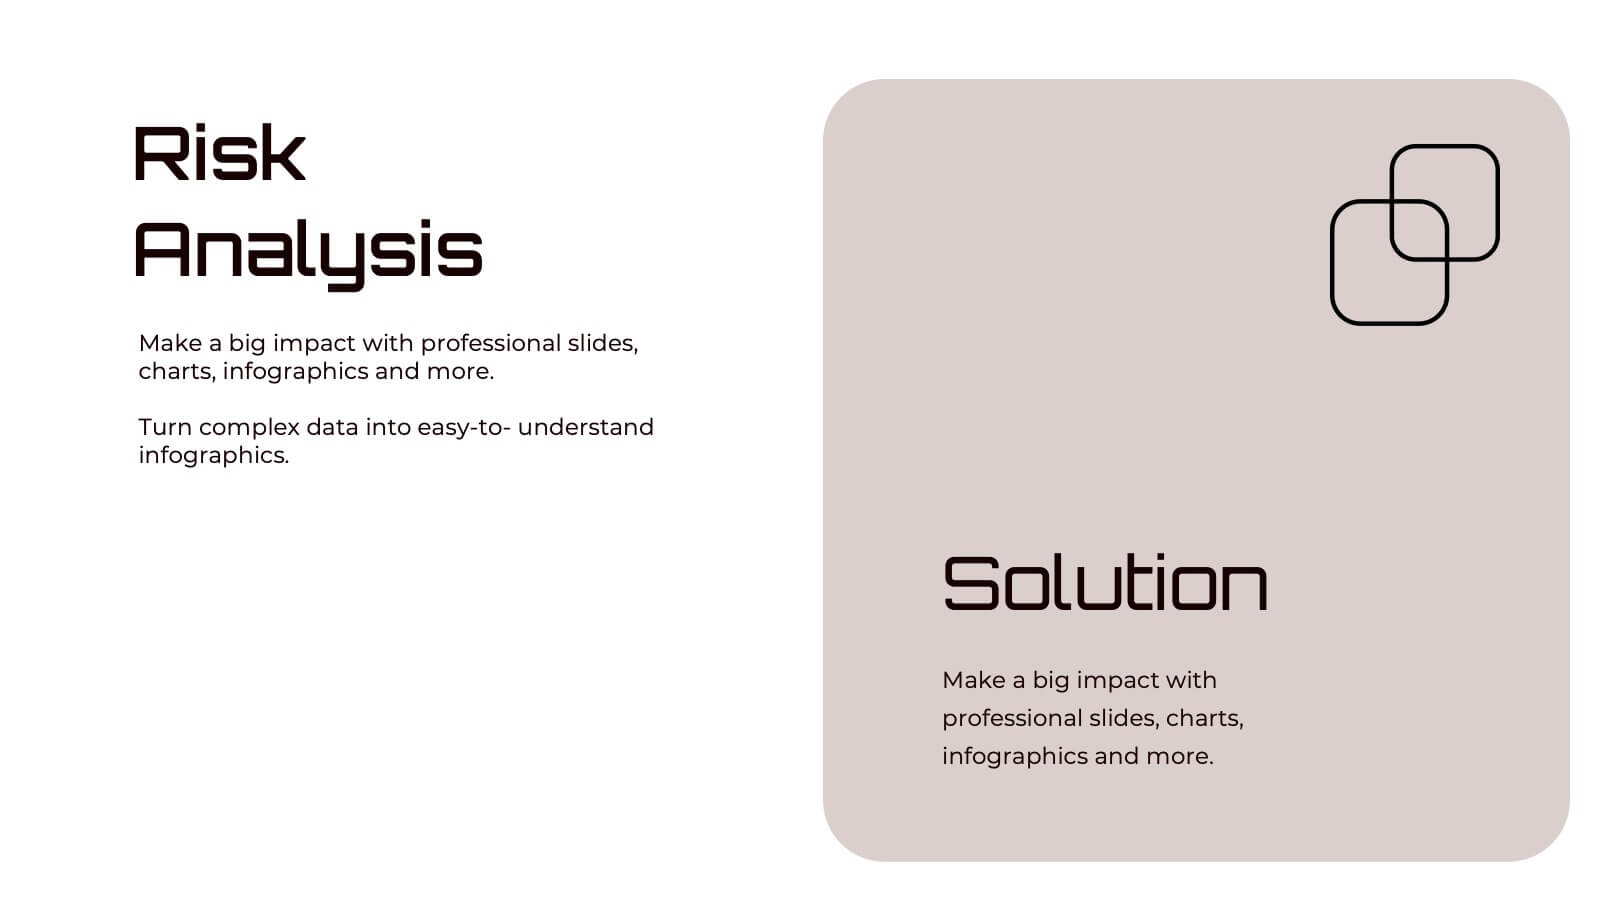
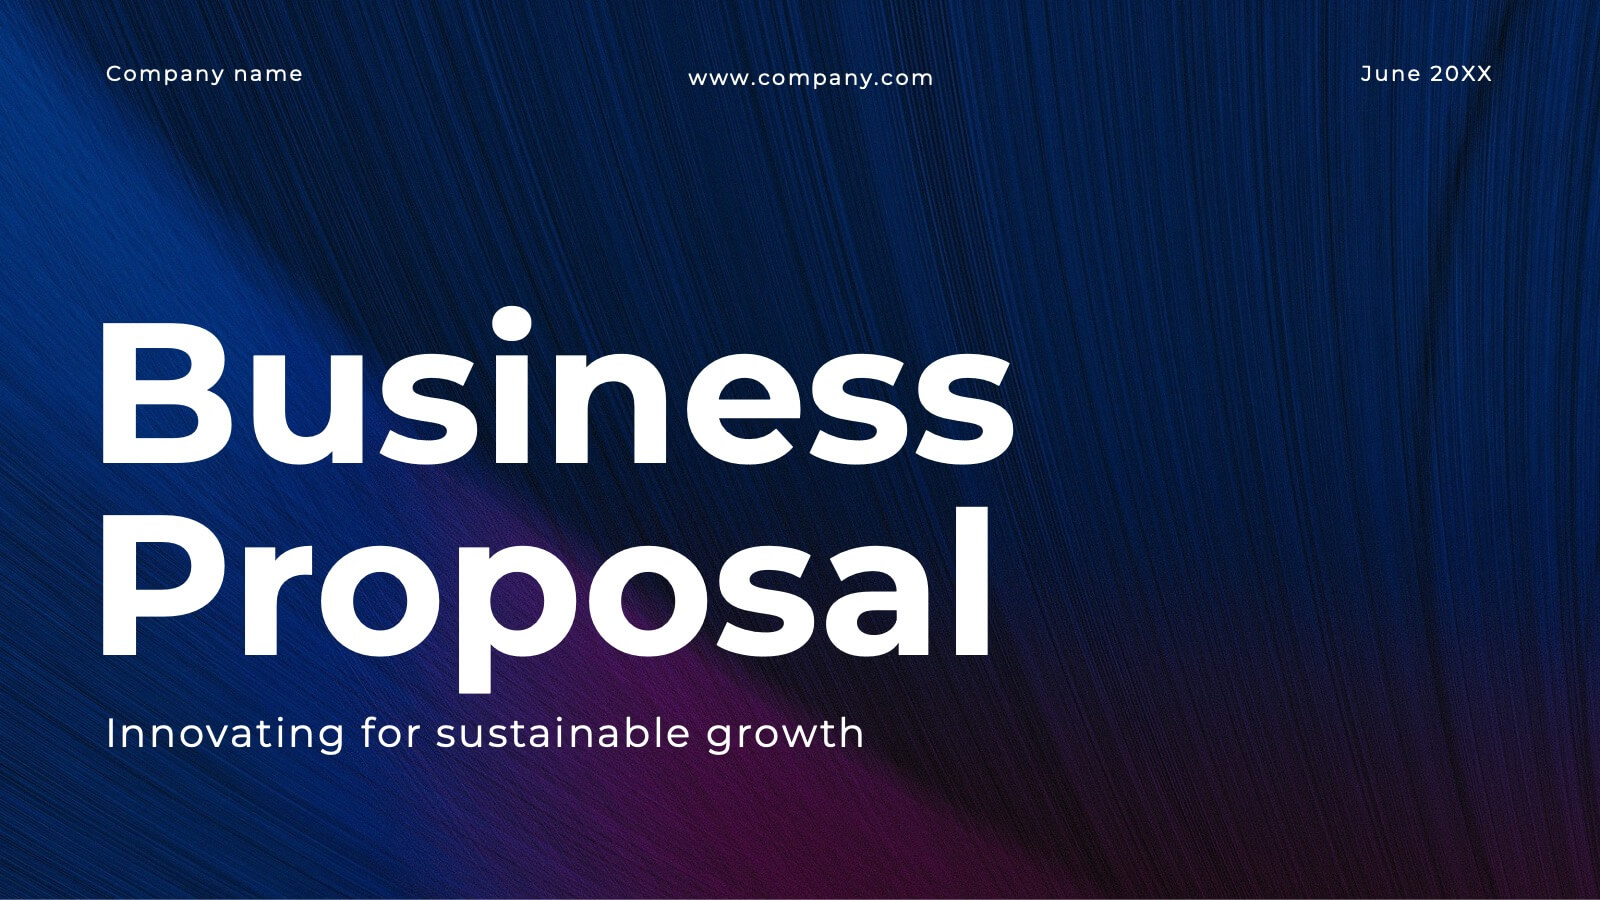
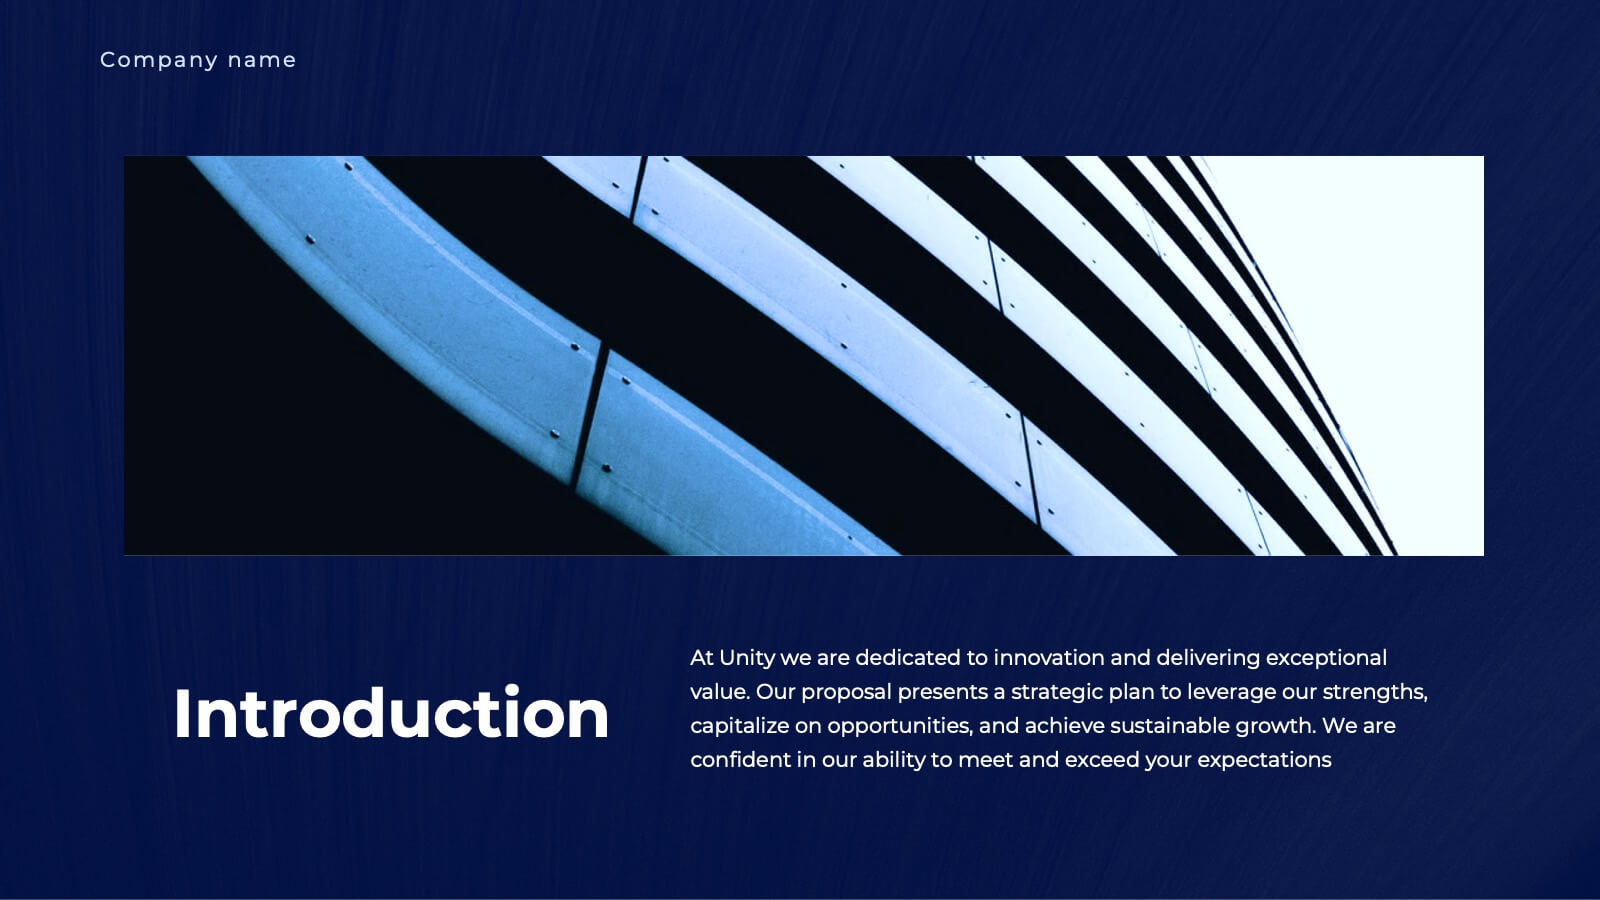
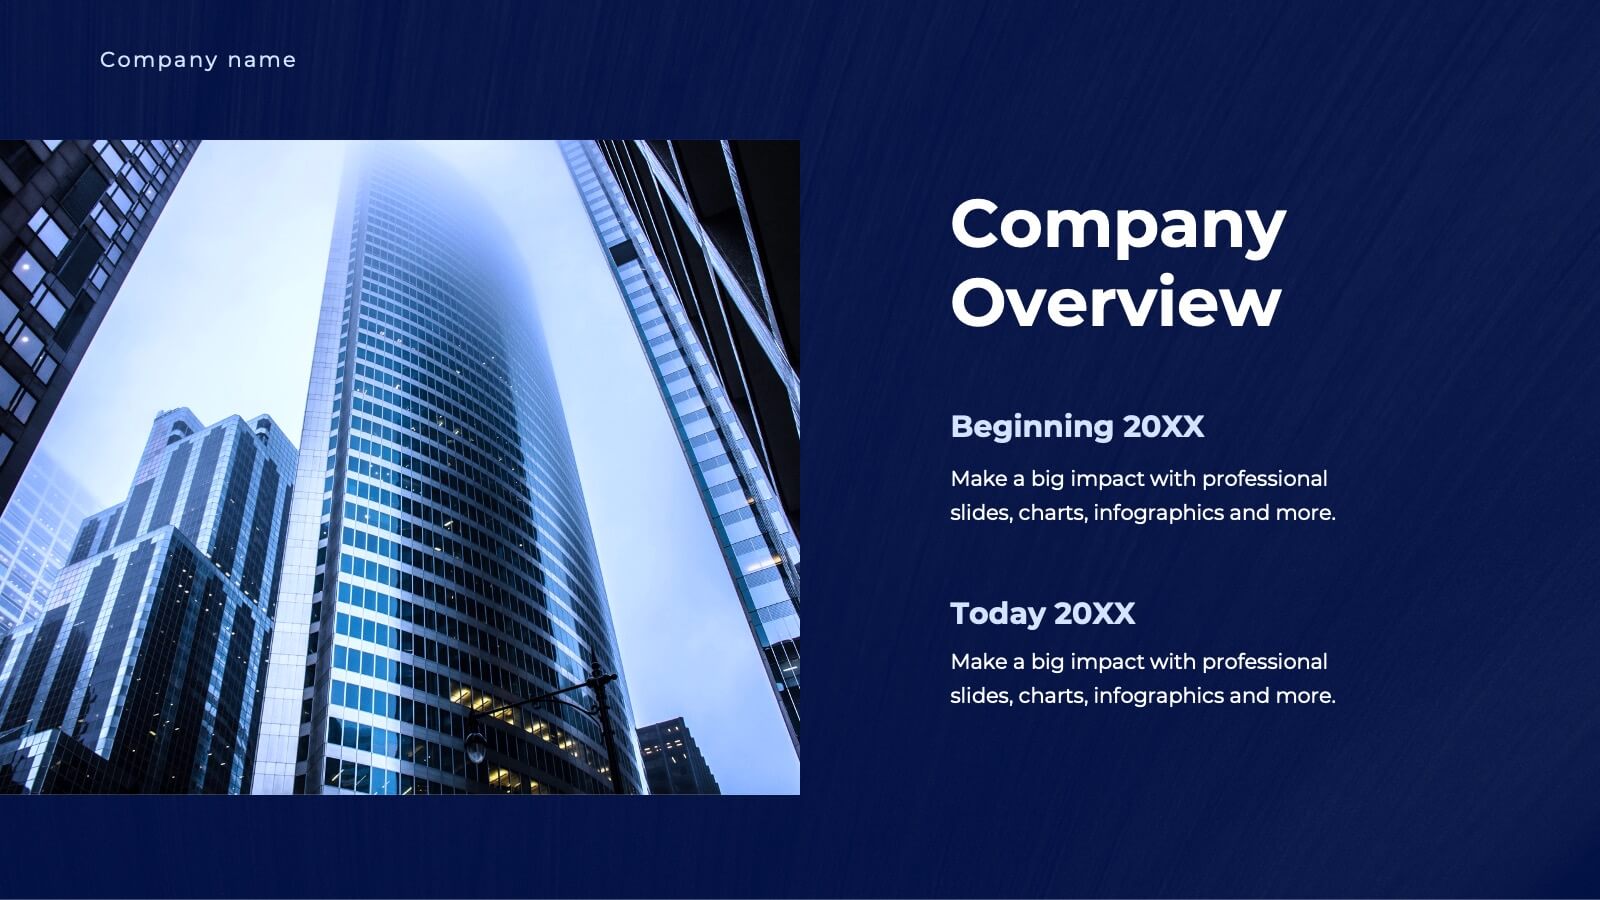
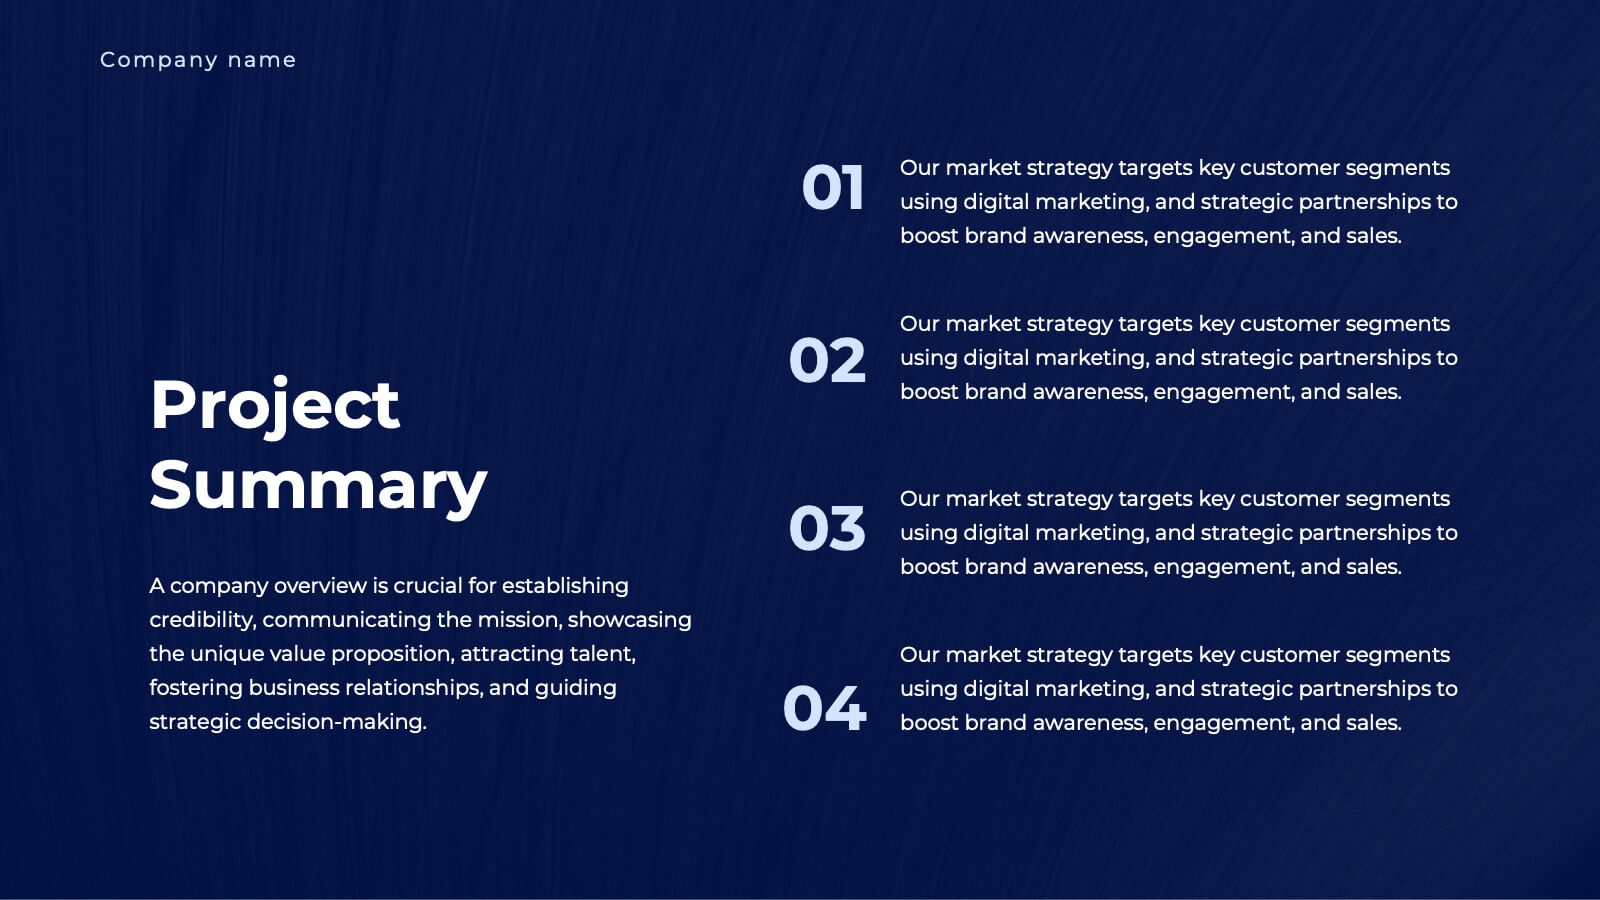
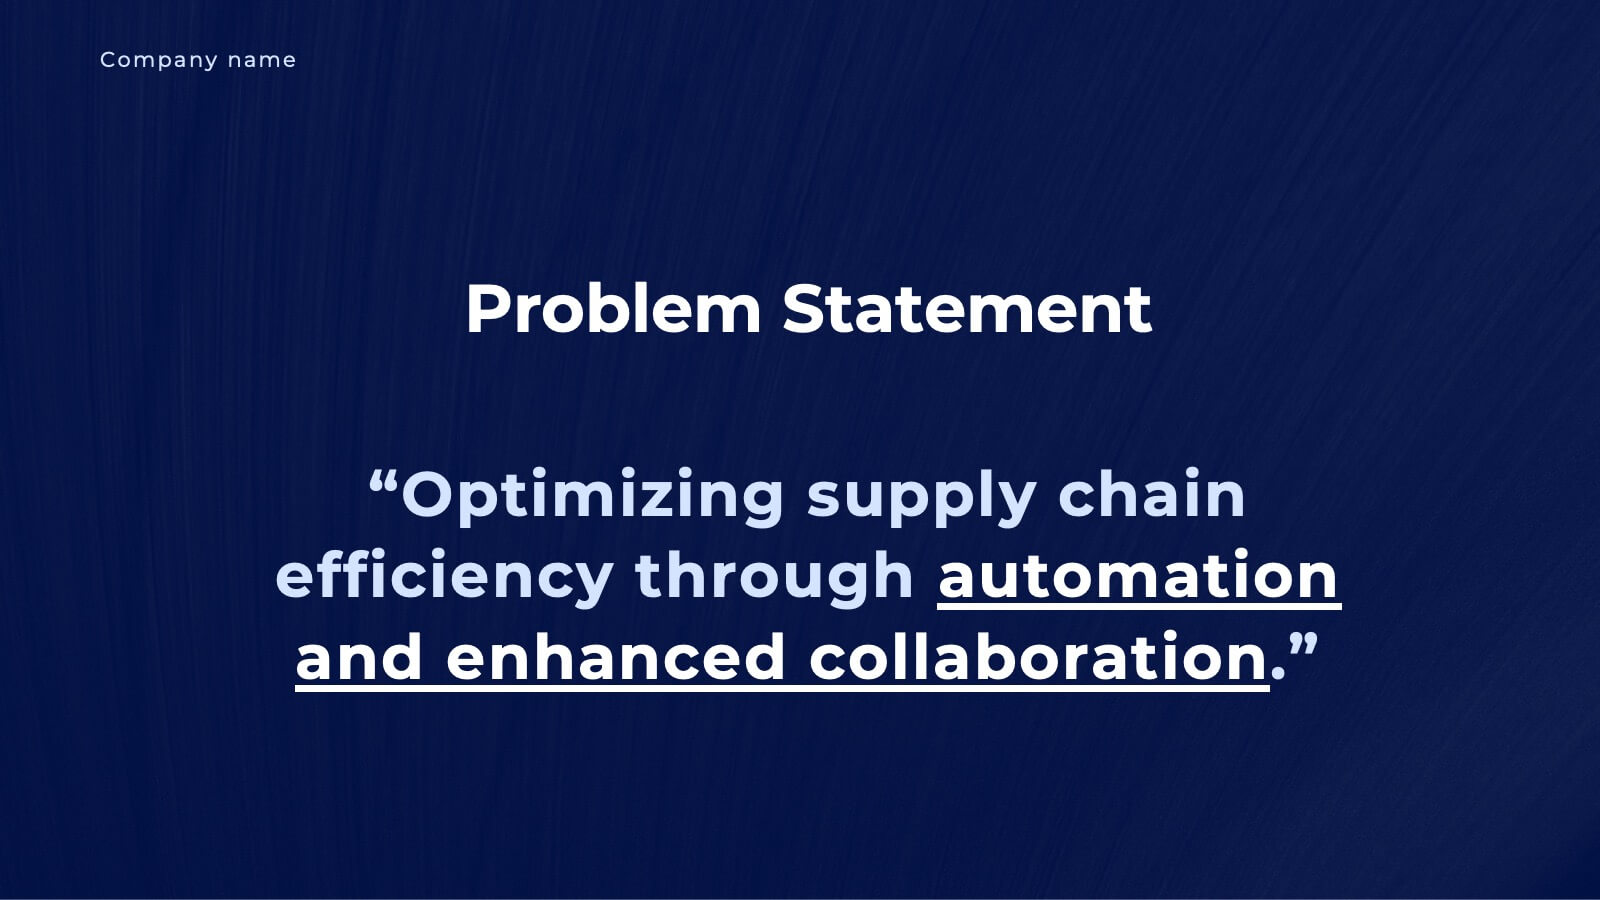
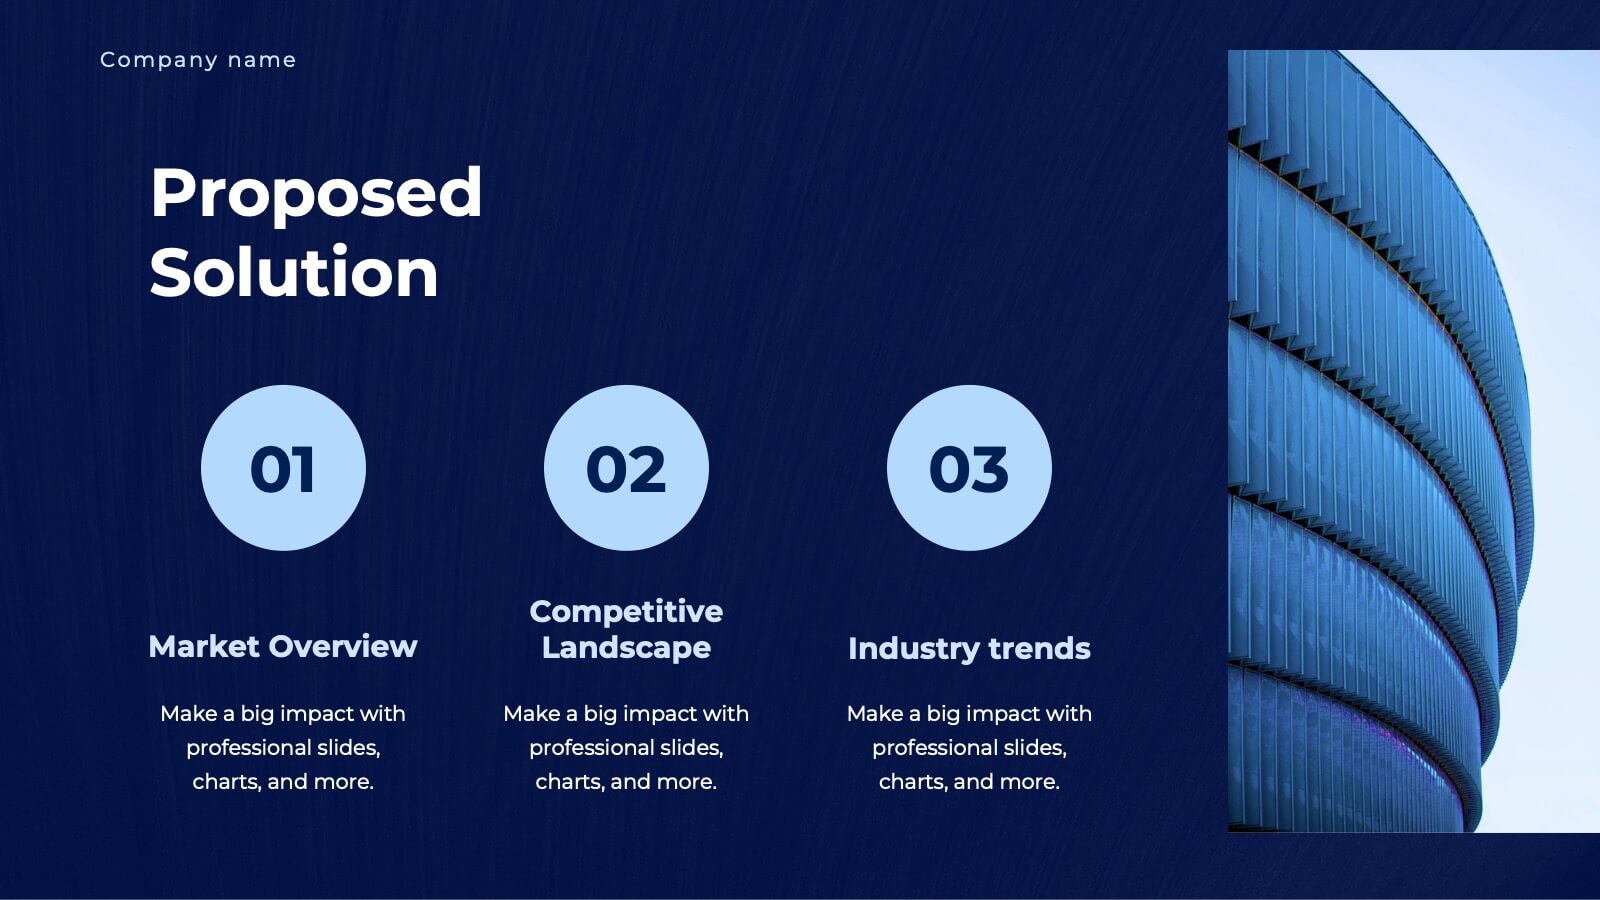
Unity Business Proposal Presentation
Take your business proposals to the next level with this elegant and comprehensive template! Perfect for presenting company overviews, project summaries, and detailed solutions. Ideal for business professionals looking to impress clients and stakeholders. Compatible with PowerPoint, Keynote, and Google Slides, this template ensures your proposals are impactful and professional.


7 slides
Executive Summary Format Infographic
Concisely communicate your organization's high-level insights with our Executive Summary Infographic, perfect for business reports and strategic presentations. This infographic is a vital tool for executives, managers, and business analysts to encapsulate key information. Our Executive Summary Infographic offers a visually engaging layout that summarizes complex data into digestible segments. It includes sections for financial highlights, performance metrics, strategic goals, and key achievements. With its customizable features, you can tailor the infographic to represent organizational successes, growth percentages, target completions, and forecasted trends. This SEO-optimized infographic ensures that your executive insights capture the attention of stakeholders and team members alike. Incorporate our infographic into your business documentation to provide a snapshot of your company's performance and strategic direction efficiently.


20 slides
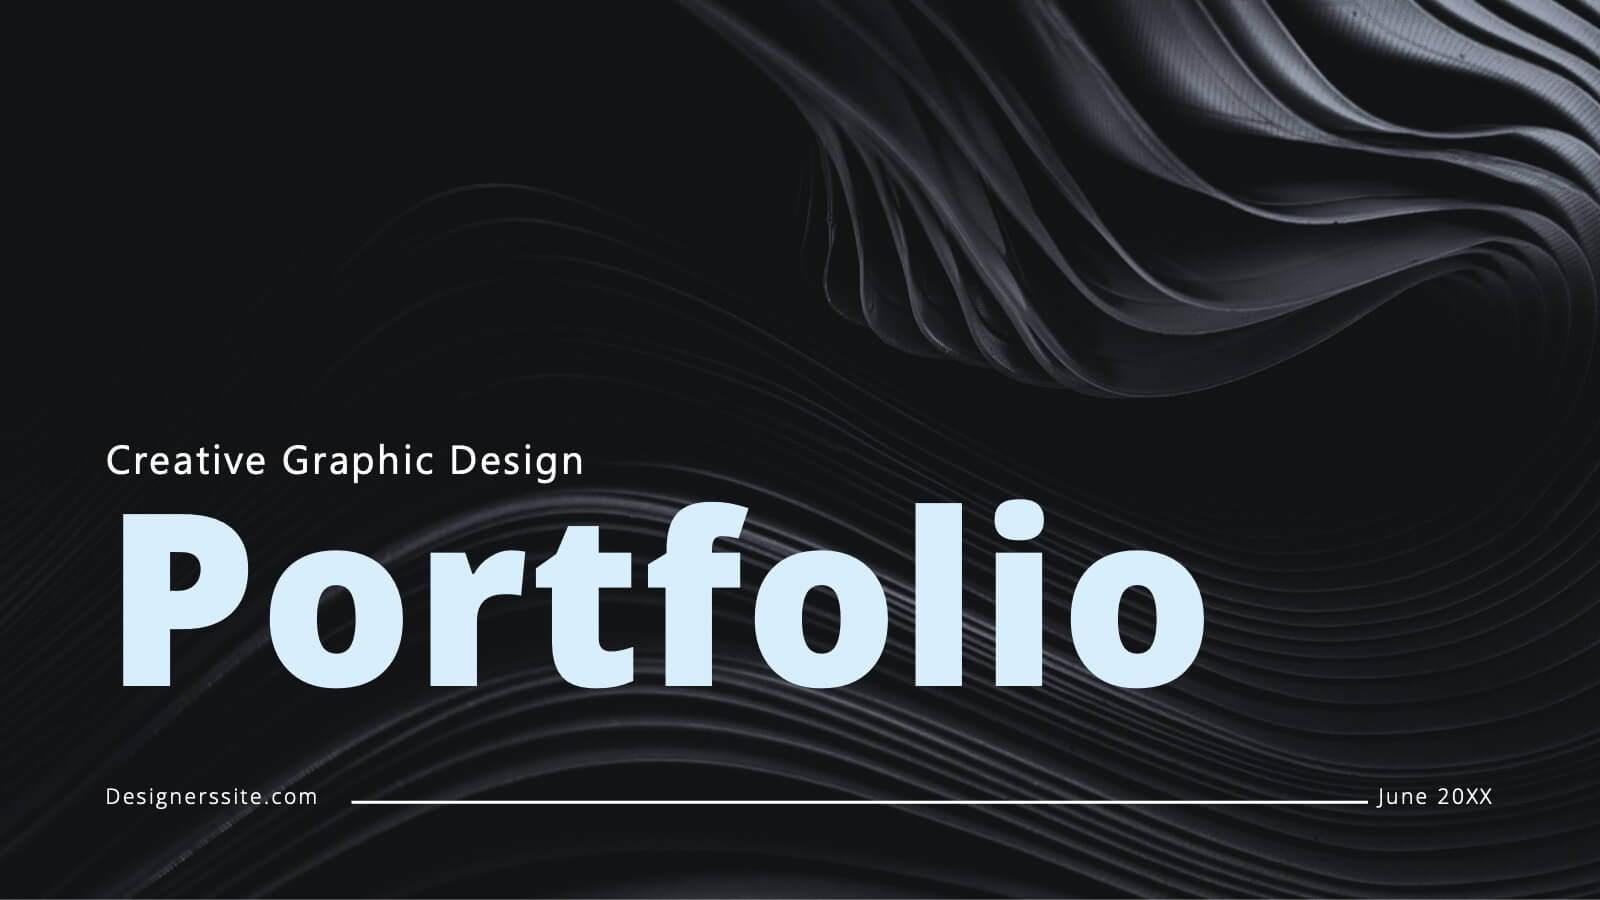
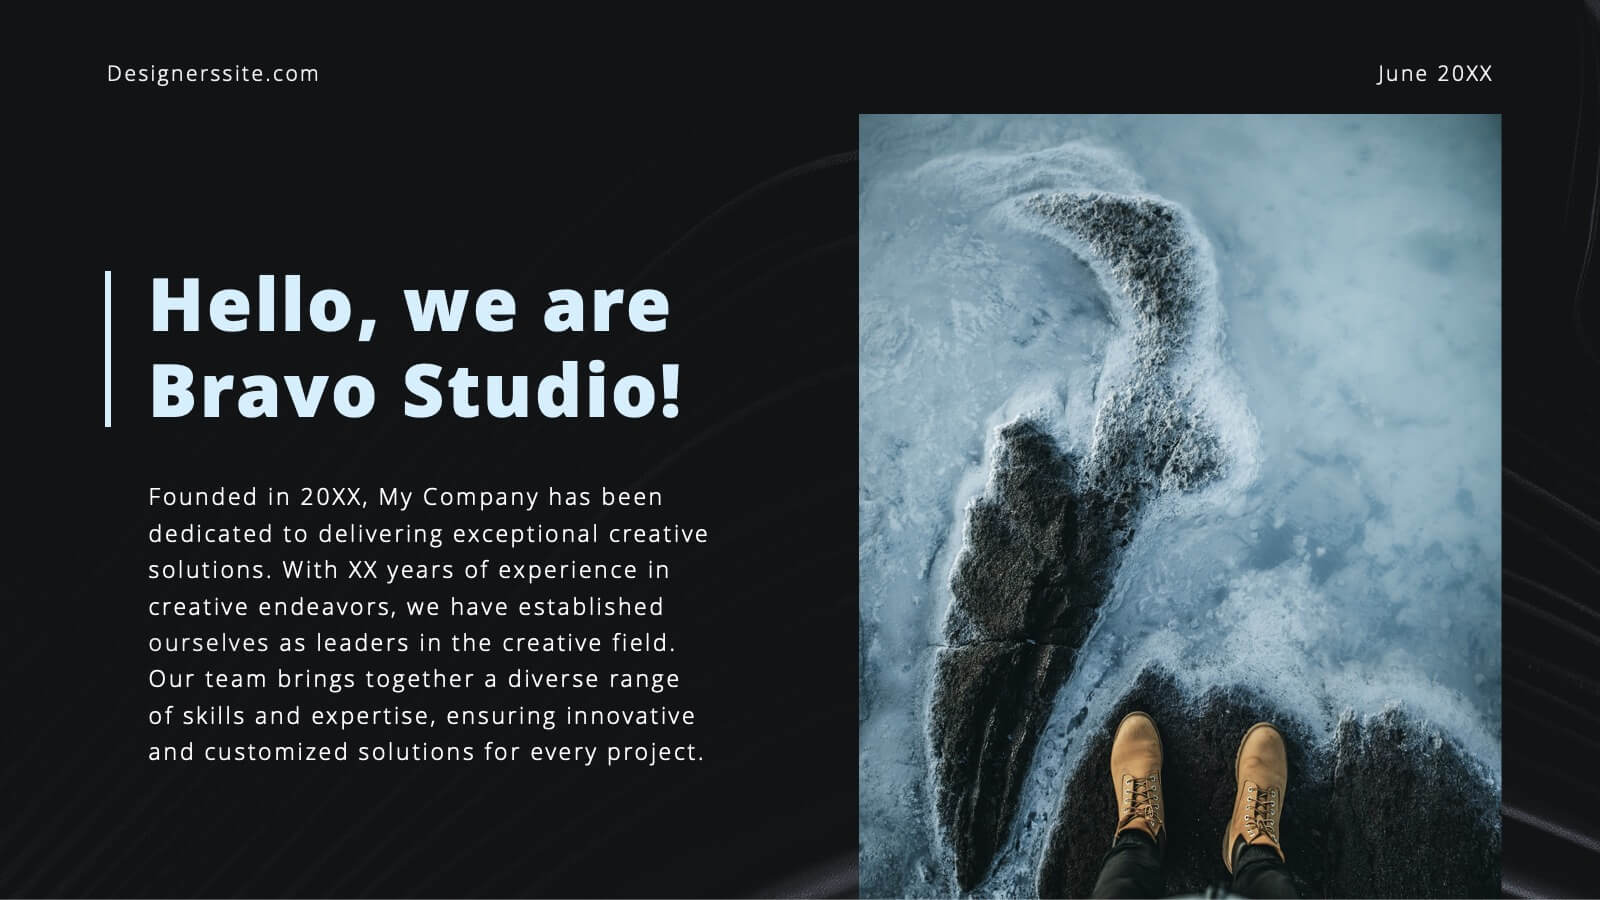
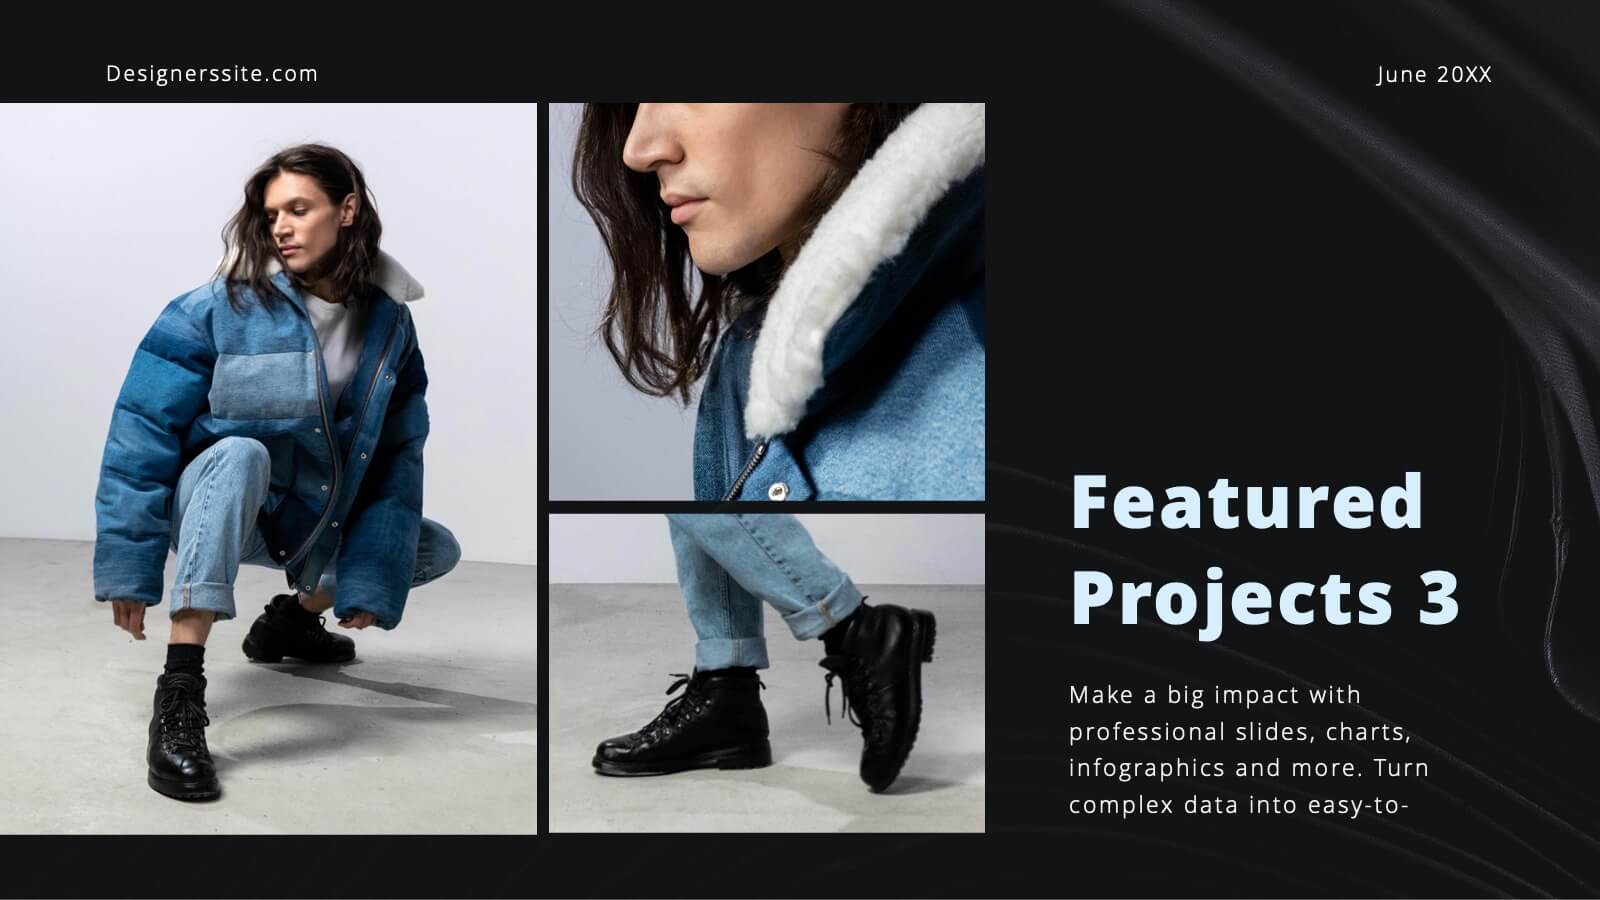
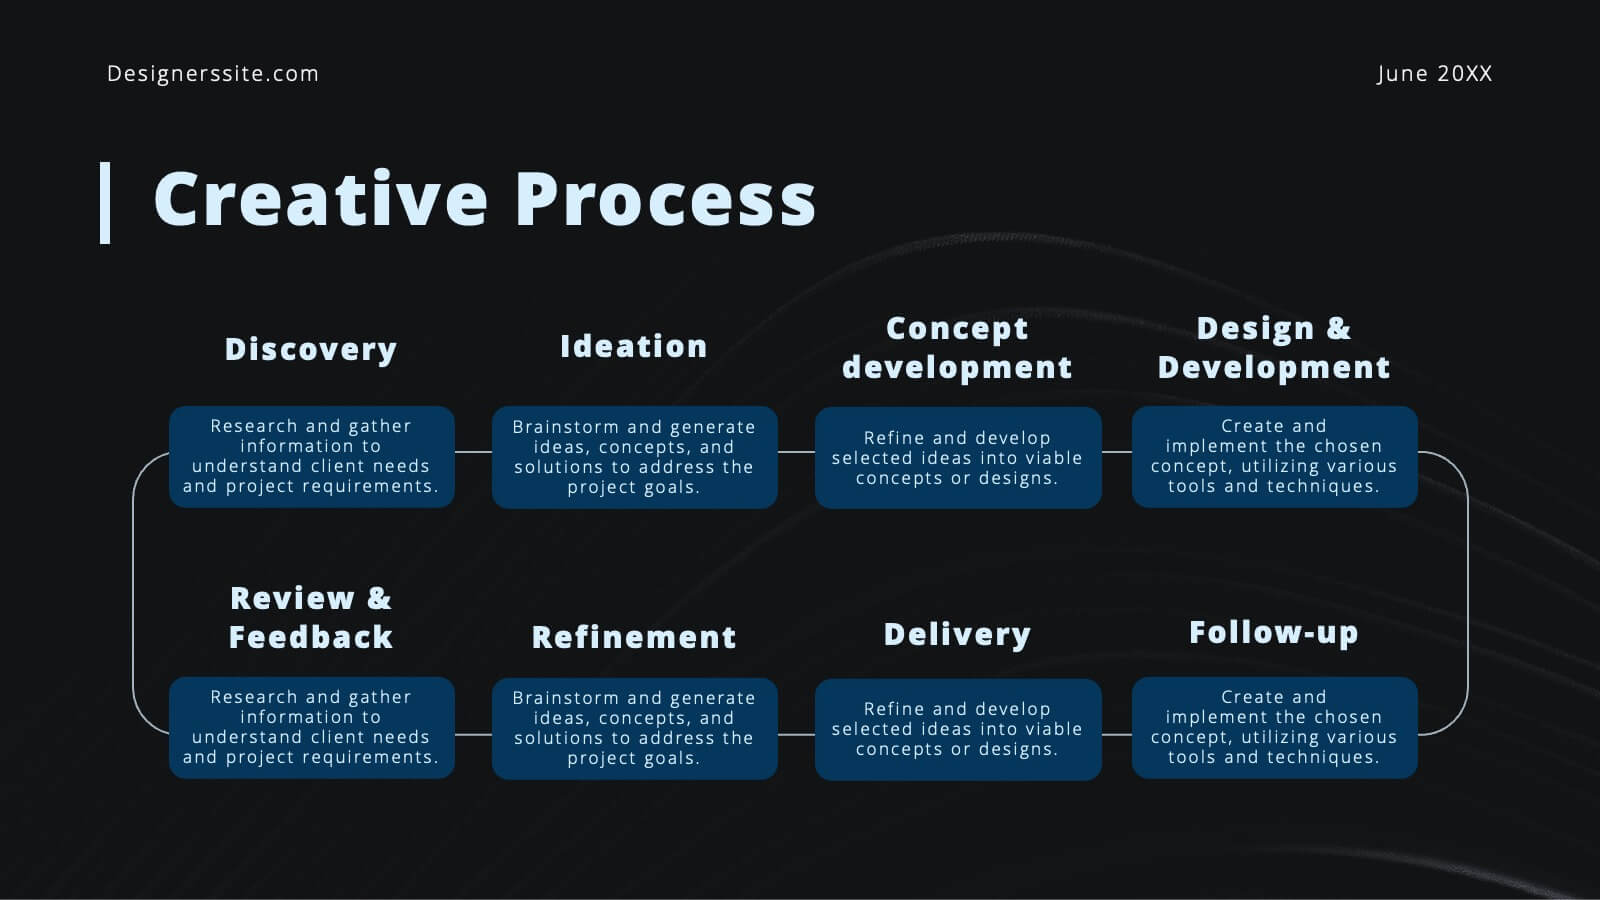
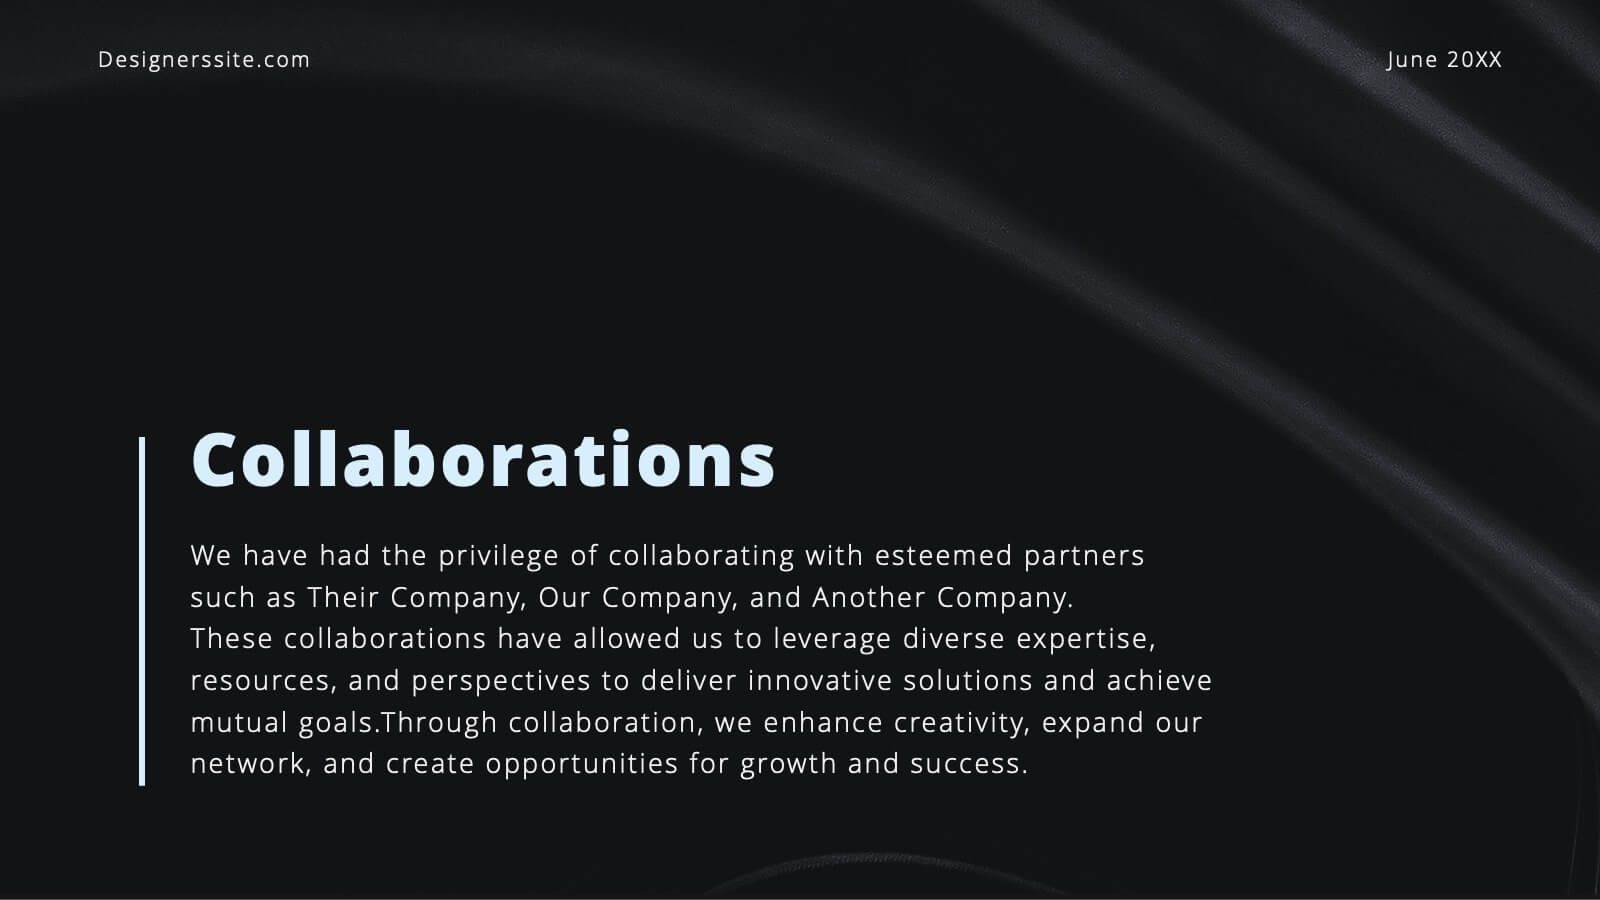
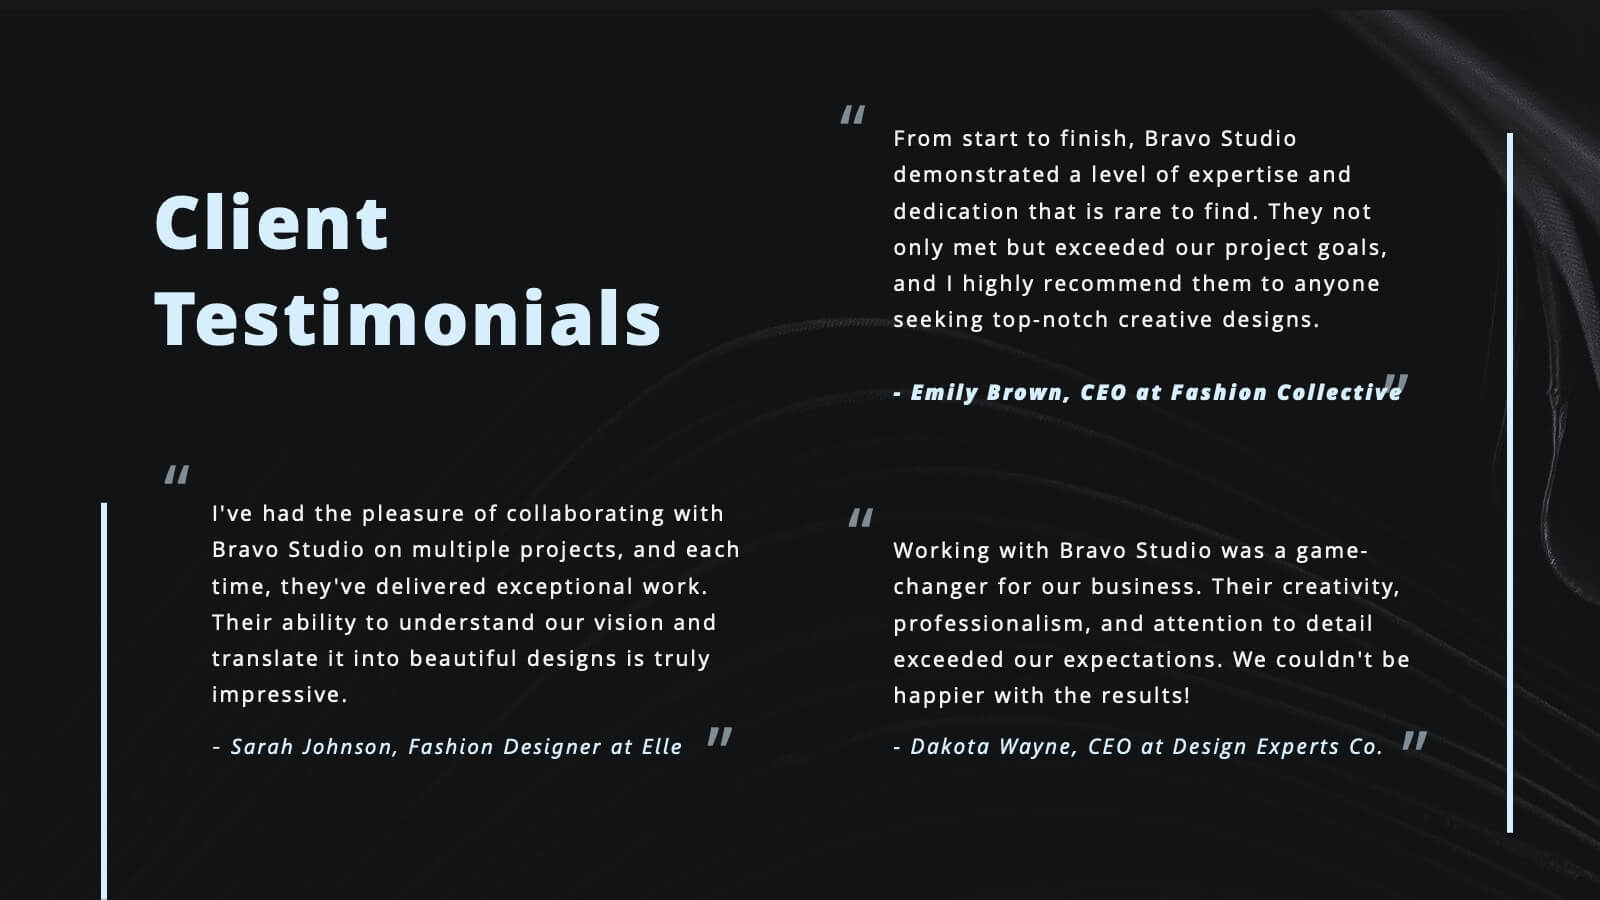
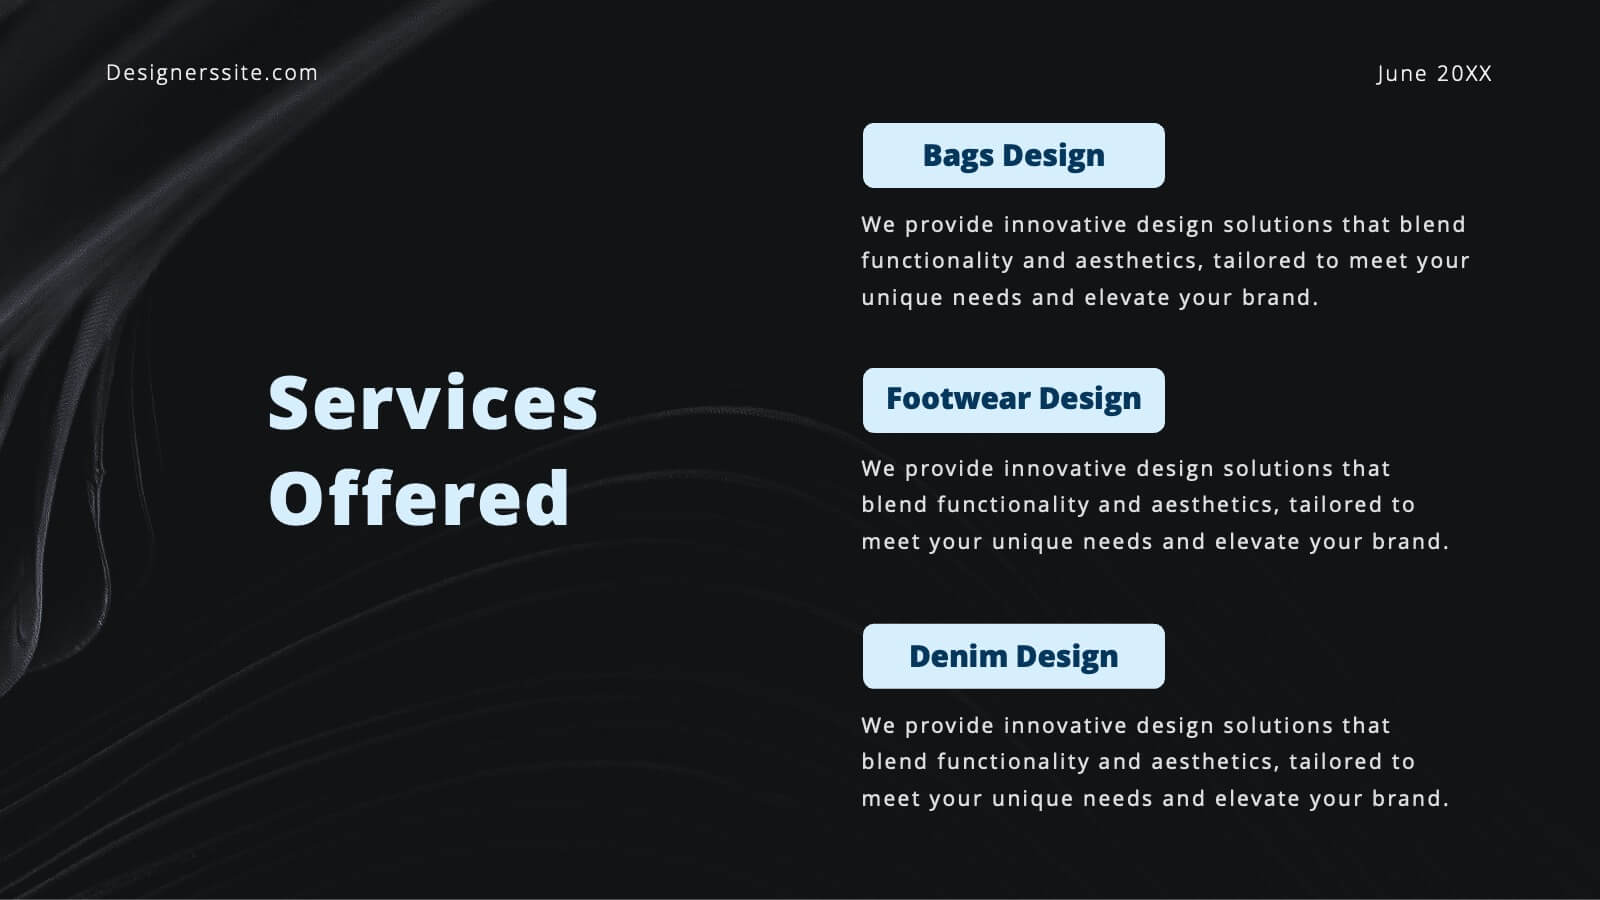
Bravo Creative Portfolio Presentation
Showcase your creative prowess with this sleek, modern portfolio presentation template. Perfect for highlighting featured projects, client testimonials, and your creative process, this template ensures your work shines. Its stylish design and professional layout make it ideal for impressing potential clients and collaborators. Compatible with PowerPoint, Keynote, and Google Slides, it's versatile for any platform.