


Features
- 7 Unique slides
- Fully editable and easy to edit in Microsoft Powerpoint, Keynote and Google Slides
- 16:9 widescreen layout
- Clean and professional designs
- Export to JPG, PDF or send by email


Do you have any questions?
Recommend


10 slides
Customer Satisfaction and Smile Rating Presentation
Visualize customer experience in a clear and engaging way with this Customer Satisfaction and Smile Rating slide. Featuring a vertical feedback meter and 5 customizable rating levels, this template is ideal for highlighting user sentiment, service evaluations, or feedback summaries. Perfect for performance reviews, UX reports, or NPS breakdowns. Compatible with PowerPoint, Keynote, and Google Slides.


10 slides
Corporate Governance Model Presentation
Bring clarity and structure to complex leadership systems with this clean, modern slide, perfect for explaining how key responsibilities flow across an organization. It helps simplify roles, decisions, and oversight for any business audience. Fully editable and easy to use in PowerPoint, Keynote, and Google Slides.


22 slides
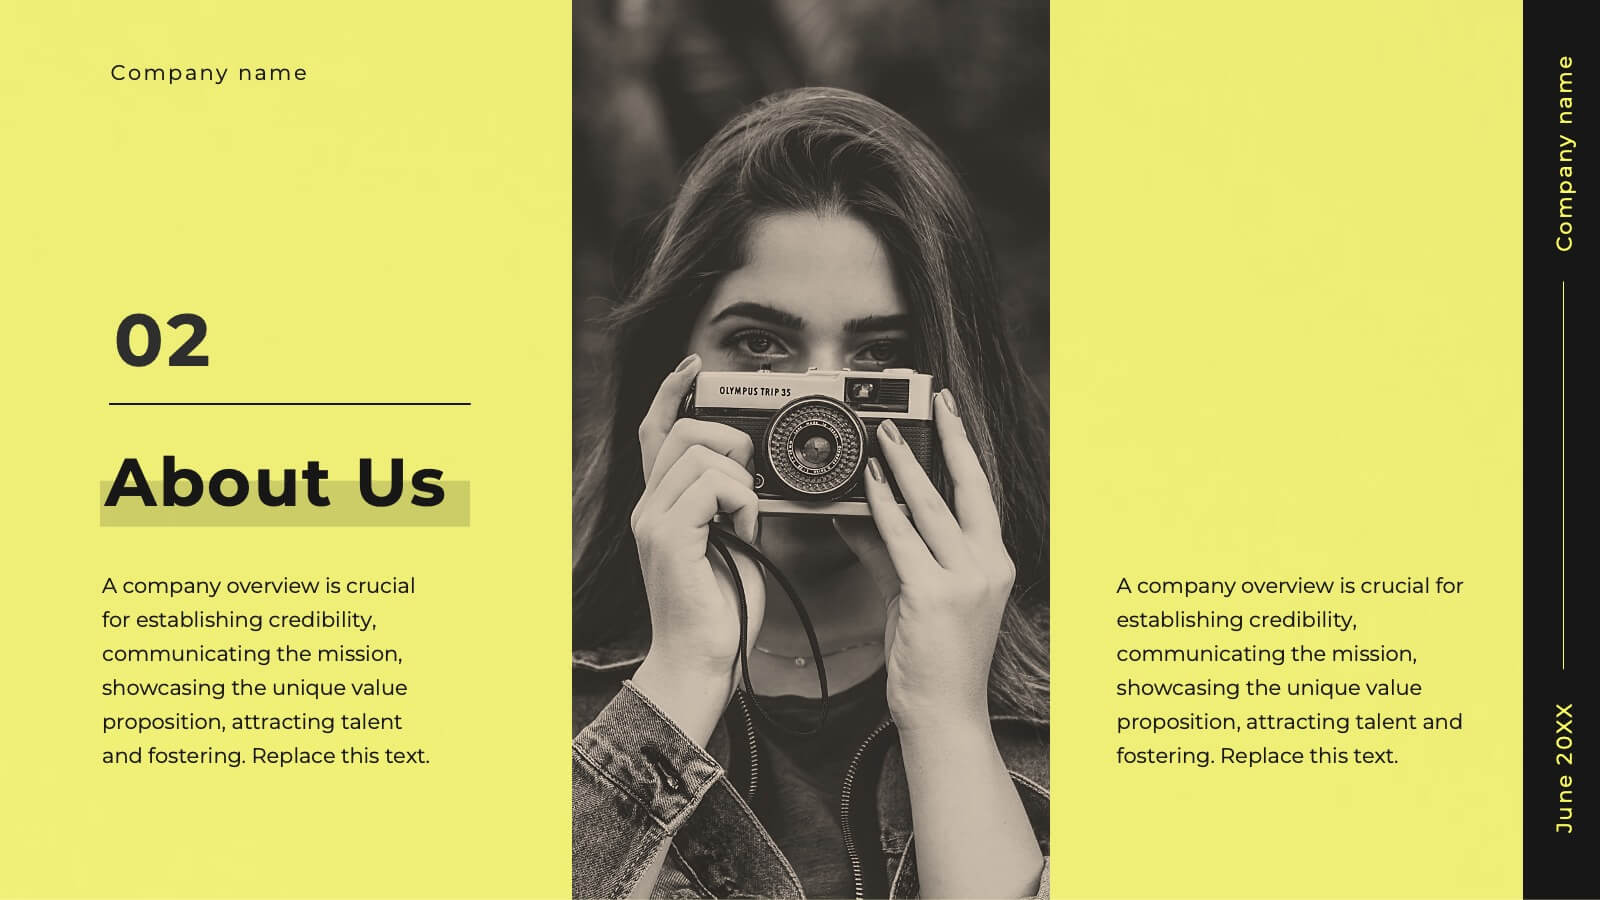
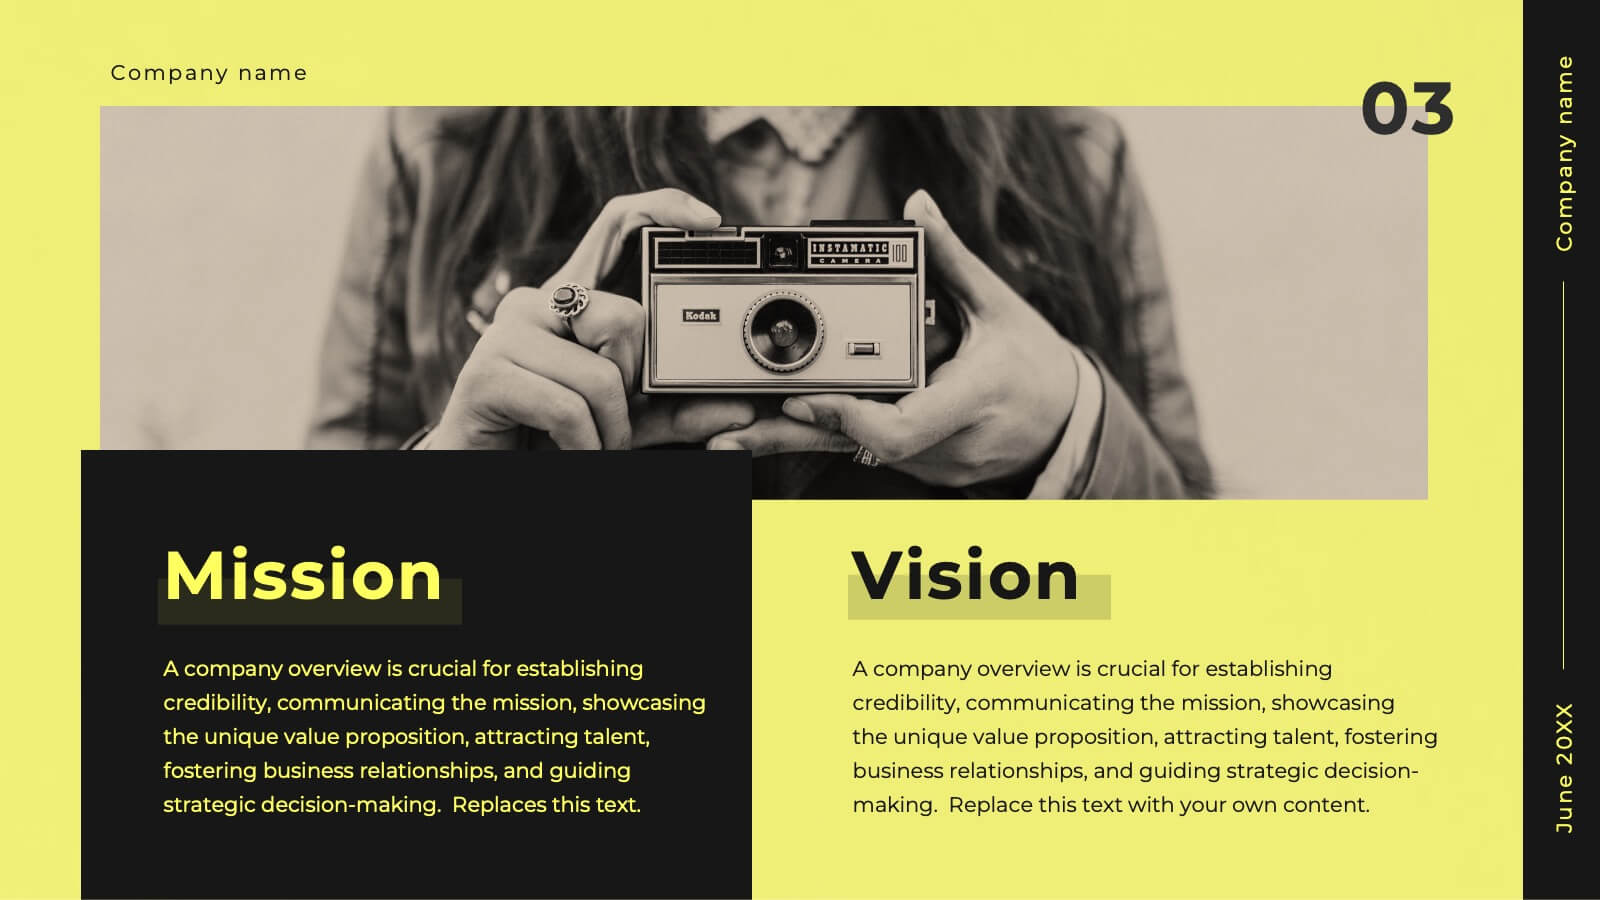
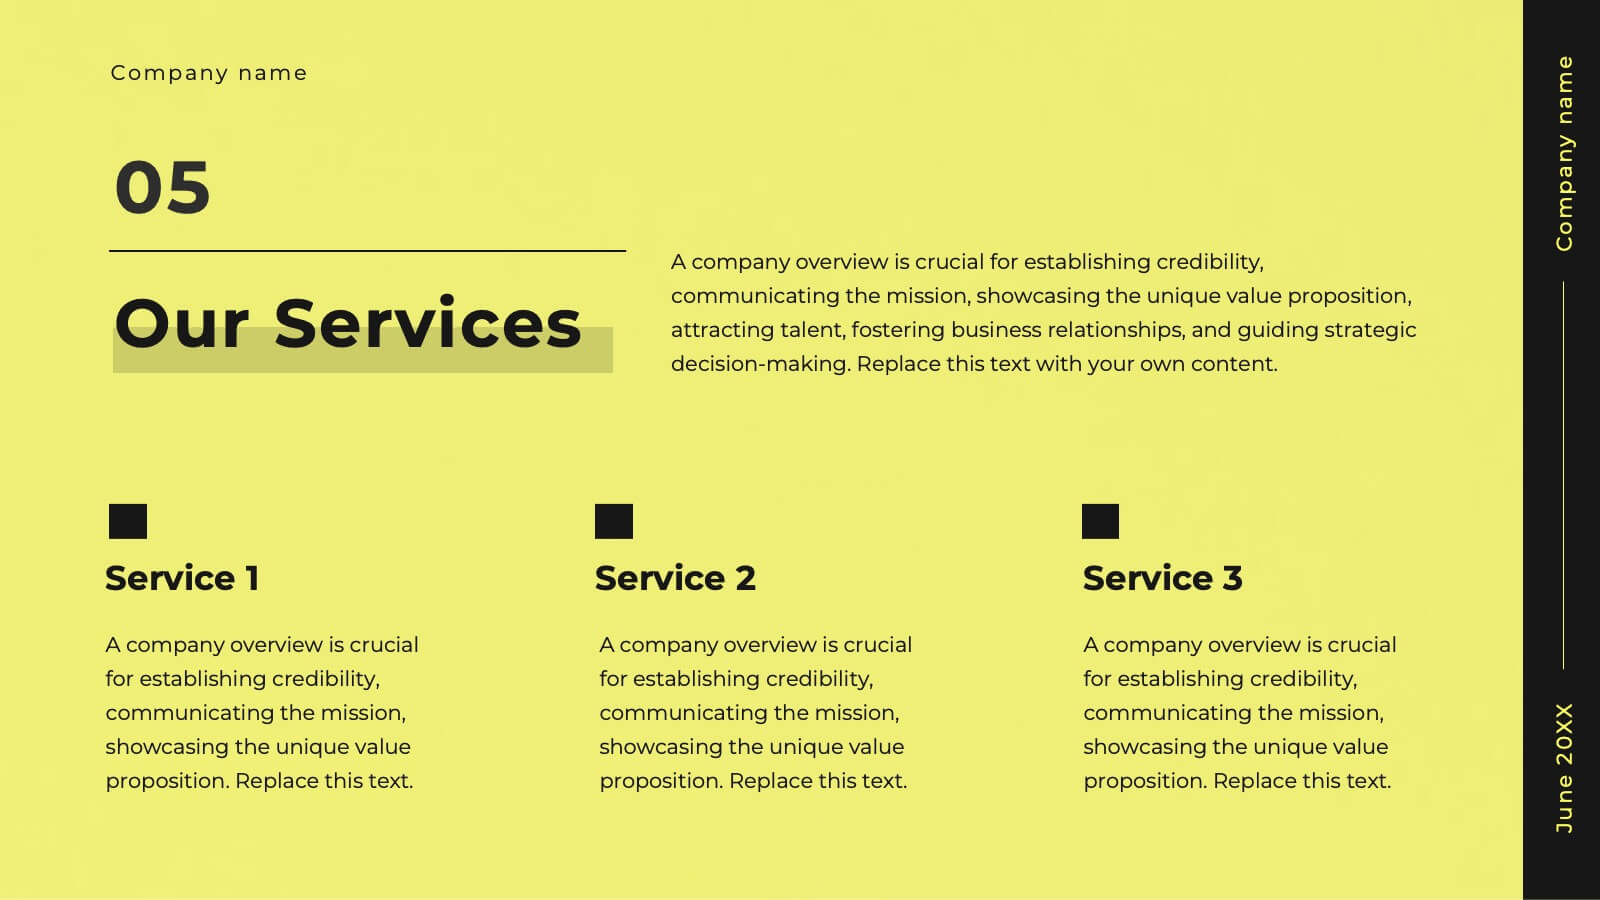
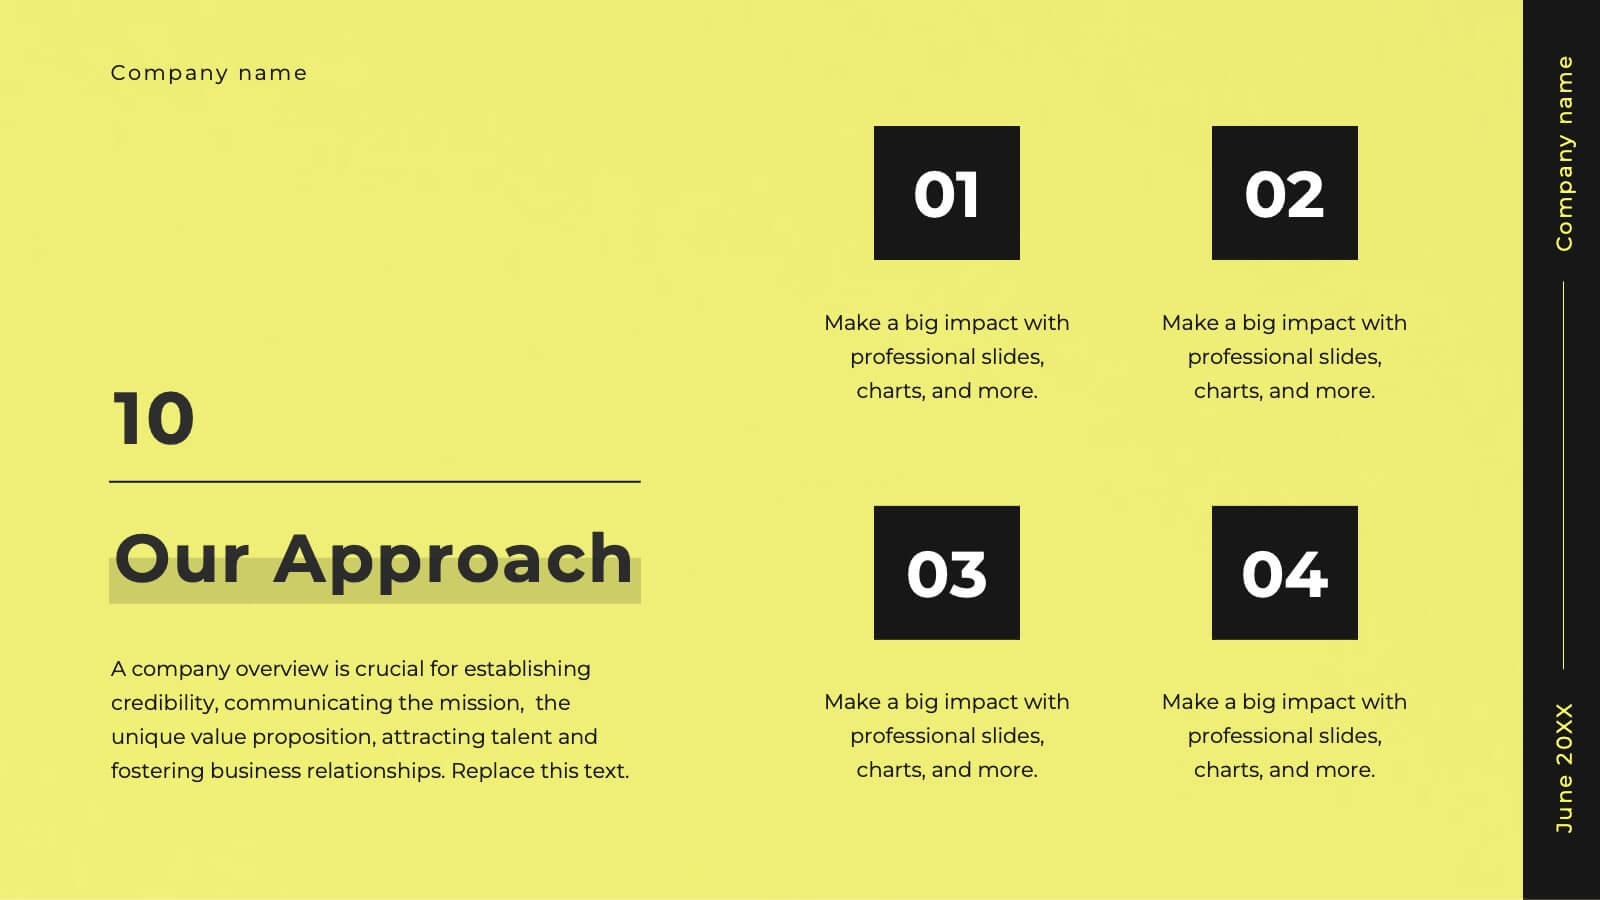
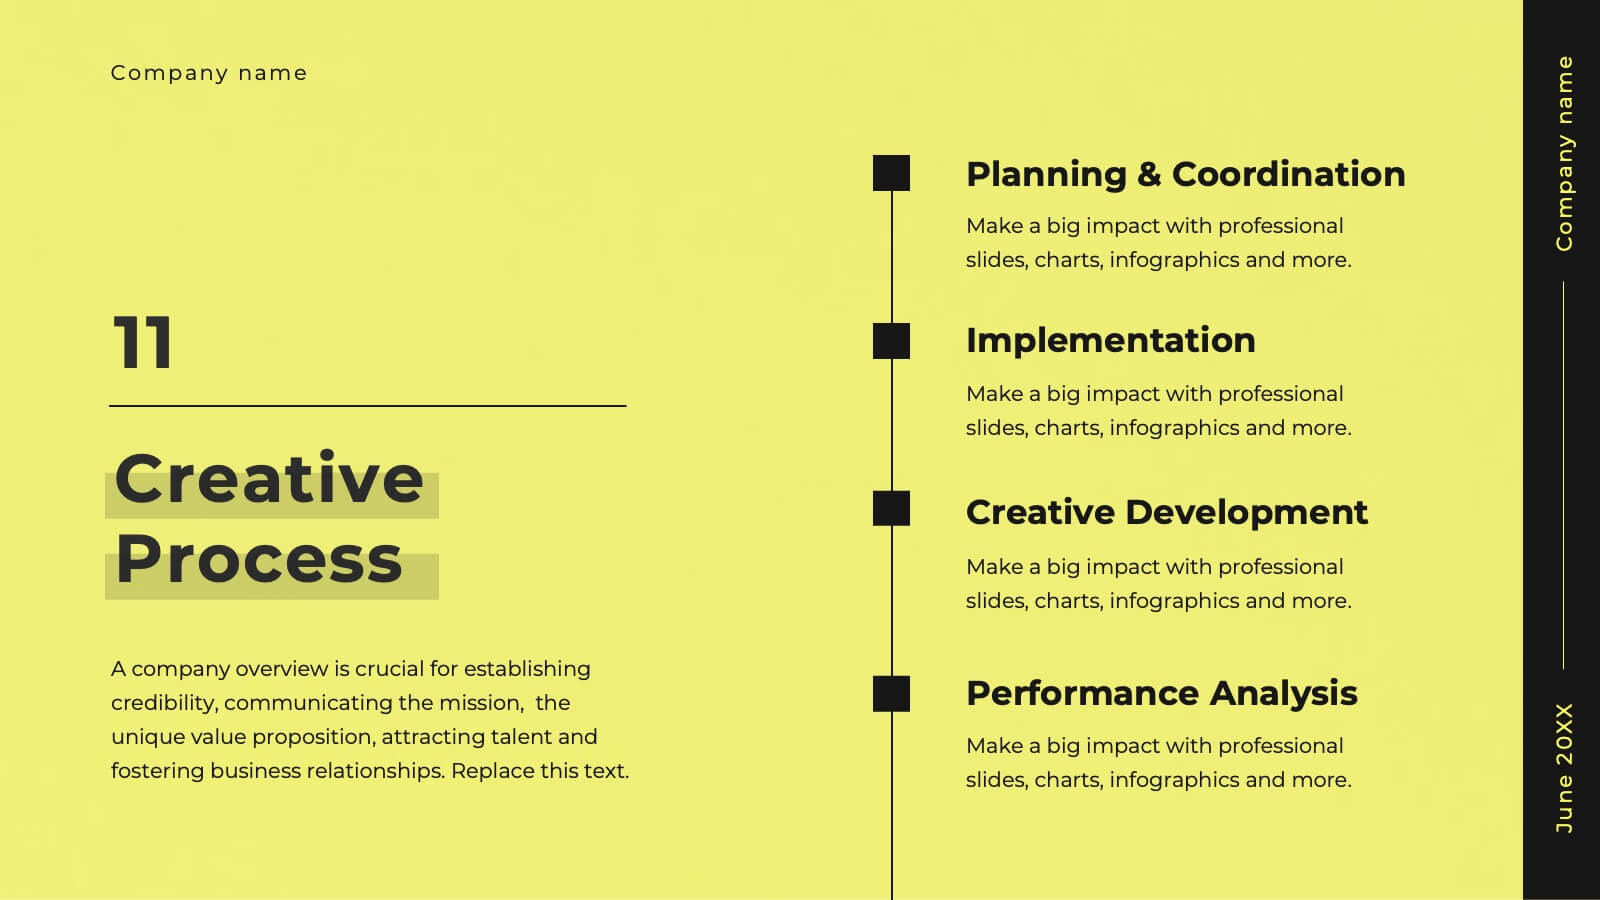
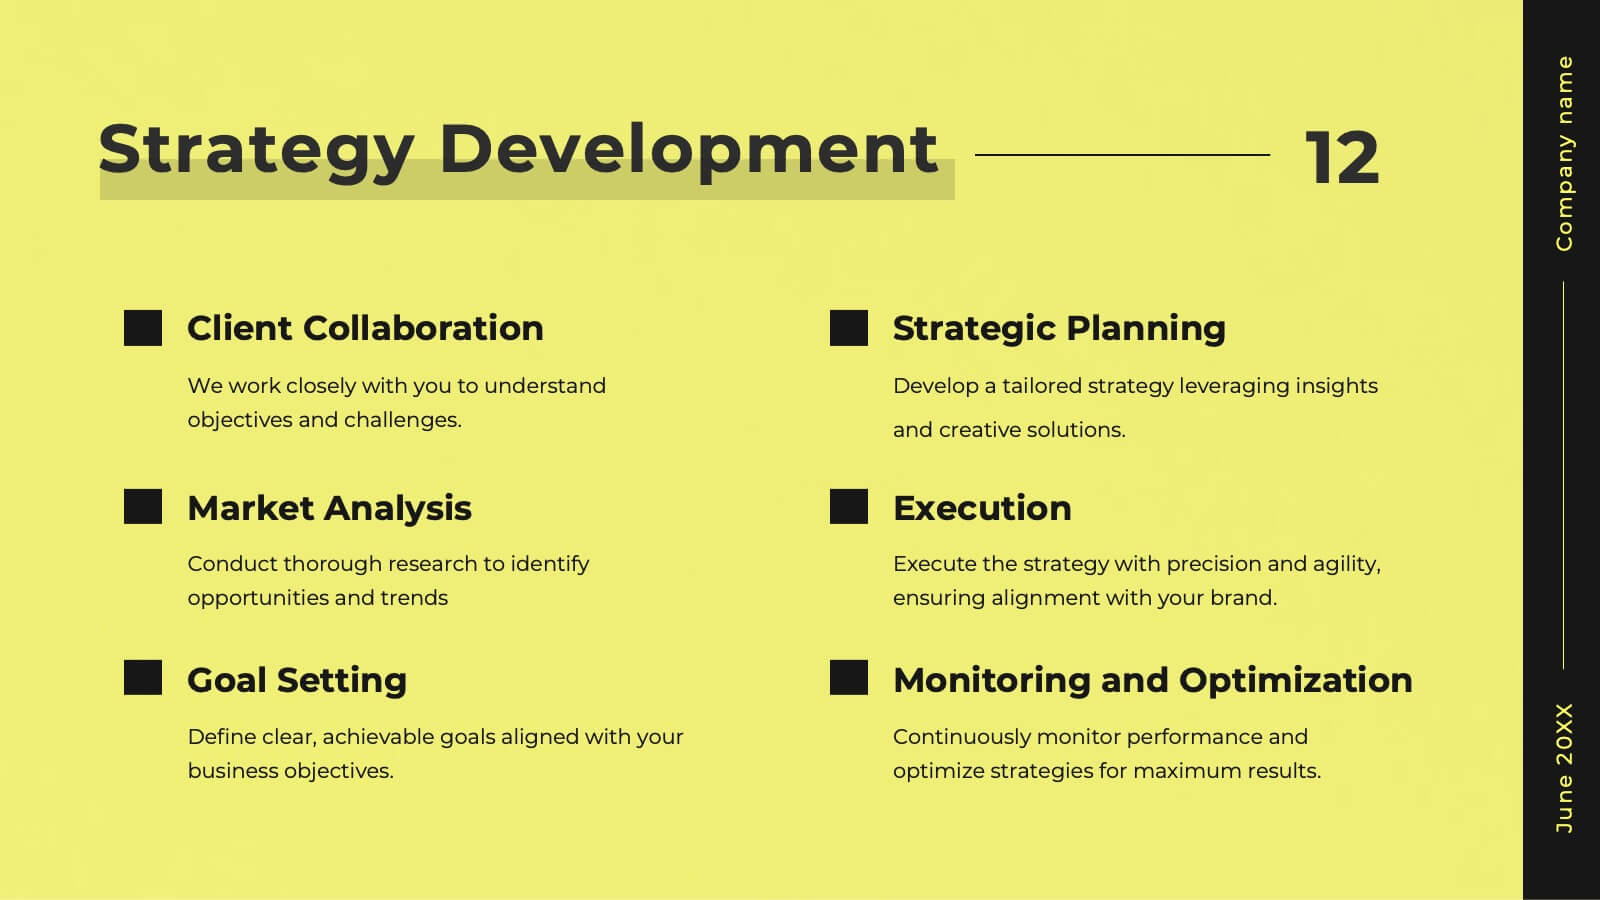
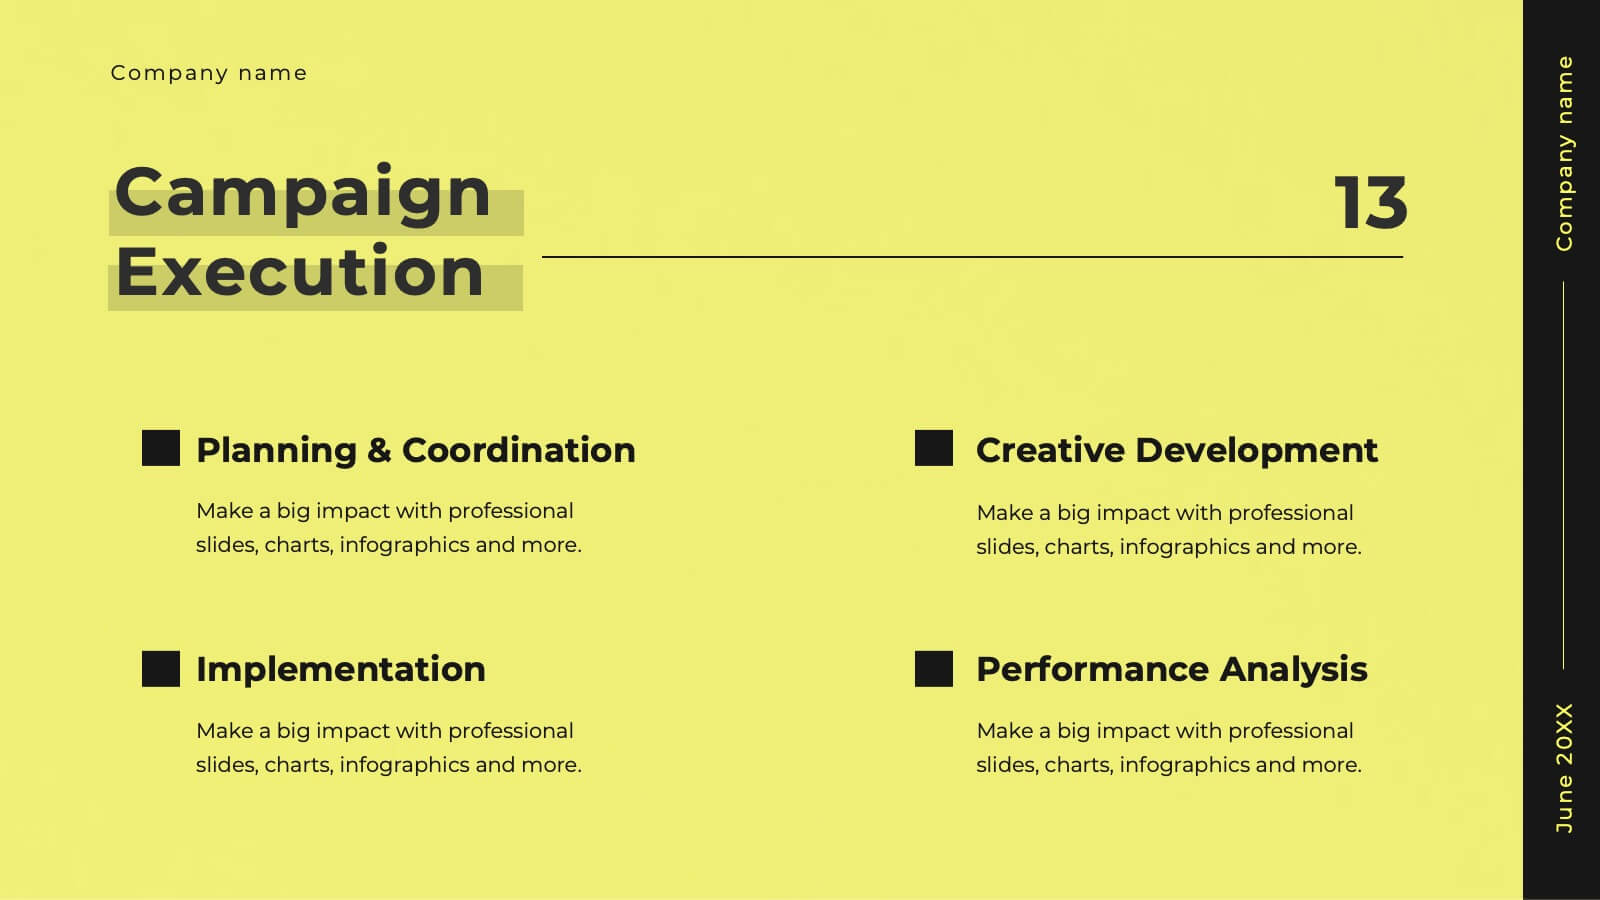
Glimmer Creative Agency Pitch Deck Presentation
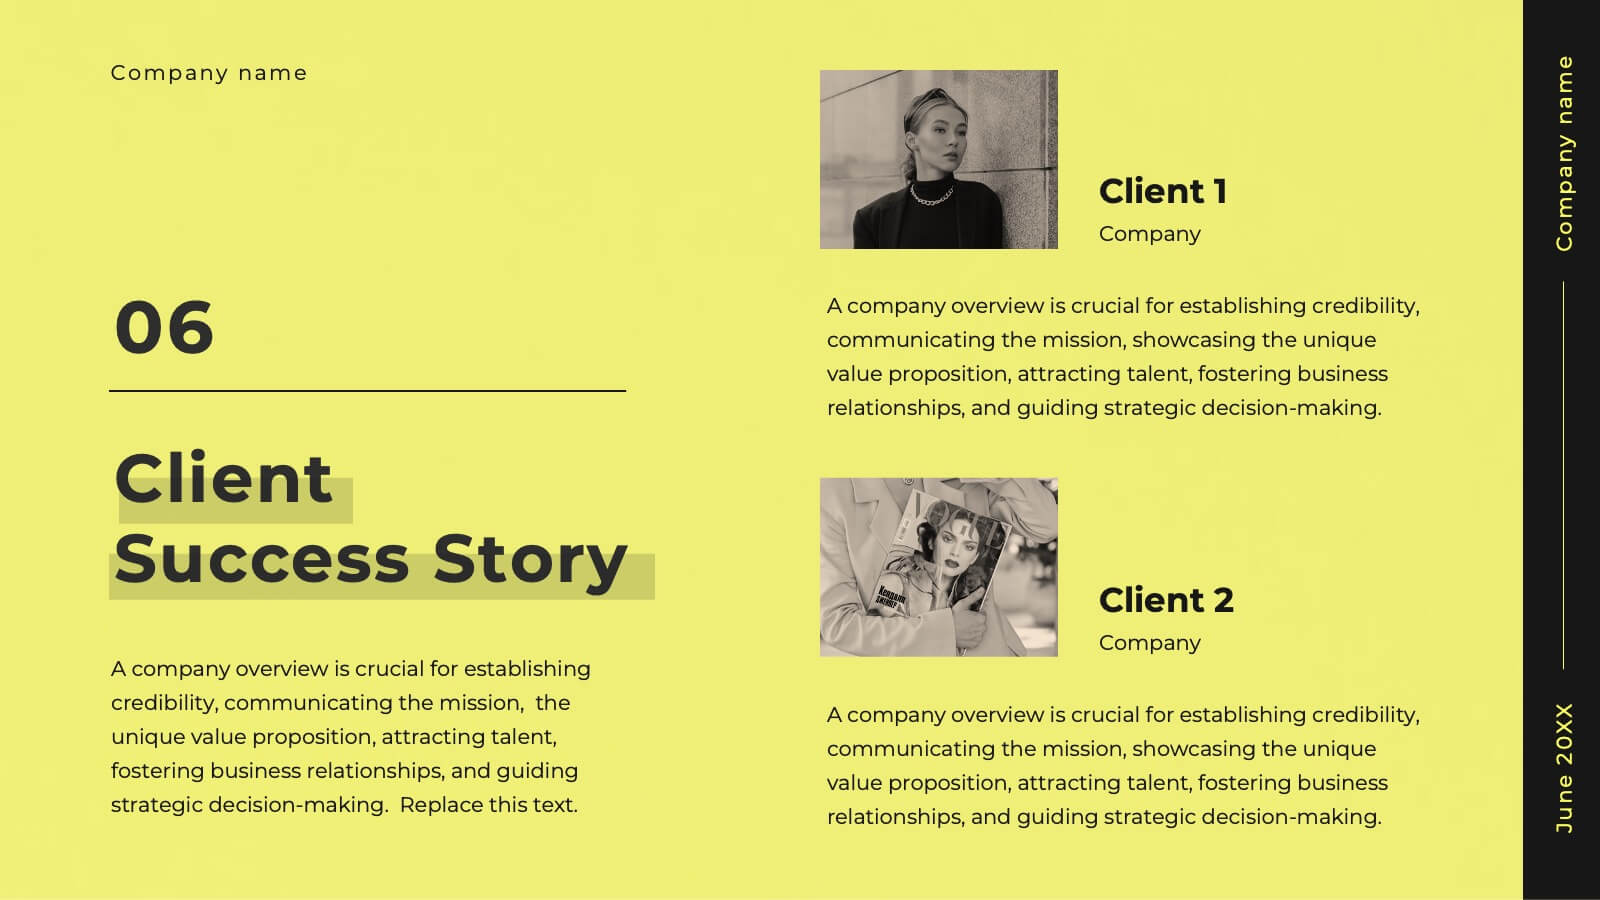
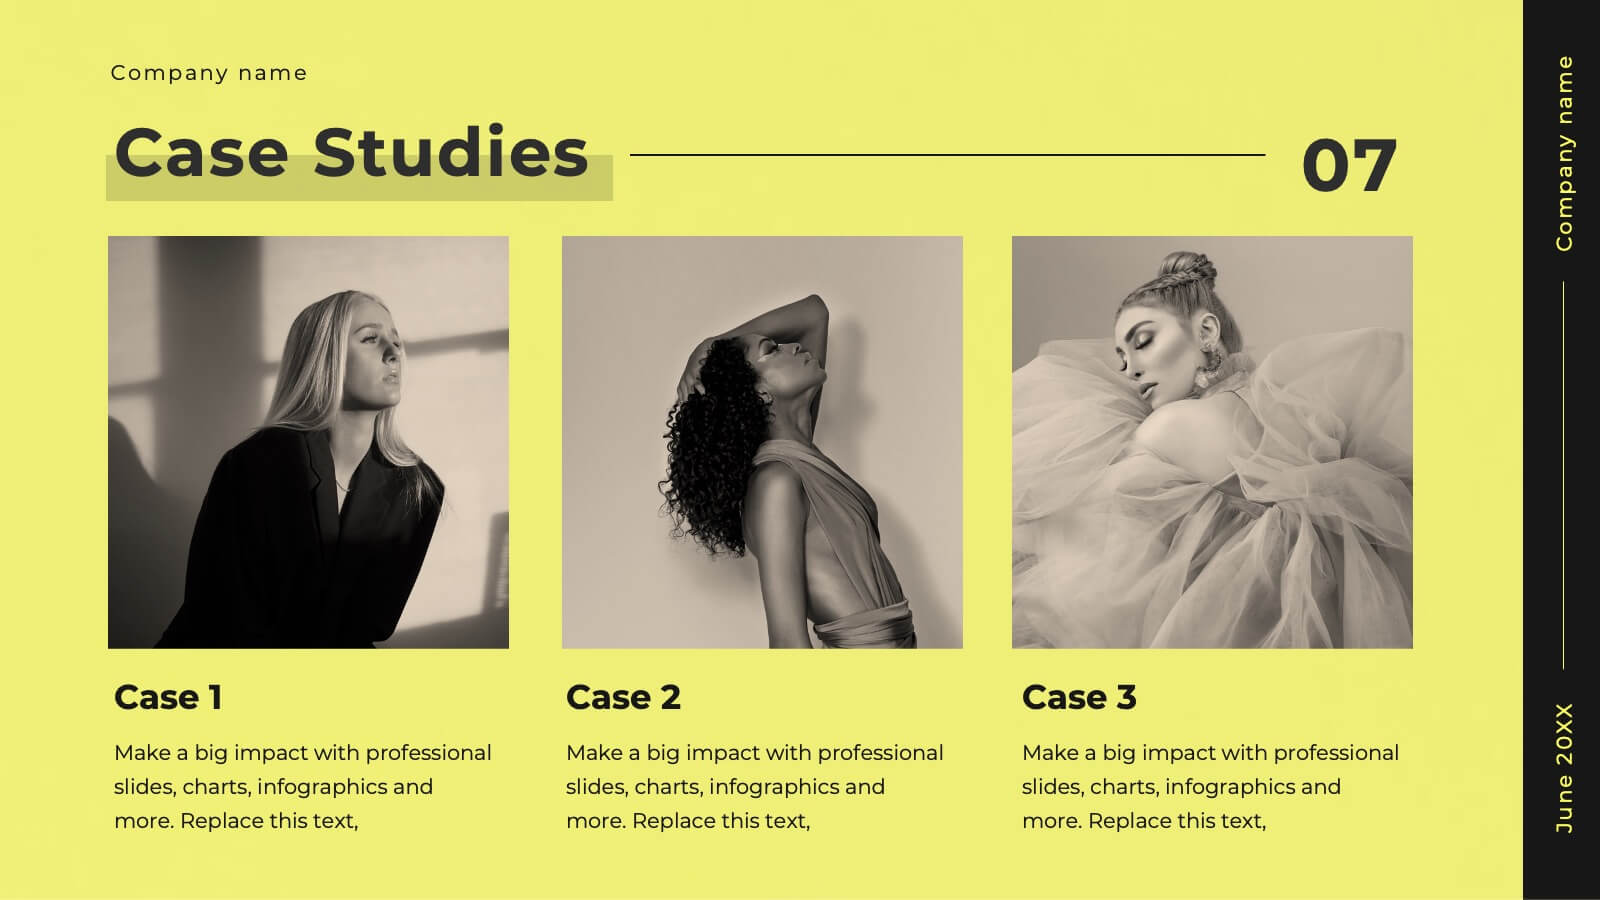
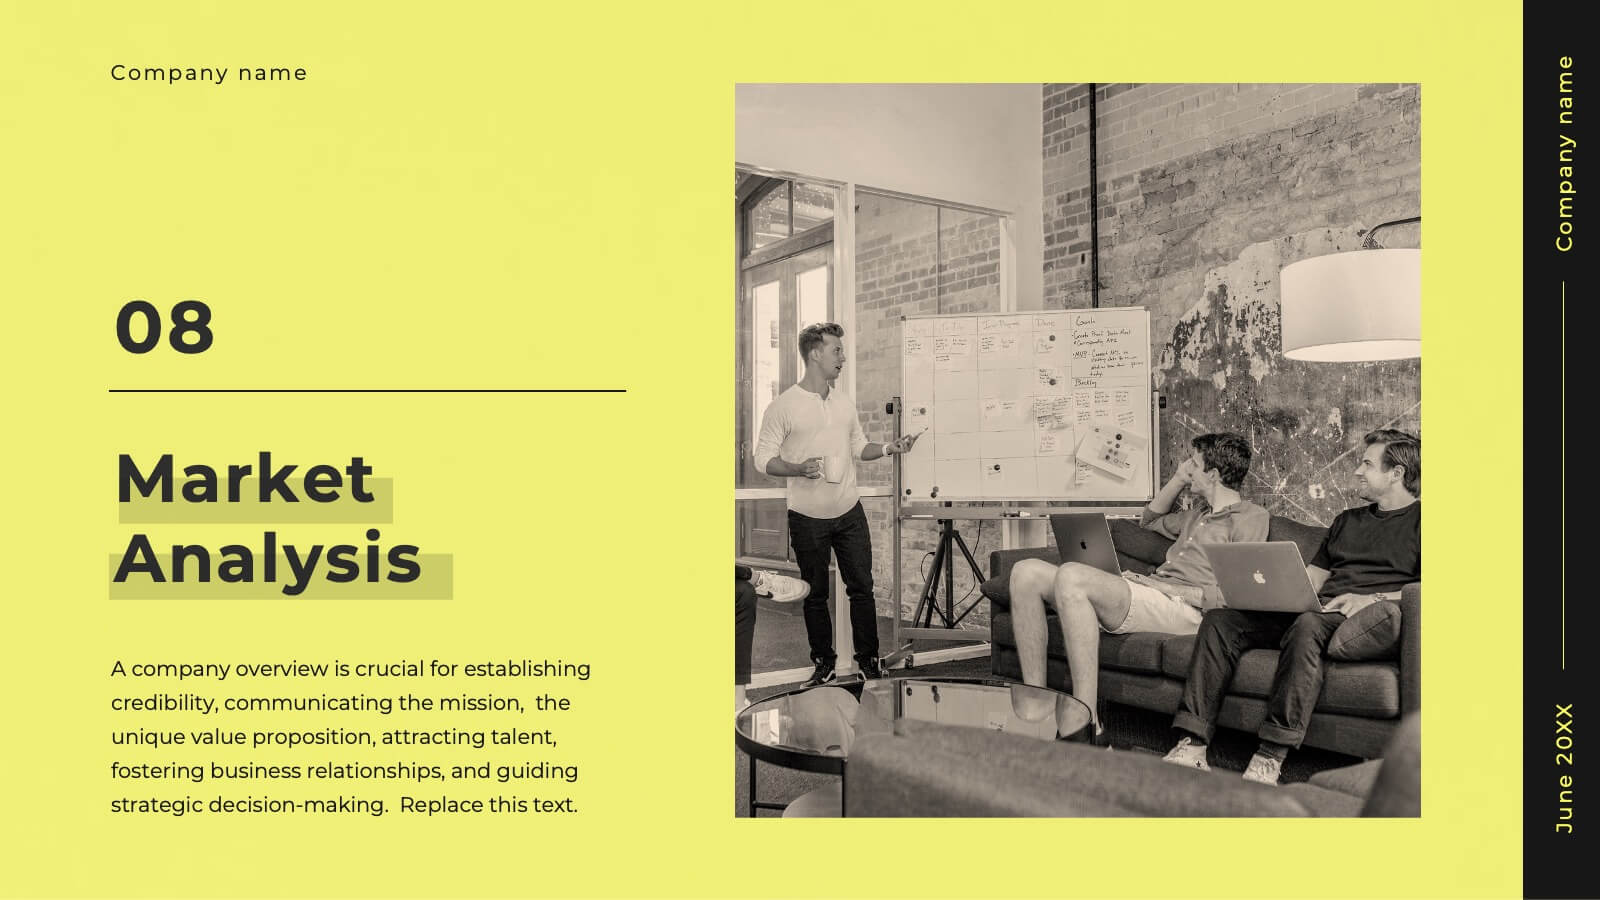
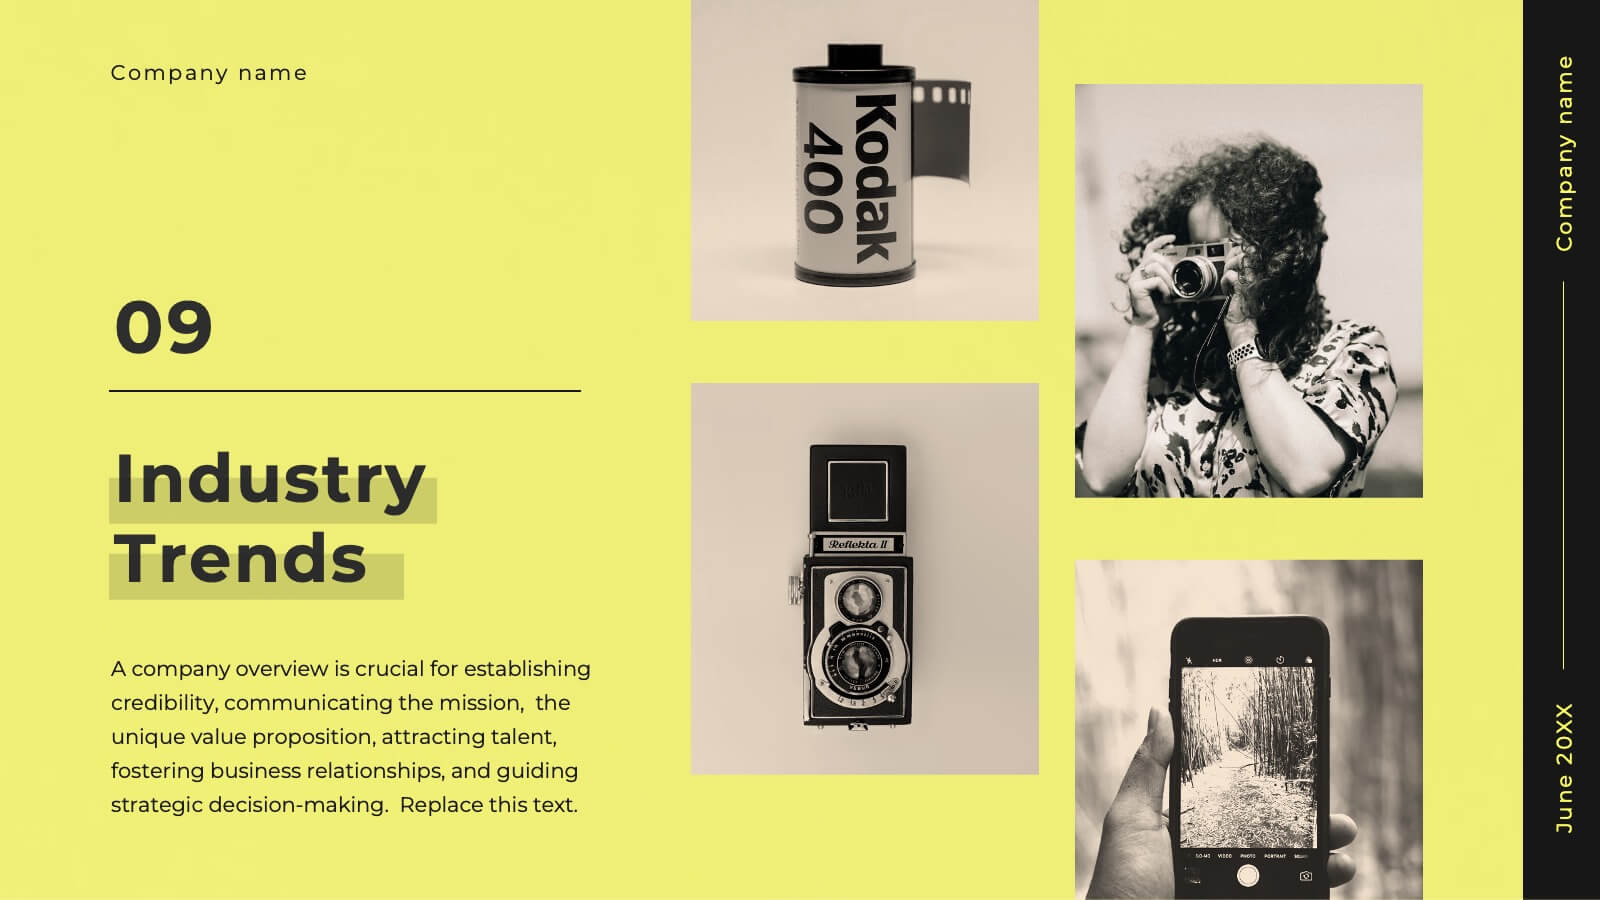
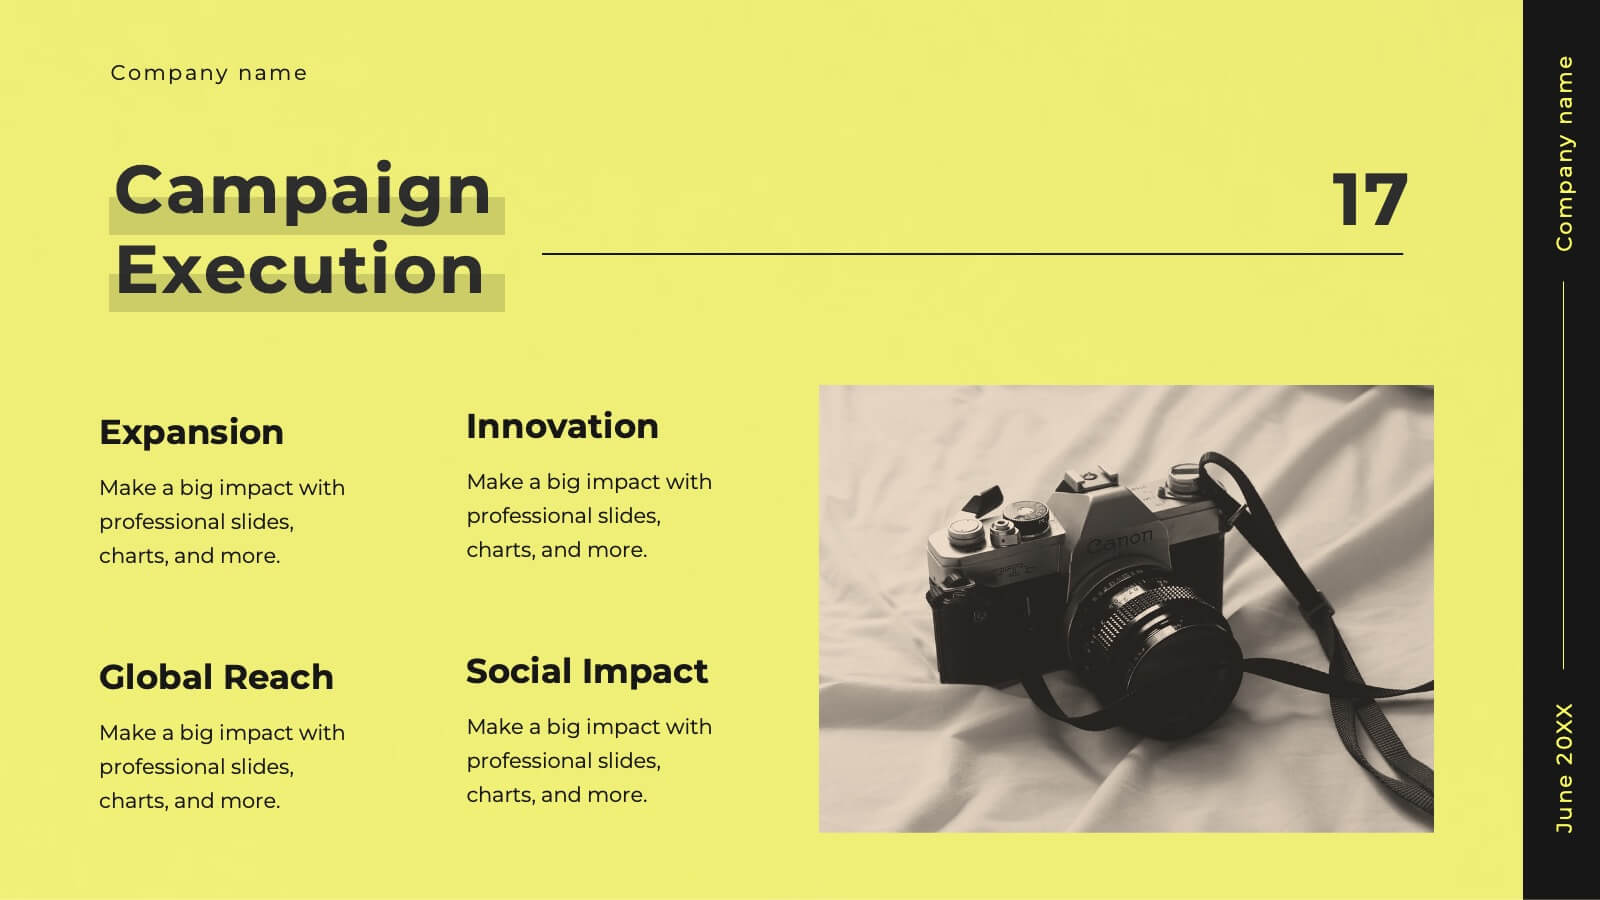
Step up your game with this vibrant agency pitch deck template! Ideal for showcasing your services, client success stories, and strategic approach, it includes dynamic slides for market analysis and campaign execution. Engage potential clients with compelling visuals and well-organized content. Compatible with PowerPoint, Keynote, and Google Slides for a smooth presentation experience on any platform.


22 slides
Zephyr Product Launch Pitch Deck Presentation
Step into the spotlight with this modern and captivating product launch pitch deck! Designed to showcase your ideas with clarity, it covers every key aspect from market opportunities to financials. Impress investors with strategic insights and sleek visuals that guide them through your business plan. Perfect for PowerPoint, Keynote, and Google Slides!


4 slides
Business Report Conclusion Slide Presentation
Summarize findings with impact using the Business Report Conclusion Slide Presentation. This template provides a structured, four-step layout that helps you clearly present key takeaways, data highlights, or action points. Clean design with icon integration makes it easy to follow. Fully editable and compatible with PowerPoint, Keynote, and Google Slides.


7 slides
Agriculture Infographics Presentation Template
Our Agriculture Infographic template is a great way to present your information about the structure, process and procedures of agricultural. This template includes a set of slides with illustrations and charts that will help you make an eye-catching presentation in just minutes. This template has been designed for use in PowerPoint, and is well-suited for both personal and business use. This infographic template is a perfect choice for presenting the statistical data about agriculture, such as product and service, market share and revenue, production levels and other information.


5 slides
Modern Business Pitch Presentation
Stand out in any meeting with a sharp, minimalist design that brings your business story to life. This presentation is perfect for outlining goals, showcasing data, and pitching ideas with confidence. Fully editable and compatible with PowerPoint, Keynote, and Google Slides for easy, professional customization.


7 slides
Harvey Ball Infographics Presentation Template
Featuring our Harvey Ball Infographic template, this is best used for presenting data from a variety of sources in an interactive way, showing charts and graphs, with the main point highlighted by using a bullet-pointed list at the bottom of the slide. This presentation template was designed to help you put your data into a visual representation that will capture the attention of your audience. This is great for business presentations and data visualizations, it is simple to create a professional looking presentations that will showcase your data in the most effective way possible.


8 slides
Editable SWOT Infographic Presentation
Analyze your business strategy with the Editable SWOT Infographic Presentation. This modern and professional template highlights Strengths, Weaknesses, Opportunities, and Threats in a visually structured format. Perfect for business planning, competitive analysis, and decision-making, it allows for easy customization of colors, text, and layout. Fully compatible with PowerPoint, Keynote, and Google Slides, ensuring seamless editing and presentation.


7 slides
Performance Cycle Infographic Presentation
A Cycle Infographic is a process-oriented model that describes an ongoing activity or a repeating task. The cycle diagrams are used to show the flow of a process as a series of steps and decisions, each with its own terminations and branches. This template is perfect for motivating, organizing and presenting tasks and projects. It can be used to highlight processes, collaboration, statistics and more. This is a colorful, creative template design for explaining key business ideas, processes or theories in a dynamic and easily digestible way. It's perfect for teaching, students and businesses.


23 slides
Ethelin Digital Strategy Presentation
The digital strategy presentation template is designed to showcase your company's goals, market analysis, and strategic initiatives. Featuring slides for SWOT analysis, performance metrics, and action plans, it’s perfect for business planning and stakeholder engagement. Fully customizable and compatible with PowerPoint, Keynote, and Google Slides.


5 slides
Team Collaboration Goals Presentation
Bring your teamwork vision to life with a clean, engaging layout that makes every goal feel clear and achievable. This presentation helps you outline priorities, align roles, and highlight shared milestones in a visually balanced format. Perfect for project kickoffs or planning sessions. Fully compatible with PowerPoint, Keynote, and Google Slides.


7 slides
Business Plan Infographic Presentation Template
A business plan is a document that is prepared by entrepreneurs and analysts to support the decision of making a business venture. It typically helps individuals in raising capital and obtaining funds for their new ventures. A business plan often involves multiple steps that can be elaborate, sometimes difficult to explain during presentations in front of potential investors if not summarized properly. This is a comprehensive template that has all of the most important features of a well thought out business plan. This professional template that will present your plan in a sophisticated way.


6 slides
Corporate Vision and Mission Presentation
Present your company’s purpose with clarity using this Corporate Vision and Mission Presentation. Featuring modern visuals, bold typography, and image placeholders, this layout highlights your strategic goals effectively. Perfect for company profiles, startup decks, or internal briefings. Fully editable in PowerPoint, Keynote, and Google Slides for seamless customization.


22 slides
Leviathan Sales Pitch Deck Presentation
This sales pitch deck template is designed to captivate your audience with a sleek, modern design. It features key slides like problem statement, solution, business model, and financials, ensuring a comprehensive presentation. Compatible with PowerPoint, Keynote, and Google Slides, it's perfect for showcasing your business's unique value proposition and growth strategy.


6 slides
Harvey Ball Comparison Chart Presentation
Turn data into insight with this clean and colorful presentation design. Ideal for visualizing comparisons, progress levels, or product evaluations, it makes complex information easy to read and interpret. Fully editable and compatible with PowerPoint, Keynote, and Google Slides, this layout ensures clarity and impact in every presentation.


8 slides
Legal Framework for Corporations
Visualize corporate compliance and governance structures with this balanced legal framework slide. Featuring a scale diagram with adjustable sections, it’s perfect for explaining regulations, policies, and corporate ethics. Ideal for law firms, corporate teams, and compliance officers. Fully editable and compatible with PowerPoint, Keynote, and Google Slides.