


Features
- 4 Unique slides
- Fully editable and easy to edit in Microsoft Powerpoint, Keynote and Google Slides
- 16:9 widescreen layout
- Clean and professional designs
- Export to JPG, PDF or send by email


Do you have any questions?
Recommend


7 slides
RACI Matrix Infographic Presentation Template
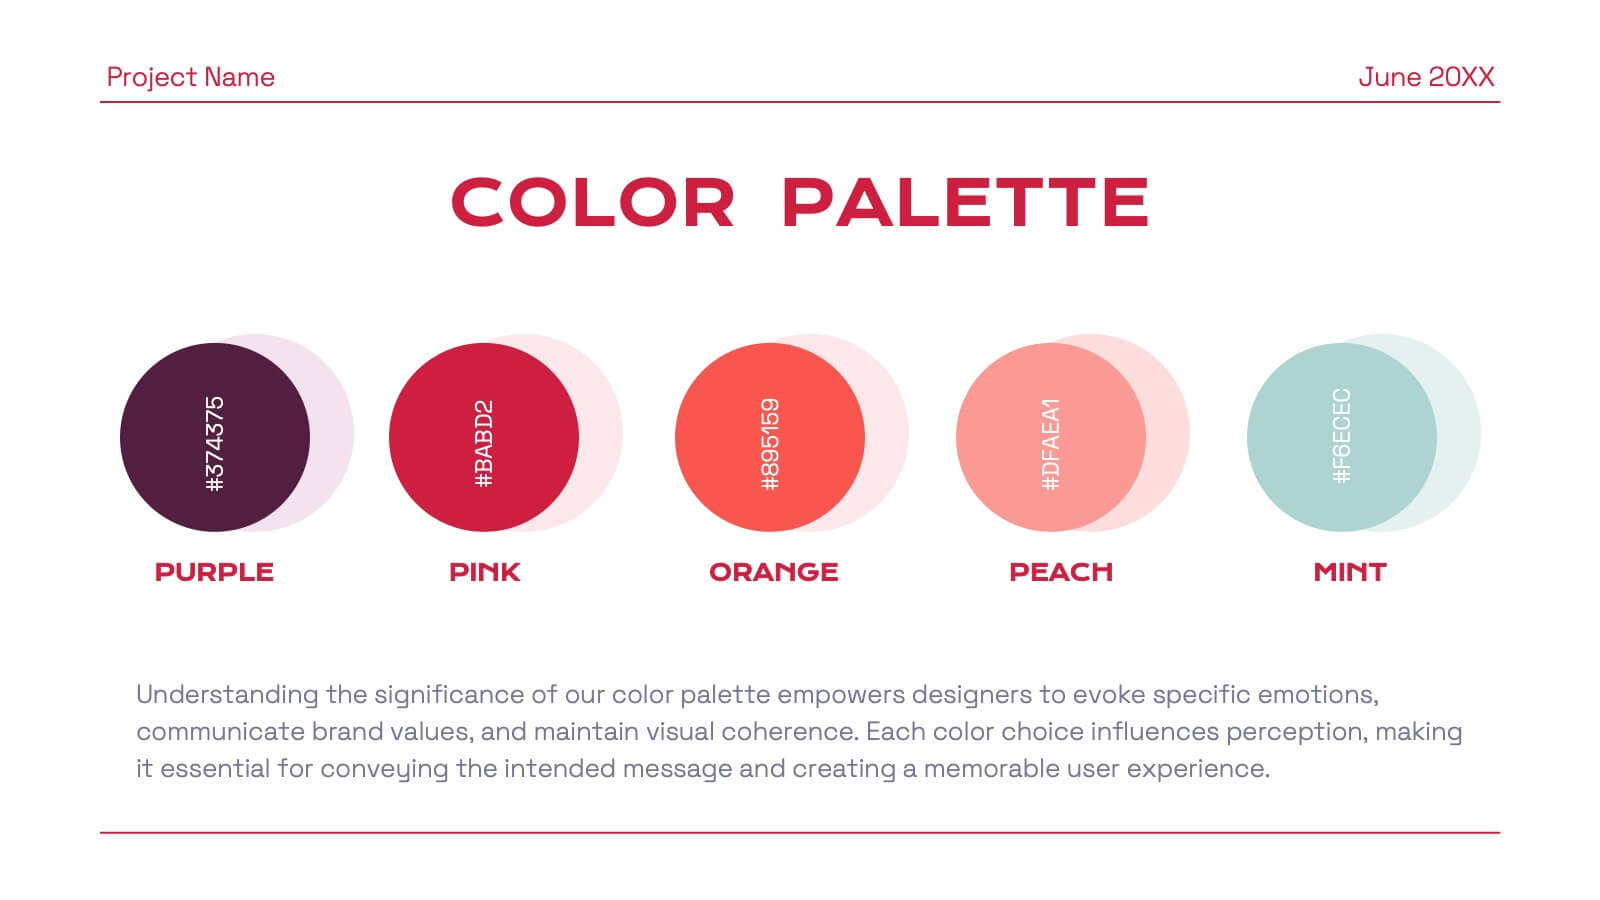
A RACI Matrix Infographic is a visual representation of the RACI model, which is used to clarify roles and responsibilities in an organization. The RACI model stands for Responsible, Accountable, Consulted, and Informed, and is a framework for defining the relationships between individuals and tasks in a project. This infographic displays a visual representation of the RACI matrix, showing the roles and responsibilities of each topic in a clear and organized manner. This Infographic can serve as a useful tool for managers and teams, as it can help to ensure clear communication and organization.


2 slides
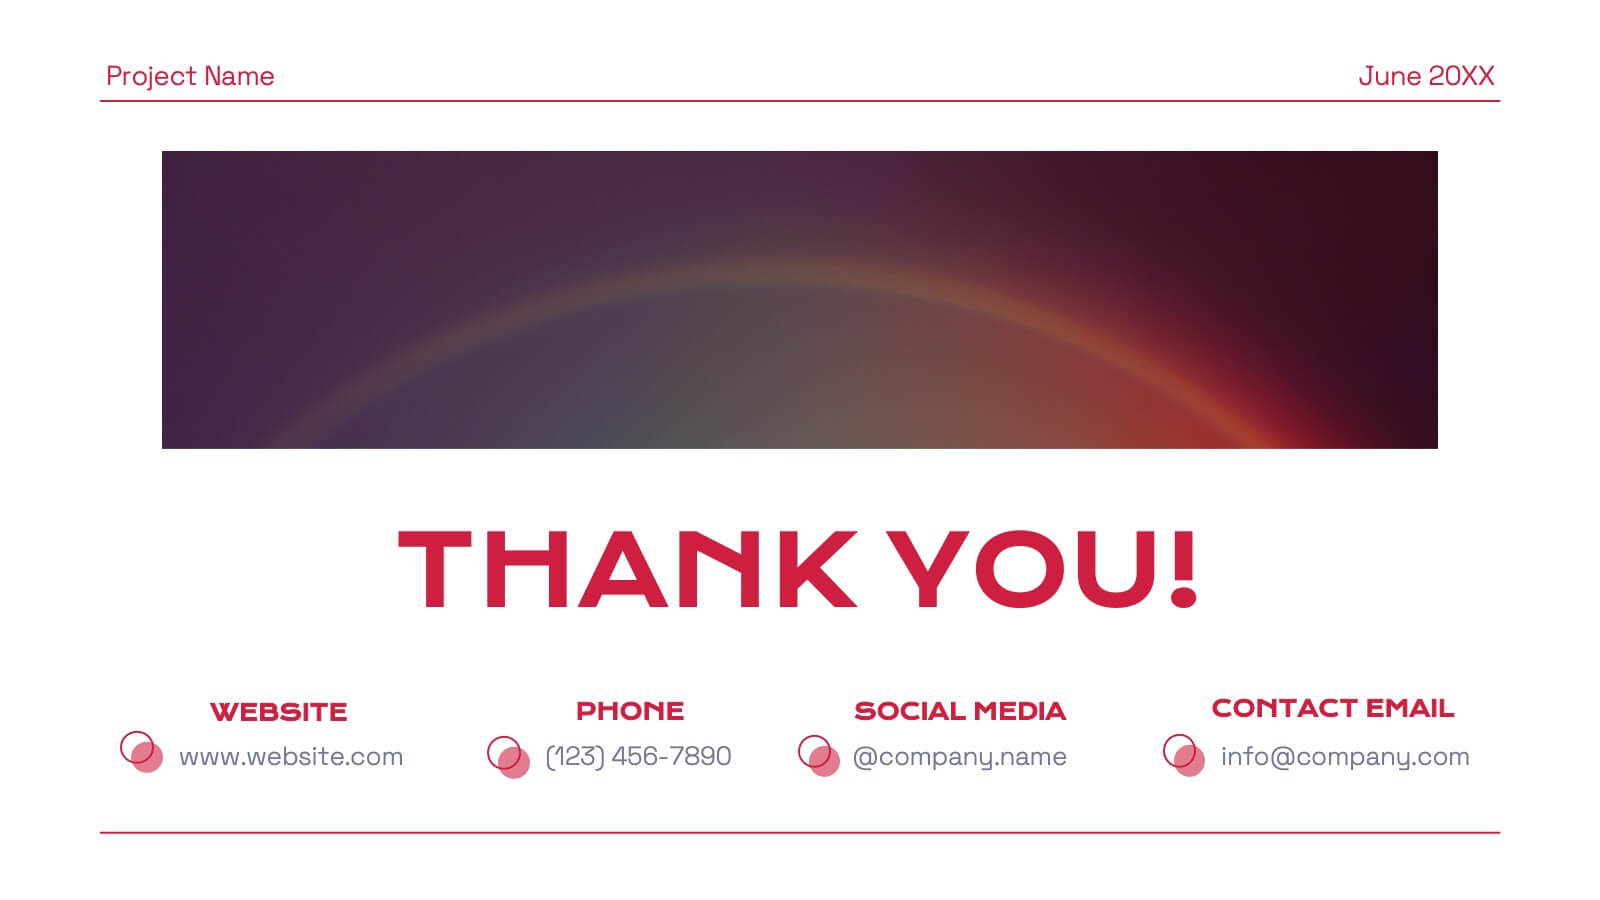
Professional Thank You Closing Slide Presentation
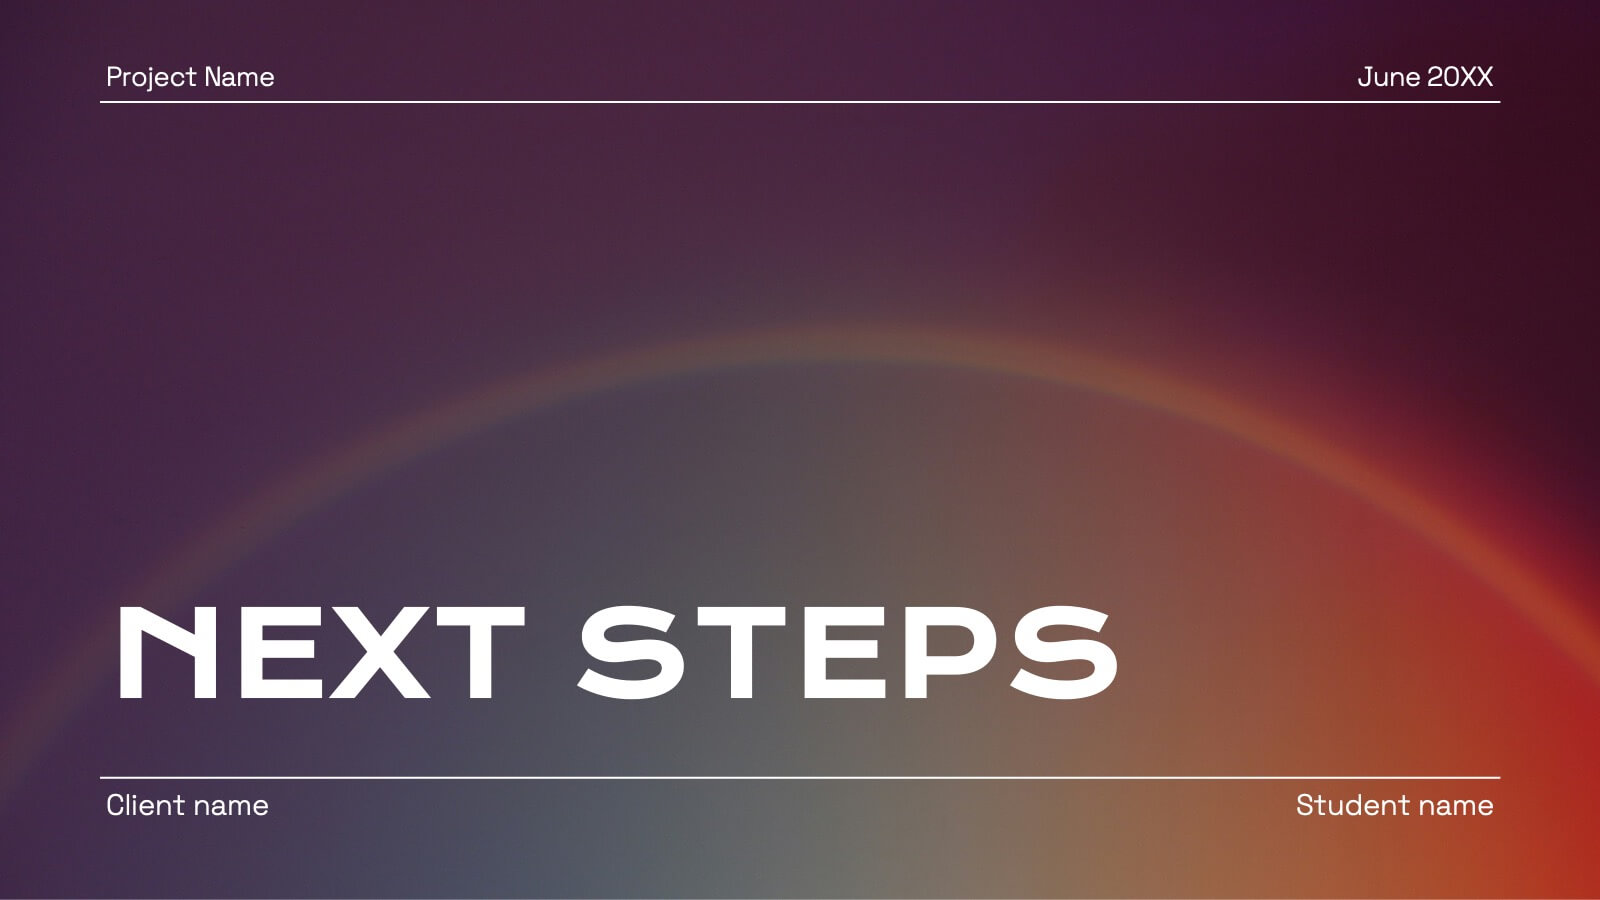
Make your last impression count with a clean, modern closing slide that wraps up your presentation in style. This template is designed to help you leave a professional mark while displaying contact info, brand visuals, or a thank-you note. Fully compatible with PowerPoint, Keynote, and Google Slides for flexible use.


5 slides
Root Cause Analysis Fishbone Format Presentation
Break down complex problems with the Root Cause Analysis Fishbone Format Presentation. Designed to identify contributing factors visually, this diagram helps teams analyze causes across multiple categories—ideal for quality control, troubleshooting, and process improvement. Fully editable in Canva, PowerPoint, or Google Slides for effortless customization.


2 slides
Creative Work Portfolio Collection Presentation
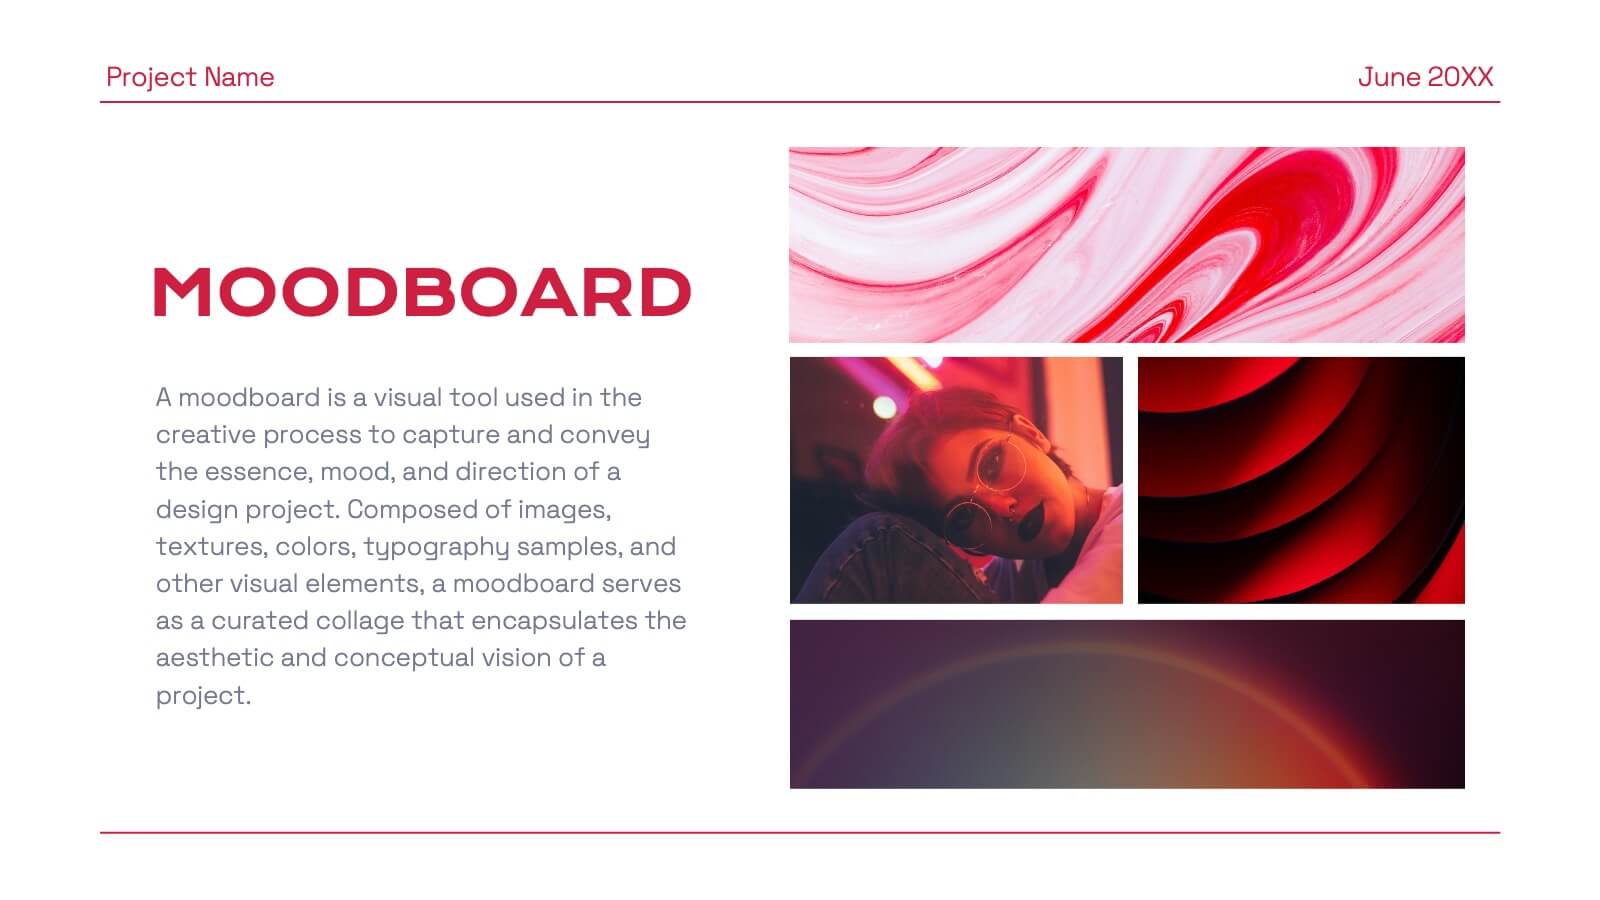
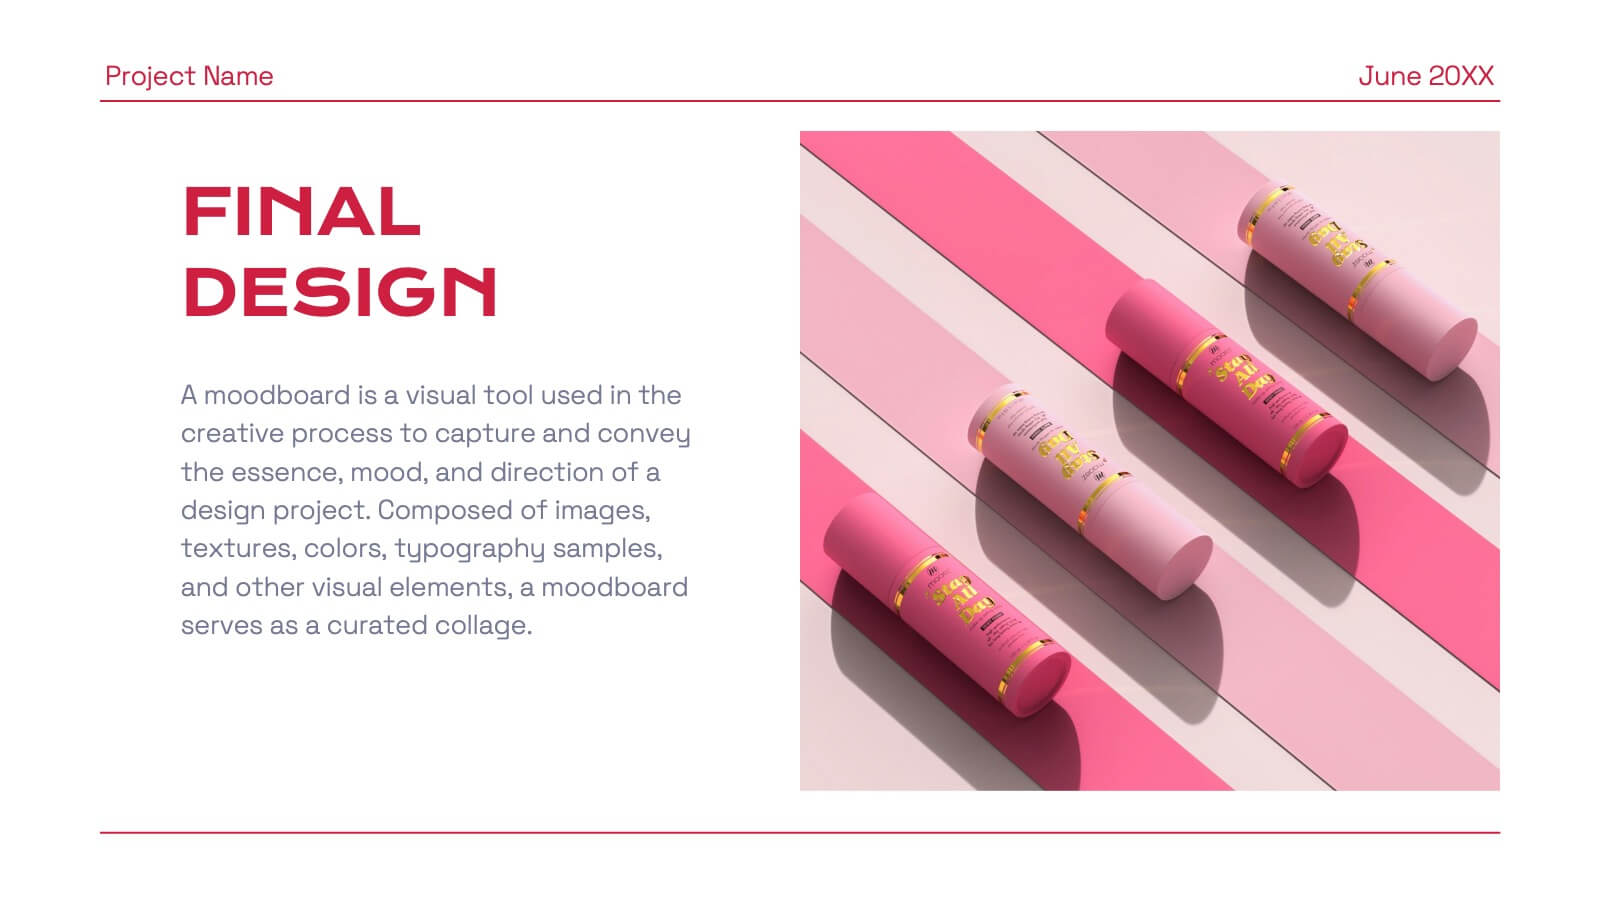
Present your projects with impact using the Creative Work Portfolio Collection Presentation. Designed for photographers, artists, and creators, this layout highlights visuals while leaving space for thoughtful captions or project notes. Easily editable and fully compatible with Canva, PowerPoint, Keynote, and Google Slides to match your brand and showcase your style.


6 slides
Root Cause Analysis Tools Infographics
Uncover the root causes of issues effectively with our Root Cause Analysis Tools infographic template. This template is fully compatible with popular presentation software like PowerPoint, Keynote, and Google Slides, allowing you to easily customize it to analyze and address complex problems. The Root Cause Analysis Tools infographic template provides a visually engaging platform to showcase various methods and techniques for identifying and mitigating root causes. Whether you're a quality assurance professional, project manager, or problem-solving enthusiast, this template offers a user-friendly canvas to create informative presentations and strategies for root cause analysis. Improve your problem-solving capabilities with this SEO-optimized Root Cause Analysis Tools infographic template, thoughtfully designed for clarity and ease of use. Customize it to highlight the tools and methodologies best suited to your specific challenges, ensuring you can effectively address issues at their core. Start crafting your personalized infographic today to enhance your root cause analysis skills.


21 slides
Frostfire Agile Project Plan Presentation
The Agile Project Plan Presentation Template features 21 cohesive slides including timelines, objectives, stakeholder analysis, and budget breakdowns. Its modern brown and lavender design ensures clarity and professionalism. Perfect for project managers and teams, it’s fully customizable and compatible with PowerPoint, Keynote, and Google Slides for seamless collaboration and presentations.


5 slides
Work Schedule Overview Presentation
Keep your week perfectly organized with this clean and modern layout designed to simplify planning and scheduling. Ideal for presenting weekly goals, tasks, or project timelines, it helps teams stay aligned and productive. Fully customizable and compatible with PowerPoint, Keynote, and Google Slides for effortless professional presentations.


4 slides
Leadership Development and Growth Presentation
Explore the dynamics of effective leadership with our Leadership Development and Growth Presentation. This template illustrates the progressive stages of leadership maturity with unique, visually appealing graphics, making it ideal for workshops and seminars. Compatible with major presentation software to ensure accessibility and ease of use.


7 slides
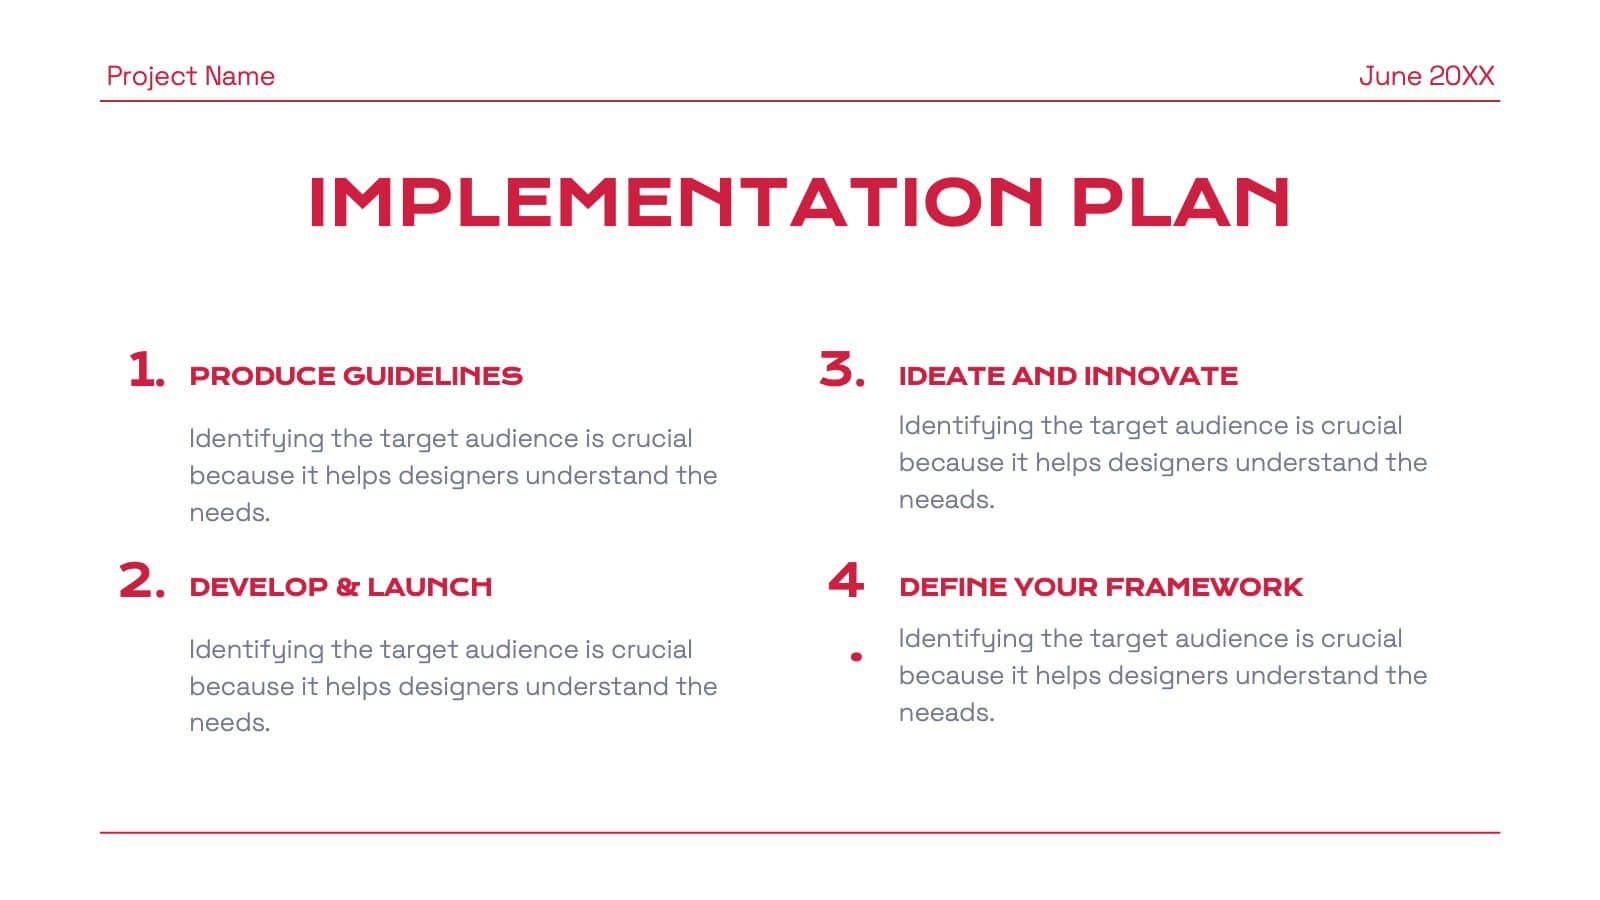
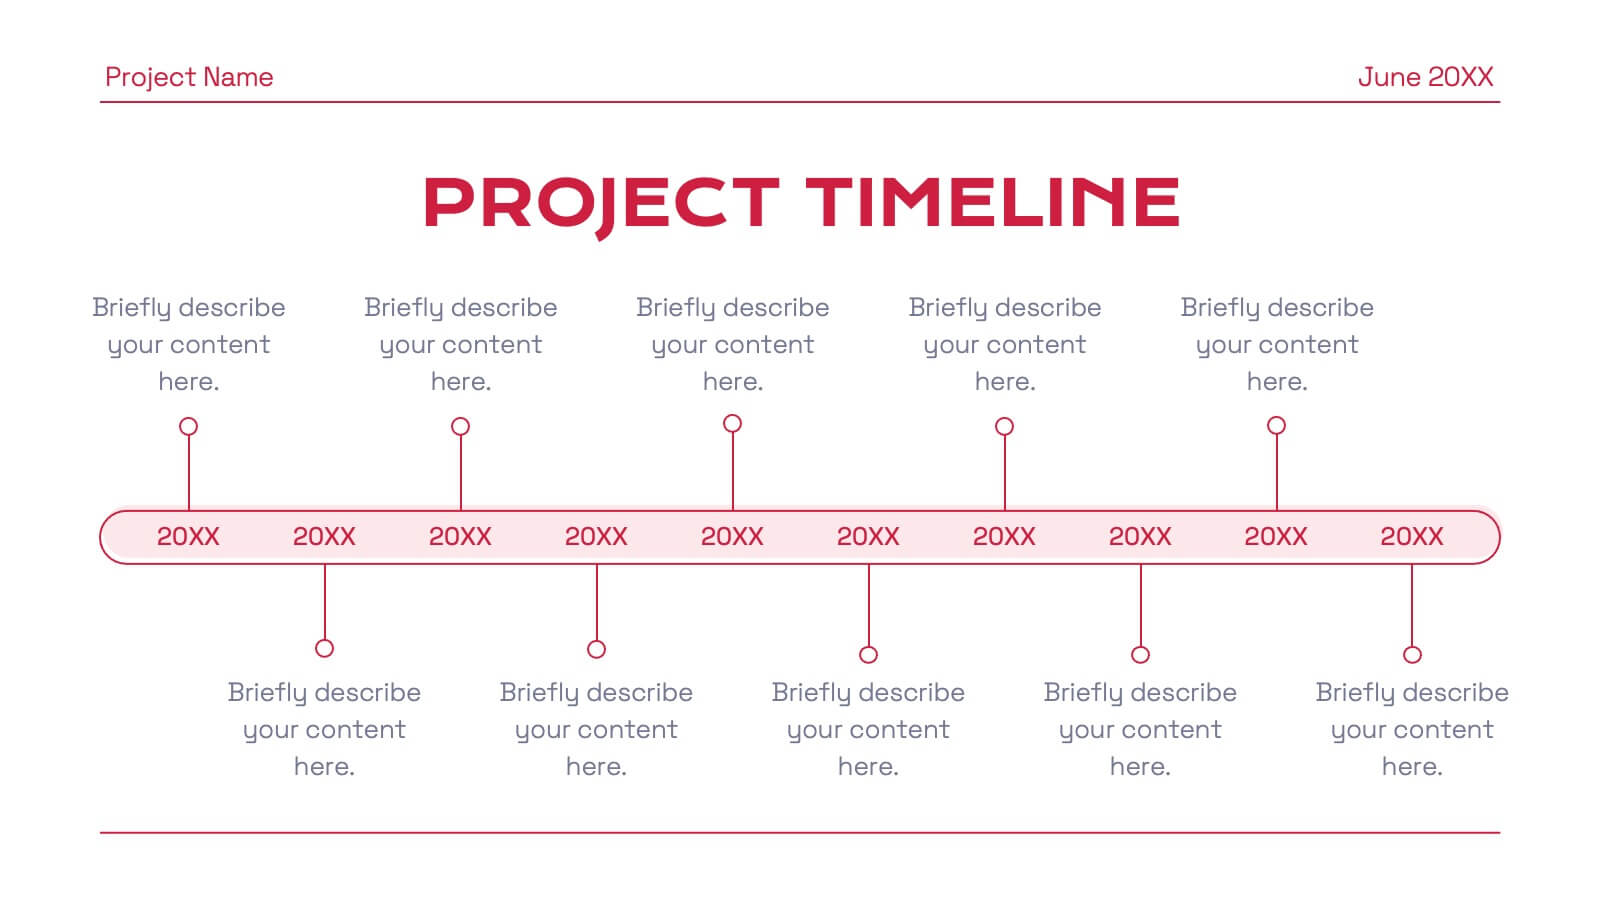
Project Timeline Presentation
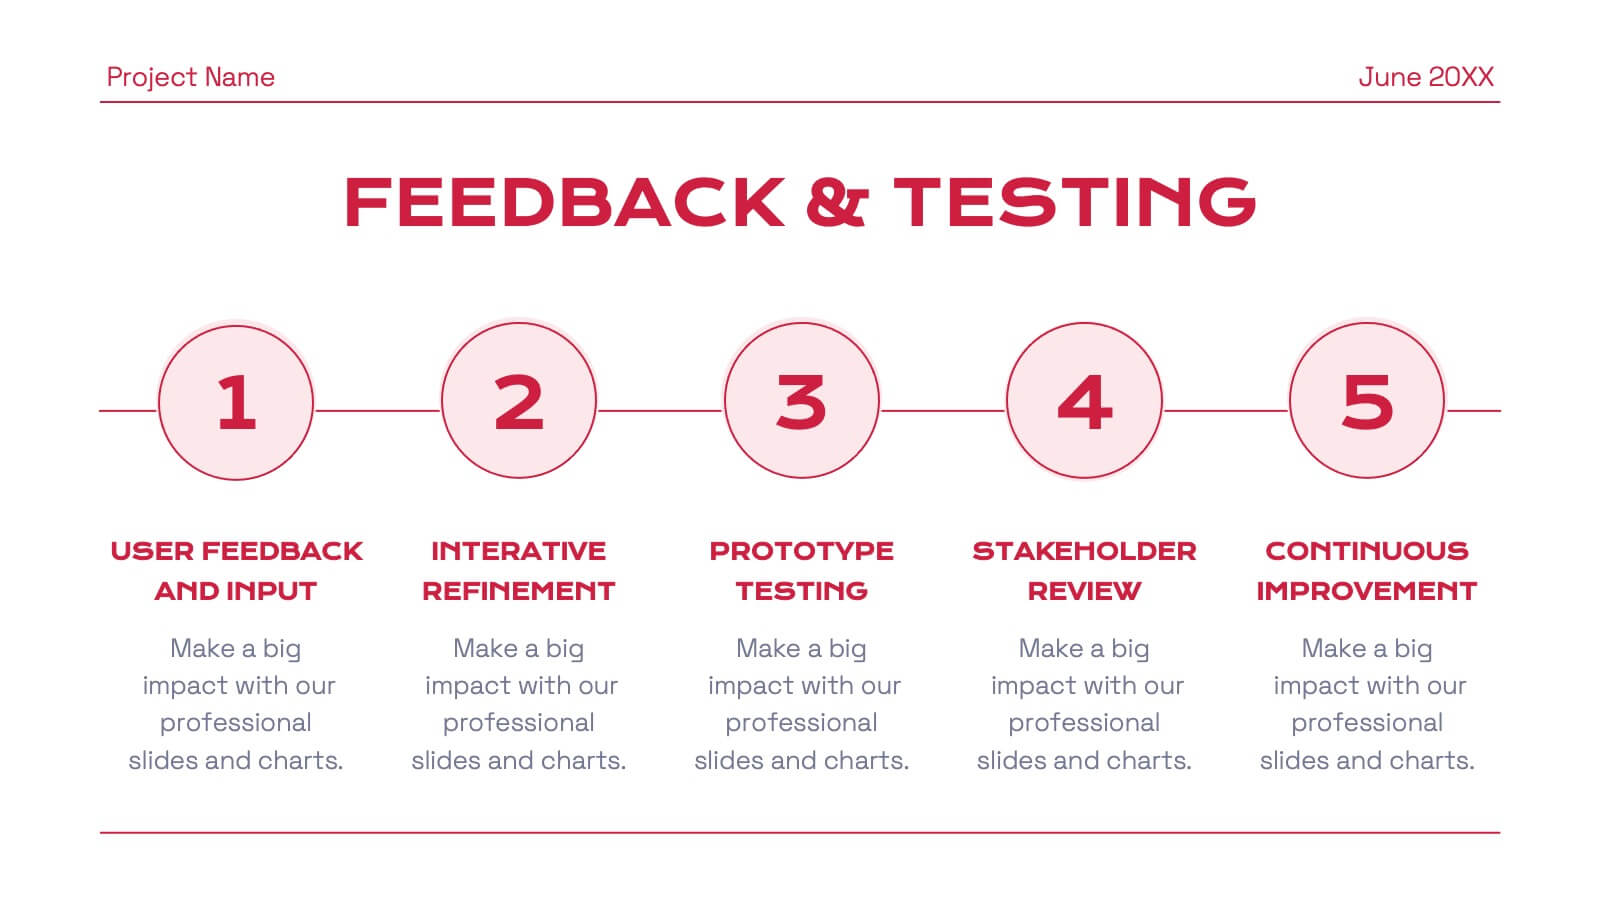
Visualize key milestones with this project timeline presentation template. Designed to highlight each phase with clarity, it's perfect for project managers, planners, and teams tracking progress. The horizontal layout, color-coded steps, and year indicators make it easy to customize in PowerPoint, Keynote, or Google Slides for any industry.


7 slides
Smart House Concept and Design Layout Presentation
Present your smart home innovations with the Smart House Concept and Design Layout Presentation. This slide features a central house icon and six circular nodes, ideal for explaining home automation systems, IoT integrations, or security features. Fully editable in Canva, PowerPoint, Keynote, and Google Slides—perfect for tech startups, product demos, and future living pitches.


7 slides
Aviation Terms Infographic
Take flight with our aviation terms infographic, designed with a serene palette of white, blue, and hints of orange that echo the hues of the sky. This meticulously crafted infographic decodes the intricate jargon of the aviation world, making it a breeze for enthusiasts, trainees, and even seasoned aviators to grasp. Ideal for flight schools, airline training programs, and aviation seminars, this infographic simplifies complex terminologies with ease. With full compatibility across PowerPoint, Keynote, and Google Slides, sharing your knowledge of the skies has never been more accessible or visually appealing.


7 slides
Growth Challenges Infographic
Navigating the path to success often involves understanding both growth and challenges. The growth challenge infographic, adorned in refreshing shades of green, white, and blue, provides an intuitive representation of these dual trajectories. Whether you're a startup striving for market traction or an established entity mapping out expansion strategies, this template crystallizes your journey. Business analysts, strategy consultants, and team leads will find this tool invaluable for driving insights and fostering discussions. Enhanced for compatibility with PowerPoint, Keynote, and Google Slides, this infographic is your visual ally in narrating business tales.


26 slides
Navigating Freelance and Flexible Work Presentation
Take control of your career with this insightful presentation on navigating freelance and flexible work. Covering key topics like client management, productivity strategies, income stability, and remote work tools, this template helps you present a clear roadmap to success. Fully customizable and compatible with PowerPoint, Keynote, and Google Slides for a seamless experience.


3 slides
Project Completion Checklist Presentation
Keep projects on track with the Project Completion Checklist template. This structured layout helps you monitor tasks, update statuses, and document progress seamlessly. Featuring status indicators, date tracking, and notes sections, this template enhances productivity and organization. Fully customizable and compatible with PowerPoint, Keynote, and Google Slides for effortless use.


6 slides
World Map Biomes Infographics
The "World Map Biomes" infographic template is a visually stunning and educational tool, expertly designed for PowerPoint, Keynote, and Google Slides. This template is a treasure trove for educators, environmentalists, and geographers aiming to provide a captivating geographical overview of the planet's diverse biomes. This template beautifully illustrates the Earth's varied biomes, from lush rainforests and arid deserts to tundra and coral reefs. Each biome is vividly represented, complete with key characteristics, flora and fauna, and climate information. This makes it a powerful resource for educational programs, environmental awareness campaigns, and geographical studies. The design is as informative as it is visually appealing, with a color scheme that mirrors the richness and diversity of the Earth's ecosystems. This not only makes the presentation a feast for the eyes but also enhances the educational impact, engaging audiences of all ages in the wonders of our world's biomes. Whether used in a classroom, a seminar, or an environmental exhibit, this template ensures that the "World Map Biomes" are presented in an enthralling, informative, and visually spectacular manner.


4 slides
Healthcare Access and Preventive Care Presentation
Bring your health strategy to life with this engaging heart-themed infographic slide. Perfect for illustrating patient access points, wellness checkpoints, or preventive initiatives, each segment is cleanly organized with icons and text. Ideal for medical presentations, this template works seamlessly in PowerPoint, Keynote, and Google Slides for total flexibility.

22 slides
Eclipse Graphic Design Project Plan Presentation
Develop a winning marketing strategy with this dynamic template. Dive into current trends, consumer behavior, and innovative techniques. Perfect for social media, influencer marketing, and data-driven campaigns. Fully compatible with PowerPoint, Keynote, and Google Slides.