


Features
- 4 Unique slides
- Fully editable and easy to edit in Microsoft Powerpoint, Keynote and Google Slides
- 16:9 widescreen layout
- Clean and professional designs
- Export to JPG, PDF or send by email


Do you have any questions?
Recommend


20 slides
Crescendo Creative Design Report Presentation
Transform your creative design report into a captivating presentation with a dynamic and professional template. This versatile format is tailored for designers, agencies, and creatives who want to showcase their design process, strategic approach, and project outcomes effectively. From design briefs and target audience insights to mood boards and prototypes, every slide is crafted to enhance clarity and visual appeal. Highlight unique elements, design systems, and implementation strategies with organized layouts that leave a lasting impression. Use the project timeline and feedback sections to narrate your journey and collaboration efforts seamlessly. Compatible with PowerPoint, Google Slides, and Keynote, this fully editable template adapts to your brand's needs. Engage stakeholders and clients with a polished, modern design that reflects your creative excellence.


24 slides
Gamma UX Design Presentation
Present your user experience design process with a sleek and modern template tailored for UX professionals. This template offers a cohesive flow of slides designed to illustrate your design journey, from user research to prototyping and final implementation. Highlight key aspects of your project with slides dedicated to user personas, wireframes, usability testing, and accessibility considerations. Showcase your team’s expertise and present project outcomes effectively with a clean and engaging layout. Visual elements and icons ensure your content is both informative and aesthetically pleasing. Compatible with PowerPoint, Google Slides, and Keynote, this fully customizable template allows you to personalize fonts, colors, and images to match your project’s branding. Impress stakeholders with a well-structured presentation that communicates your UX vision and expertise.


4 slides
Employee Training Needs Skills Gap
Train to close the gap. This Employee Training Needs Skills Gap slide makes it easy to visualize where employees are now, where they need to be, and the learning journey in between. TFully customizable for PowerPoint, Keynote, and Google Slides.


23 slides
Ignifis Investor Pitch Presentation
Capture investor interest with this dynamic and professional pitch deck presentation template. It includes essential slides such as company overview, problem statement, revenue model, competitive landscape, financials, and growth projections. Designed for clarity and impact, it's fully customizable and perfect for securing funding. Compatible with PowerPoint, Keynote, and Google Slides.


26 slides
Entrepreneurship 101 Professional Presentation
This template offers a modern, professional framework for presentations about Entrepreneurship 101. It combines a clean, contemporary design with a palette of cool blues and muted reds, setting a tone that's both creative and serious—just right for the innovative spirit of entrepreneurship. Within its slides, you'll find all the tools needed to outline the essentials of starting a new business, from identifying opportunities to understanding market trends. Perfect for aspiring entrepreneurs, business school classes, or startup workshops, the template includes varied slide types: team introductions, big ideas, comparative analyses, and growth charts. The slides also feature infographics for brainstorming sessions, process flows for business operations, and timeline representations for strategic planning. Designed for adaptability, the template works seamlessly with PowerPoint, Keynote, and Google Slides, ensuring your entrepreneurial vision can be shared with clarity and impact.

21 slides
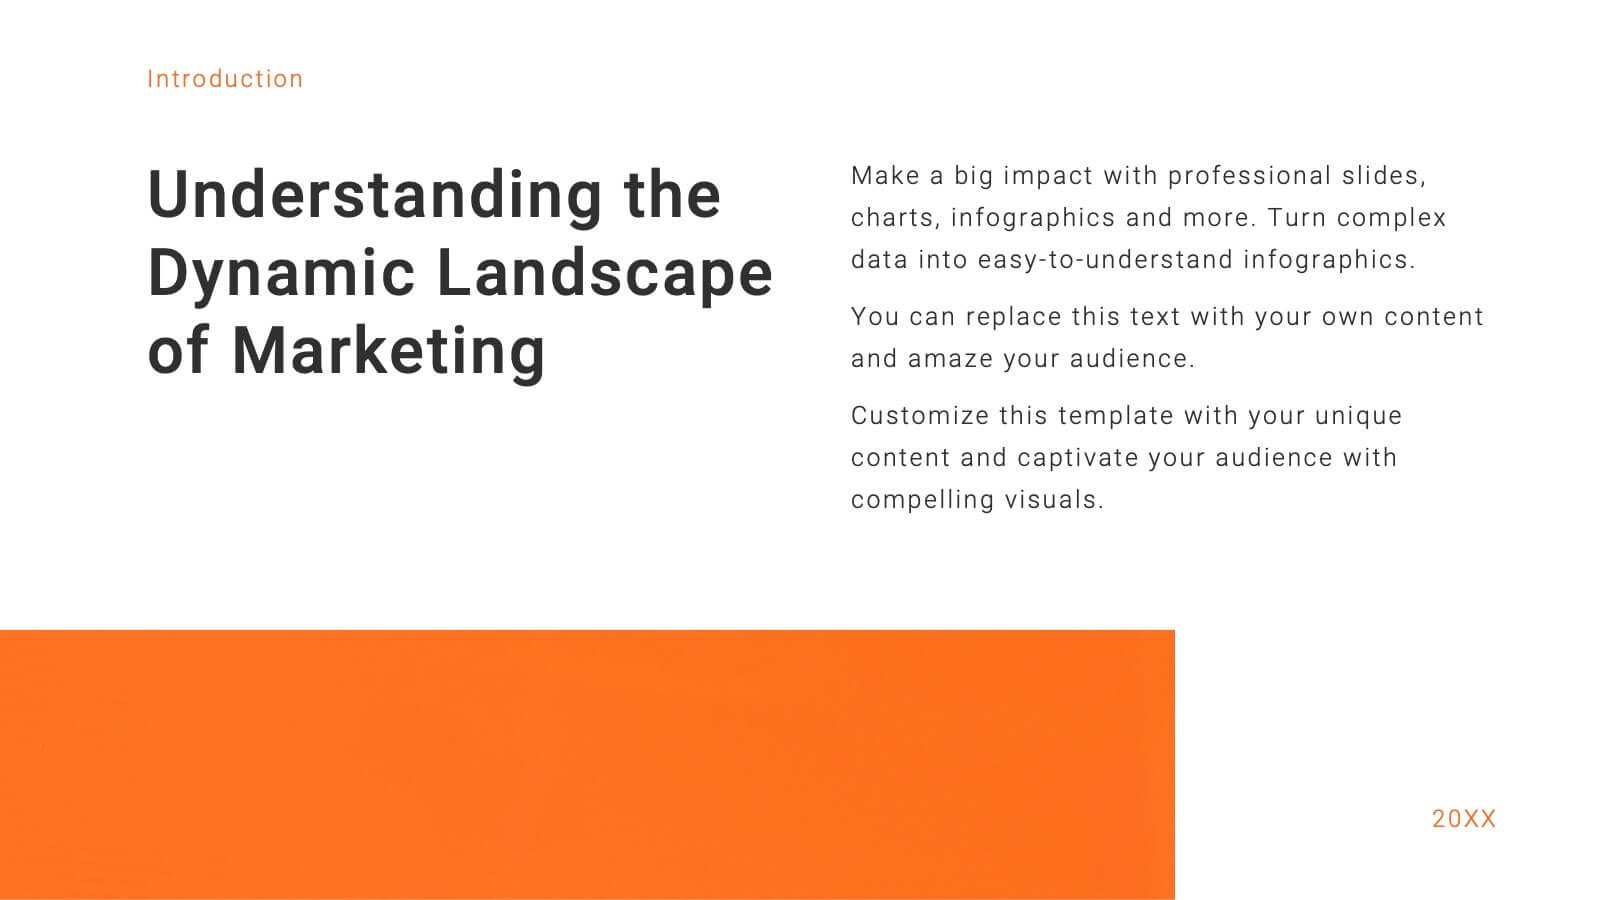
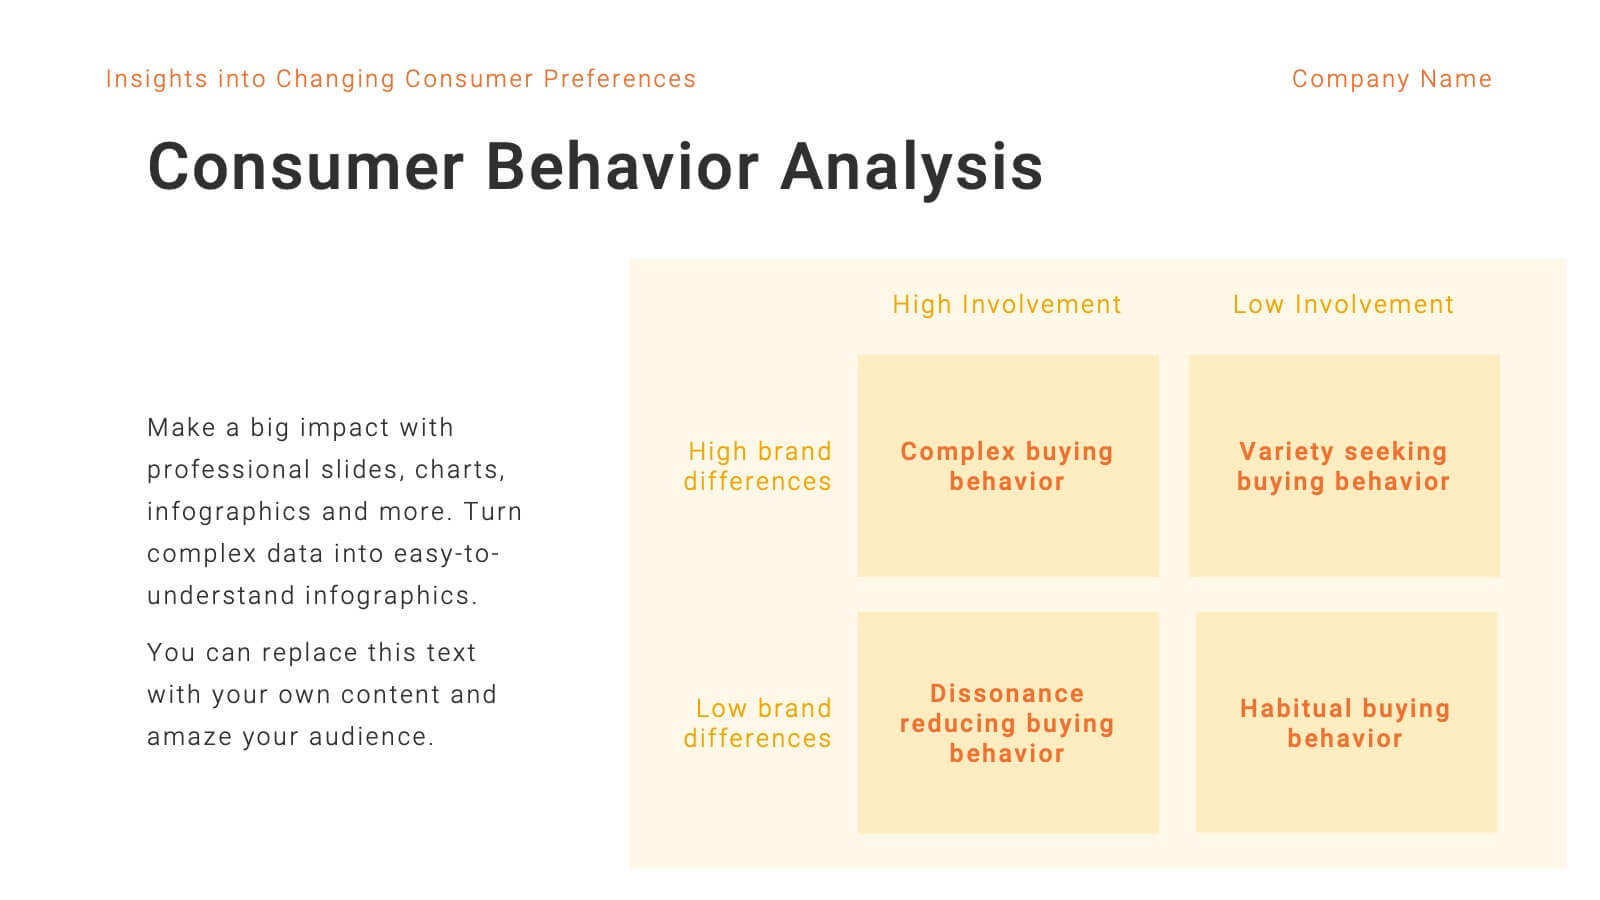
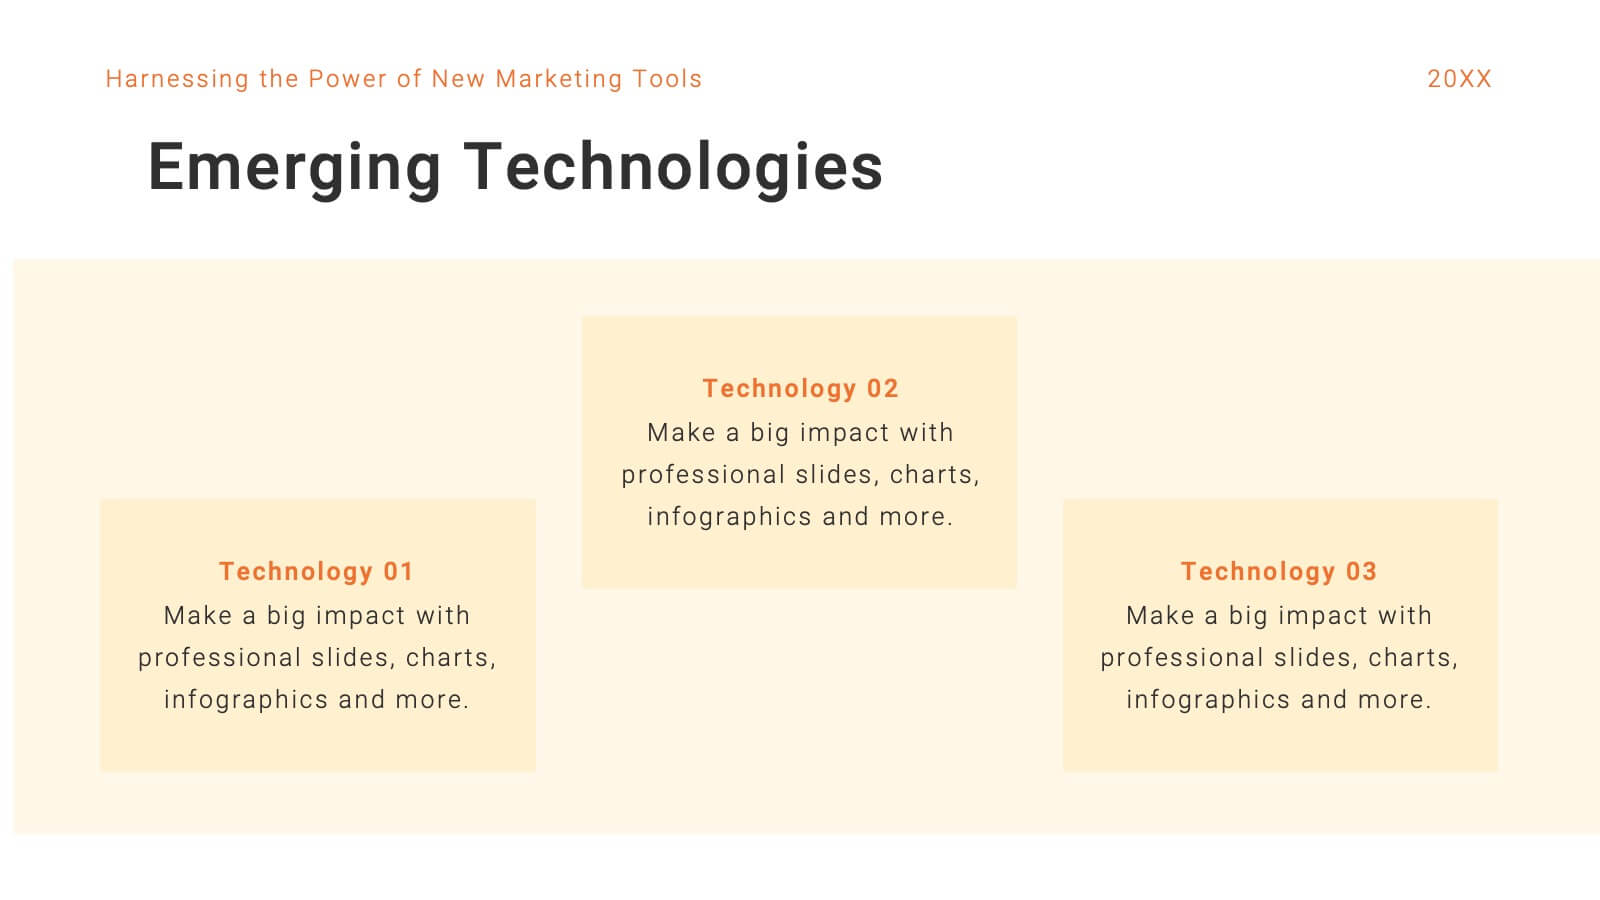
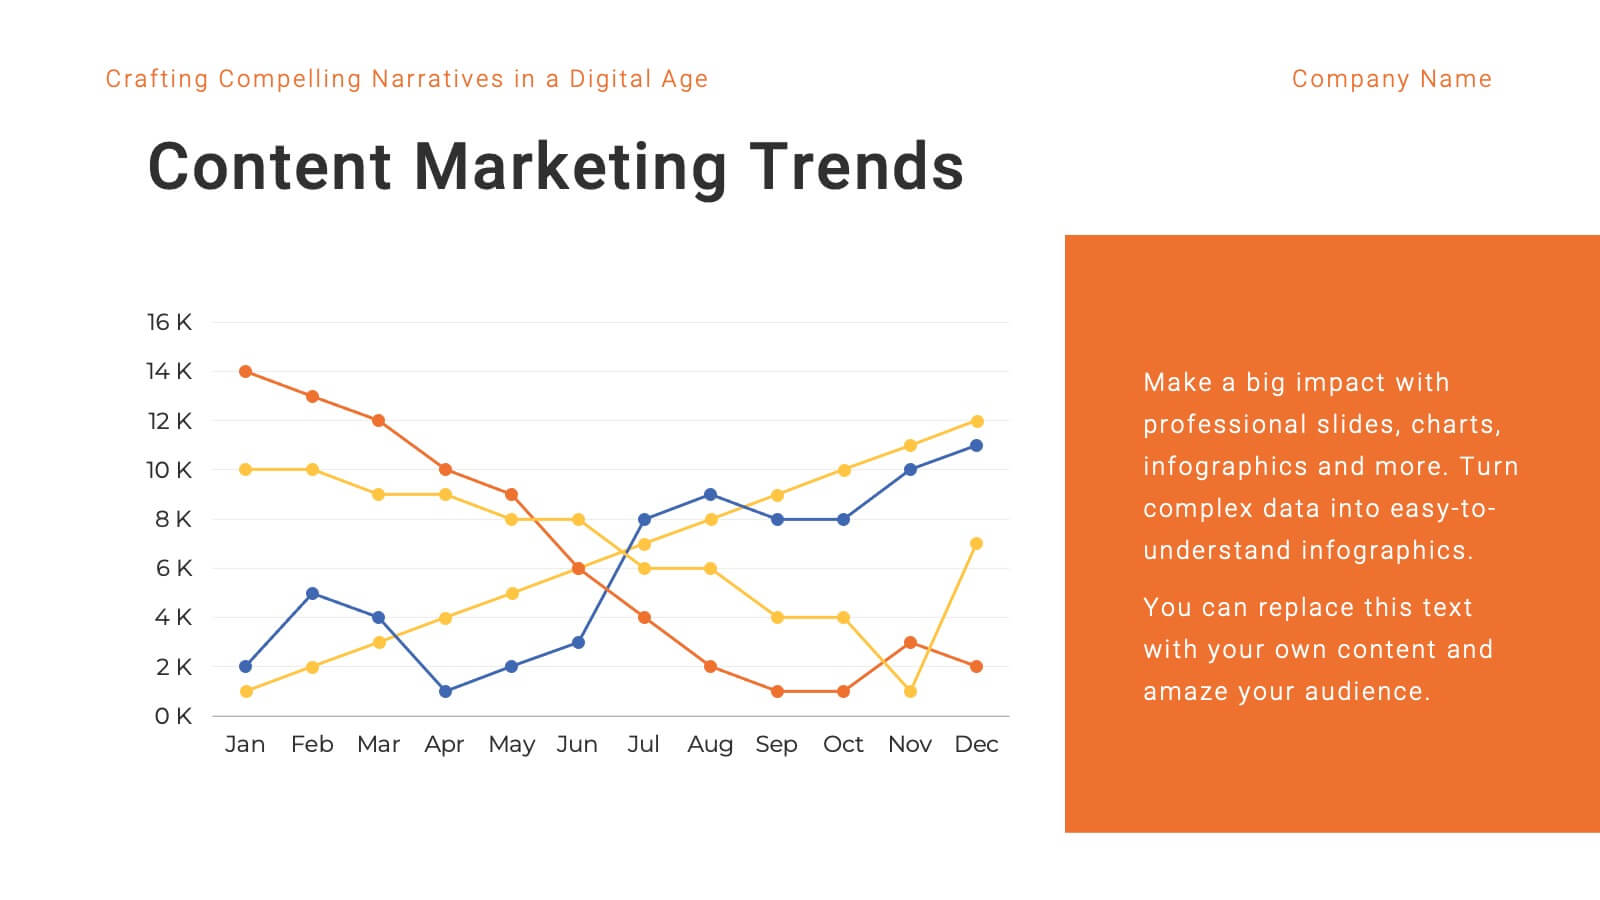
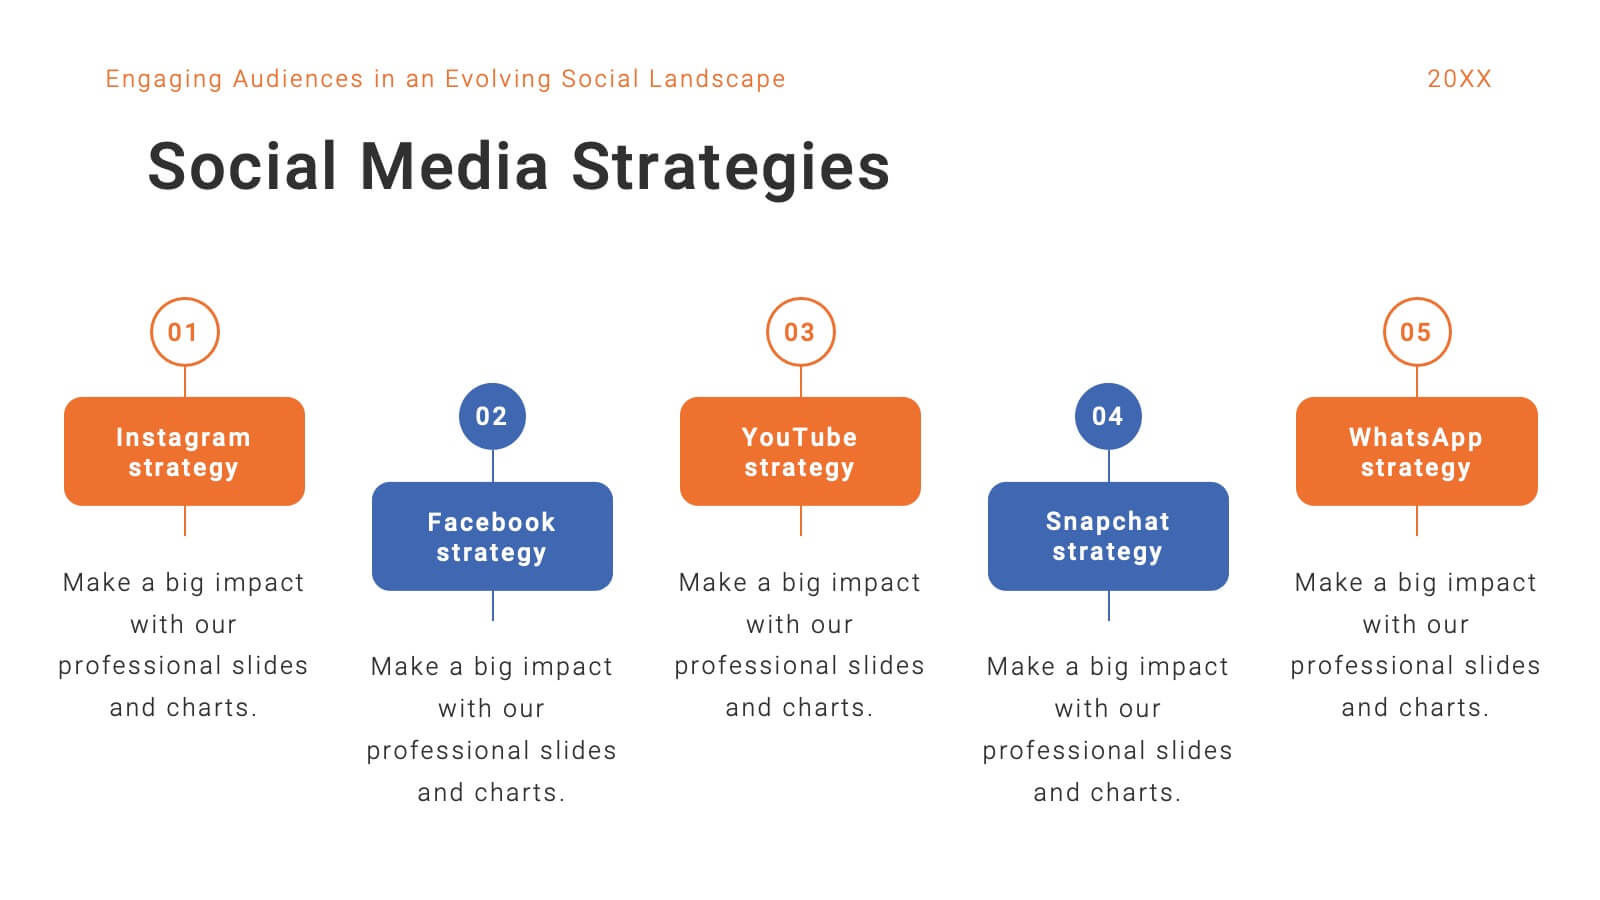
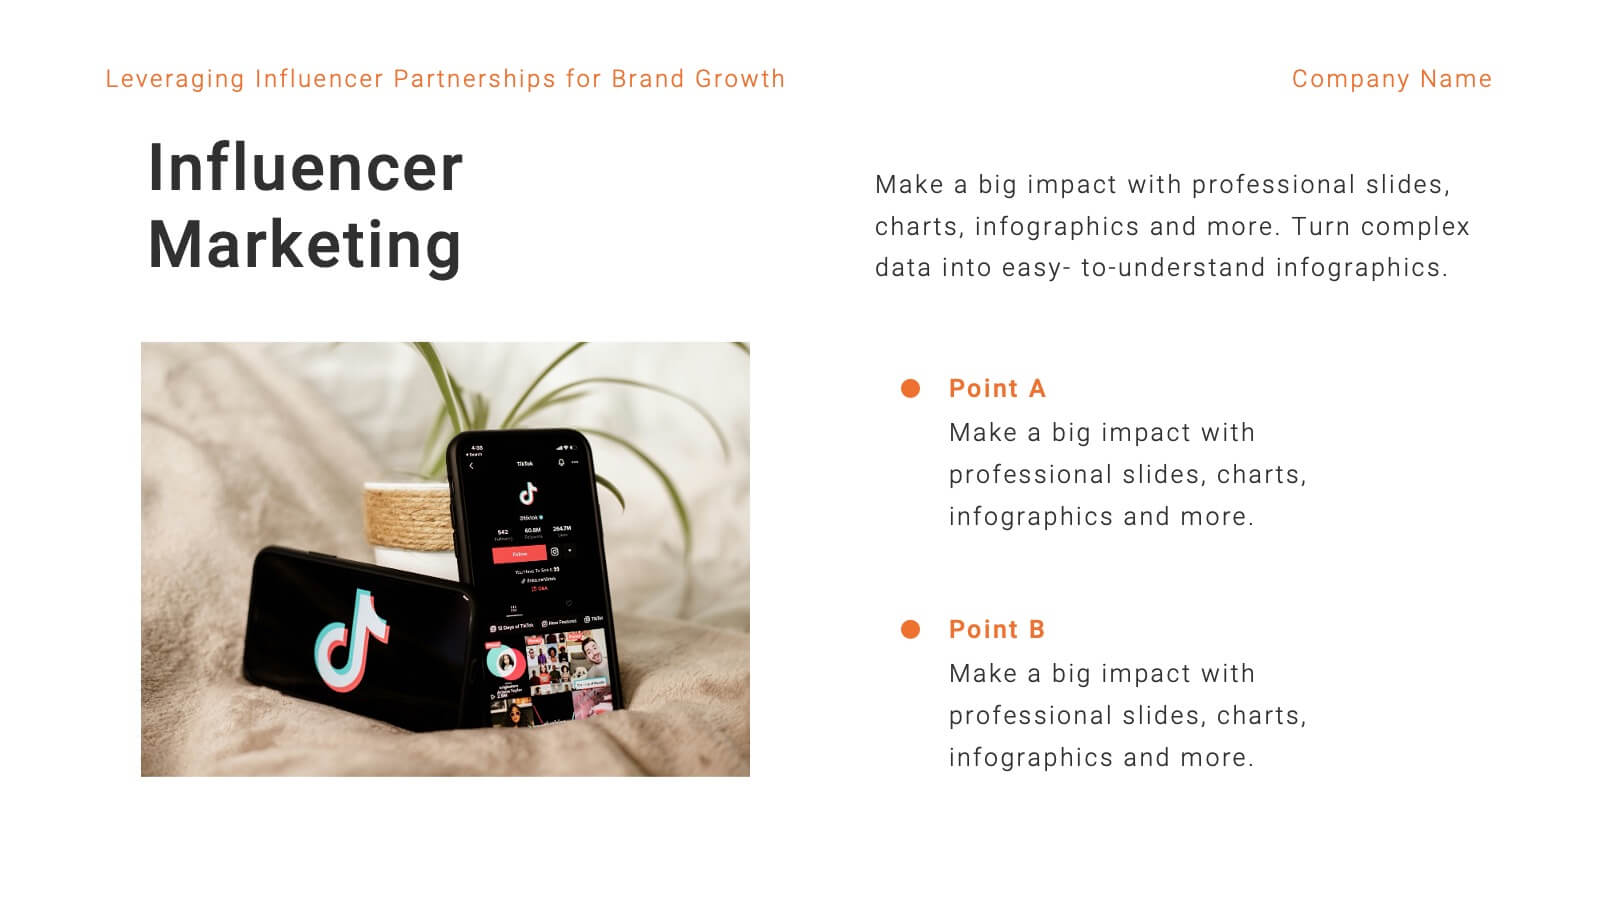
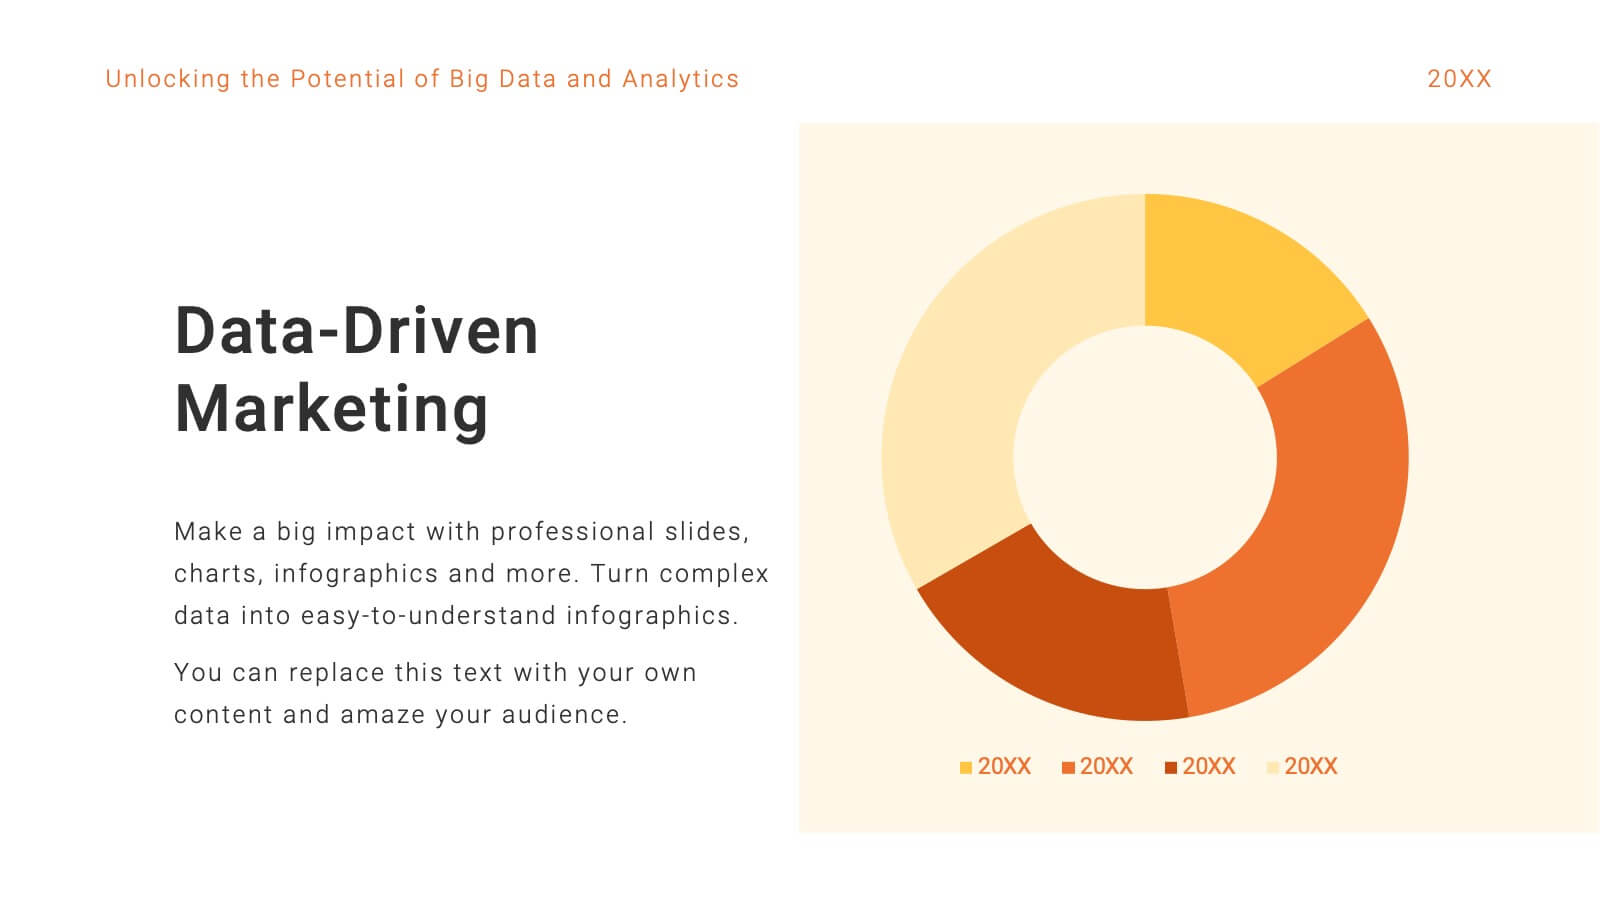
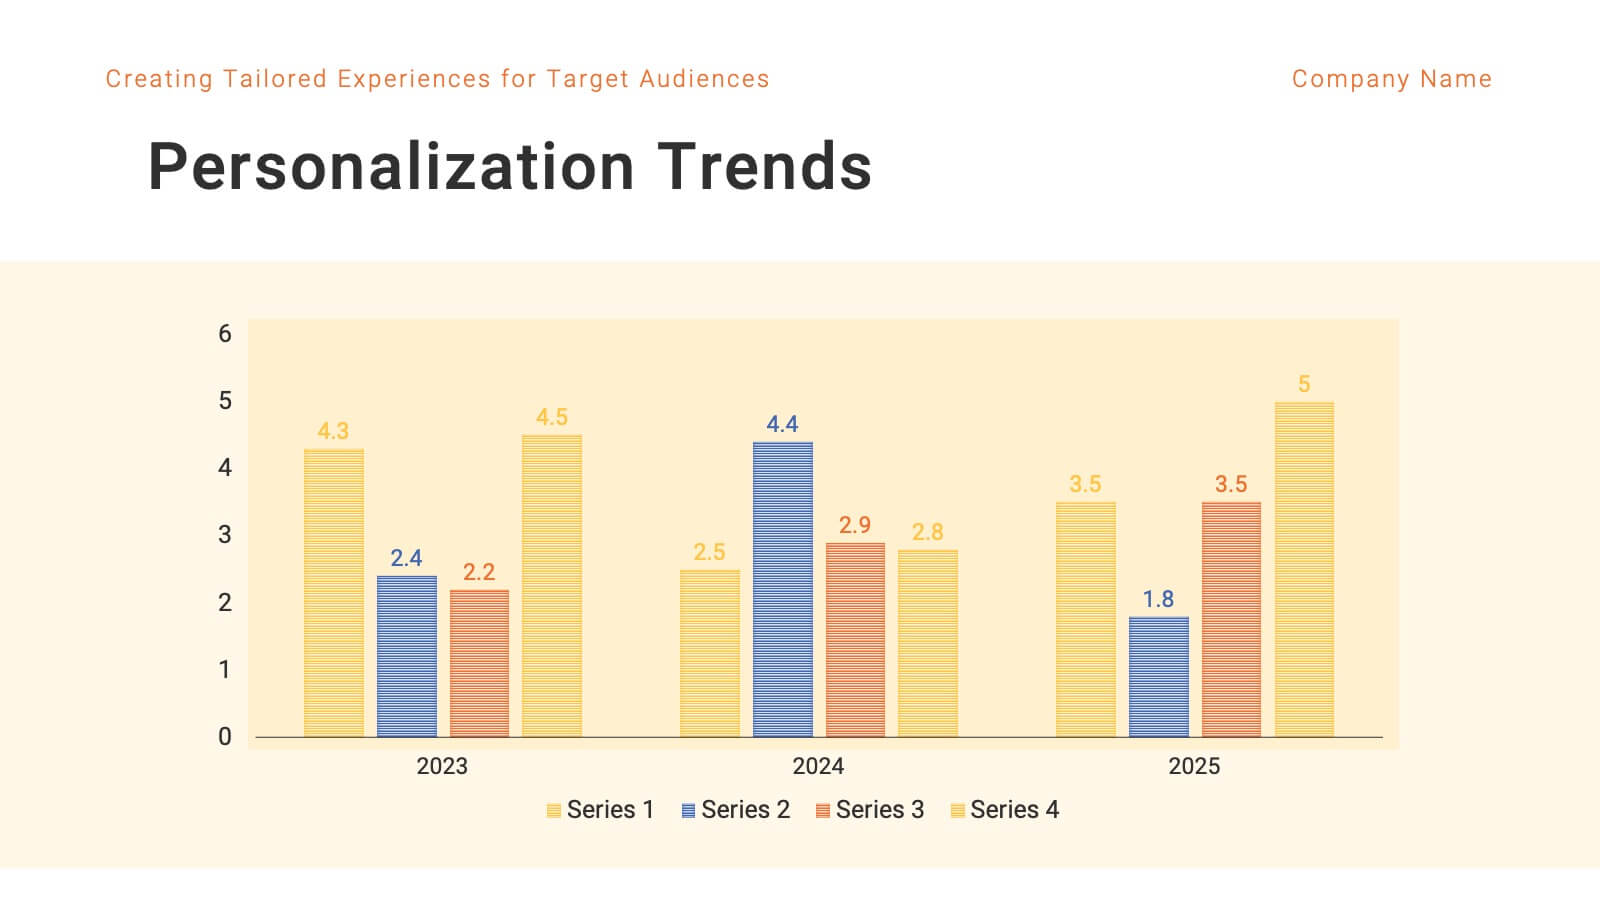
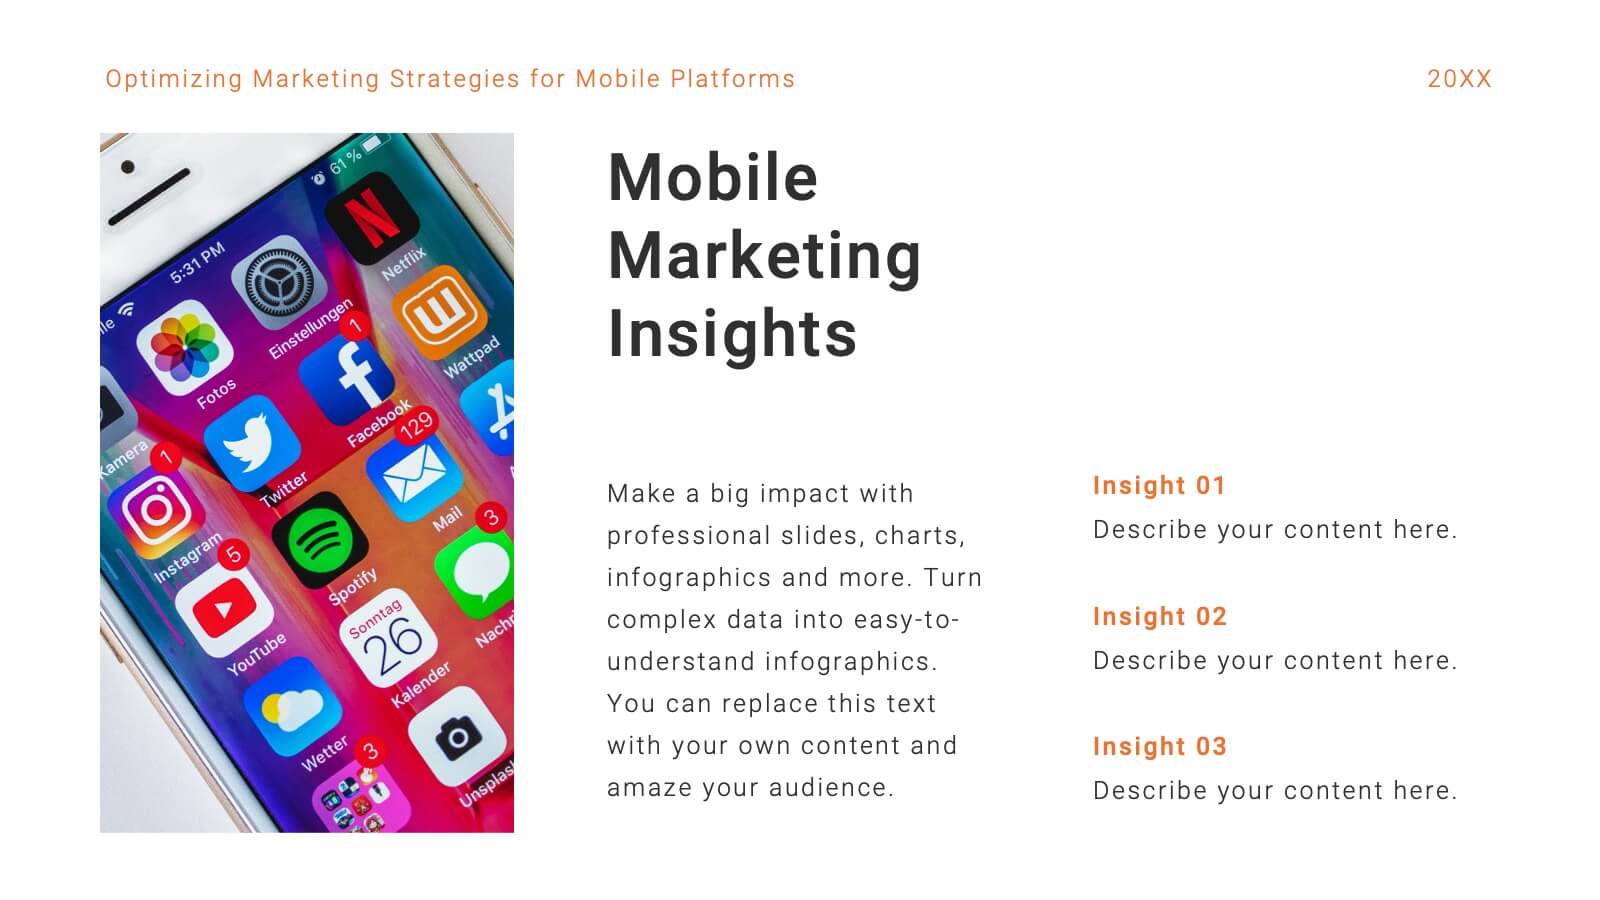
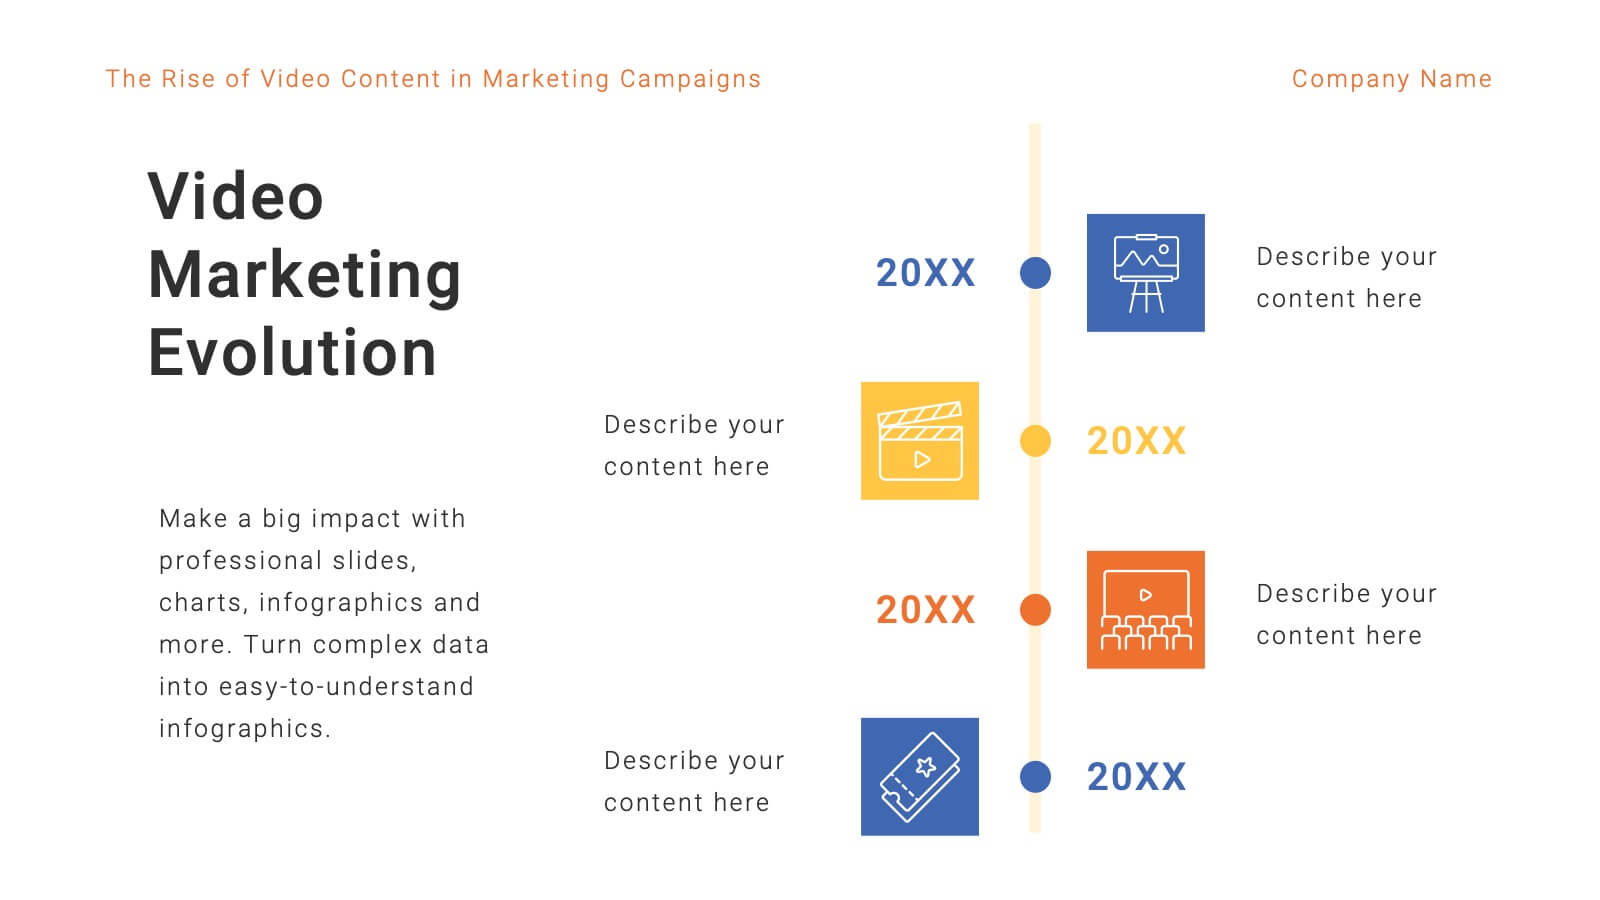
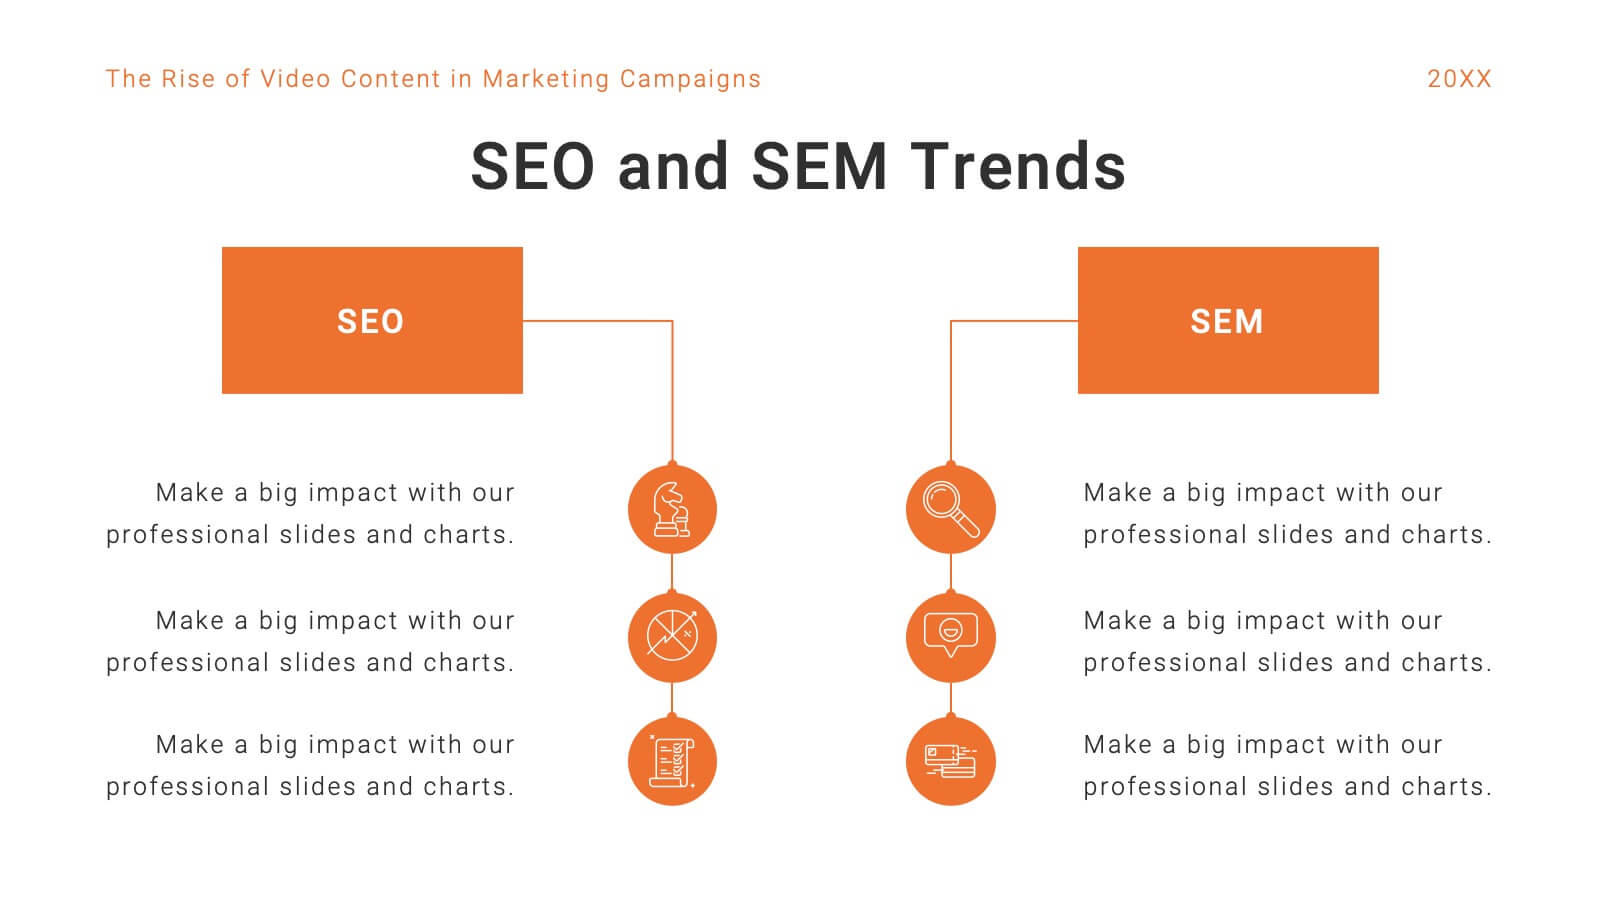
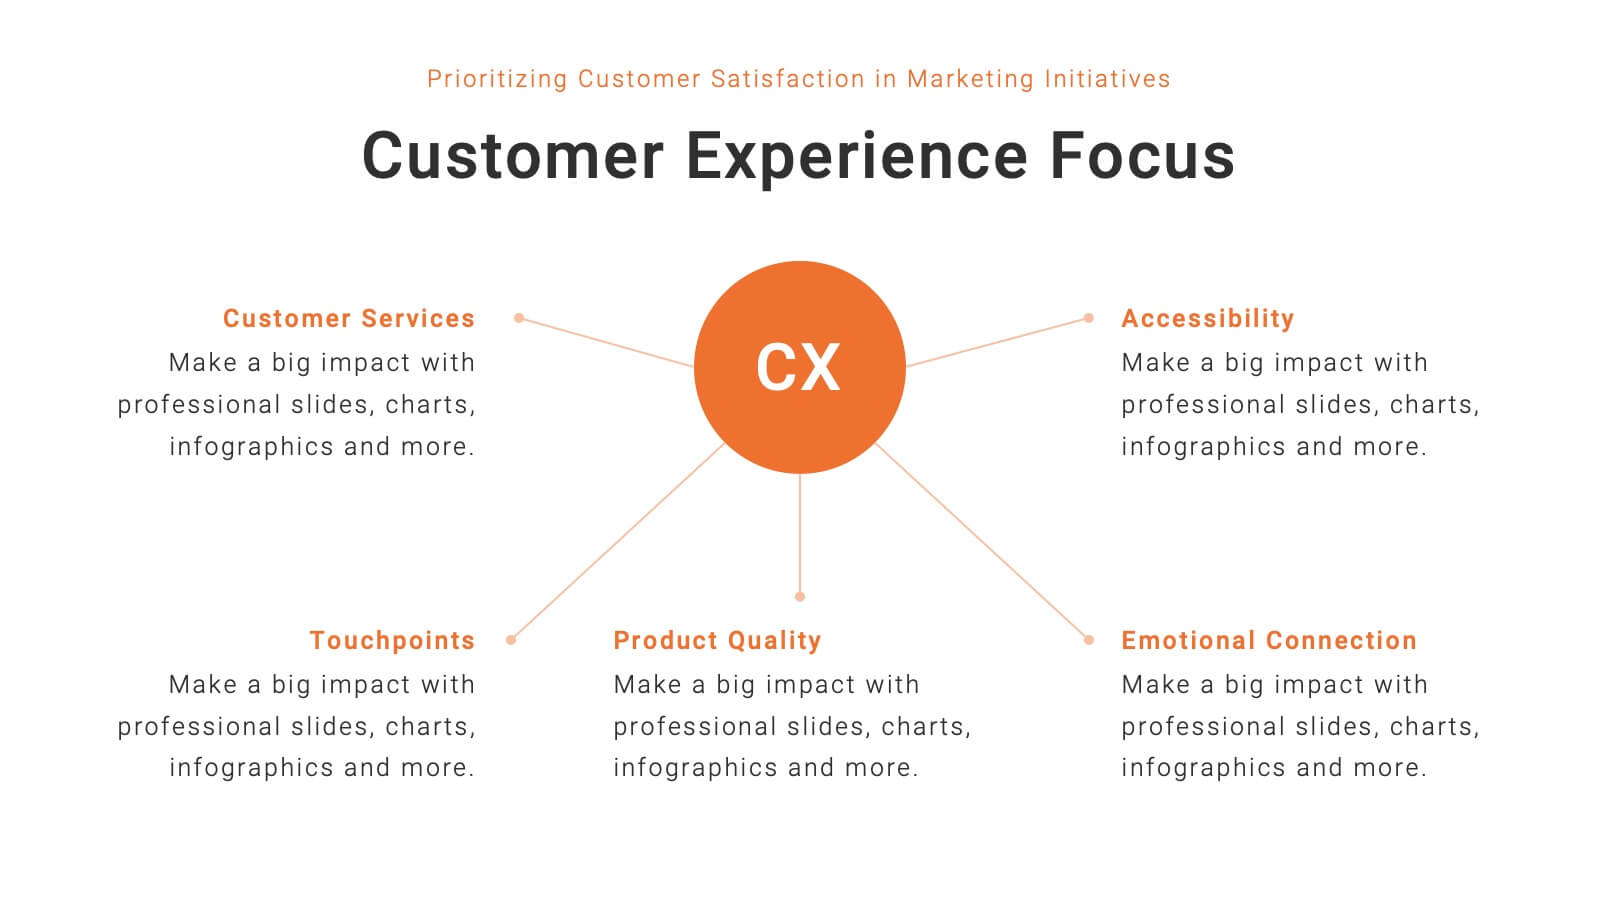
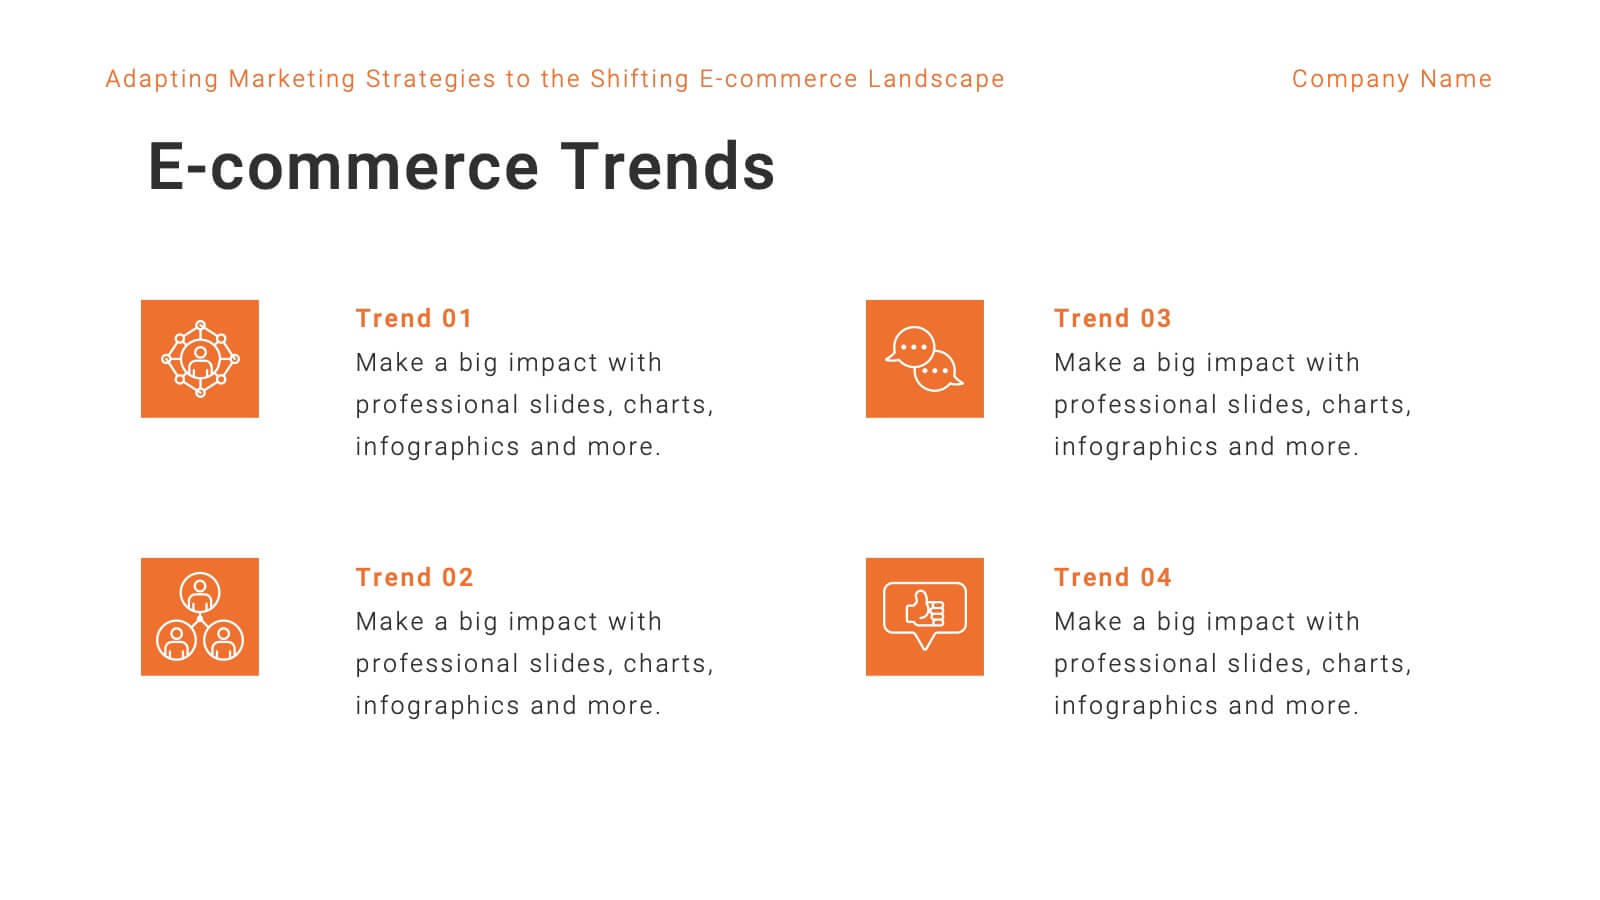
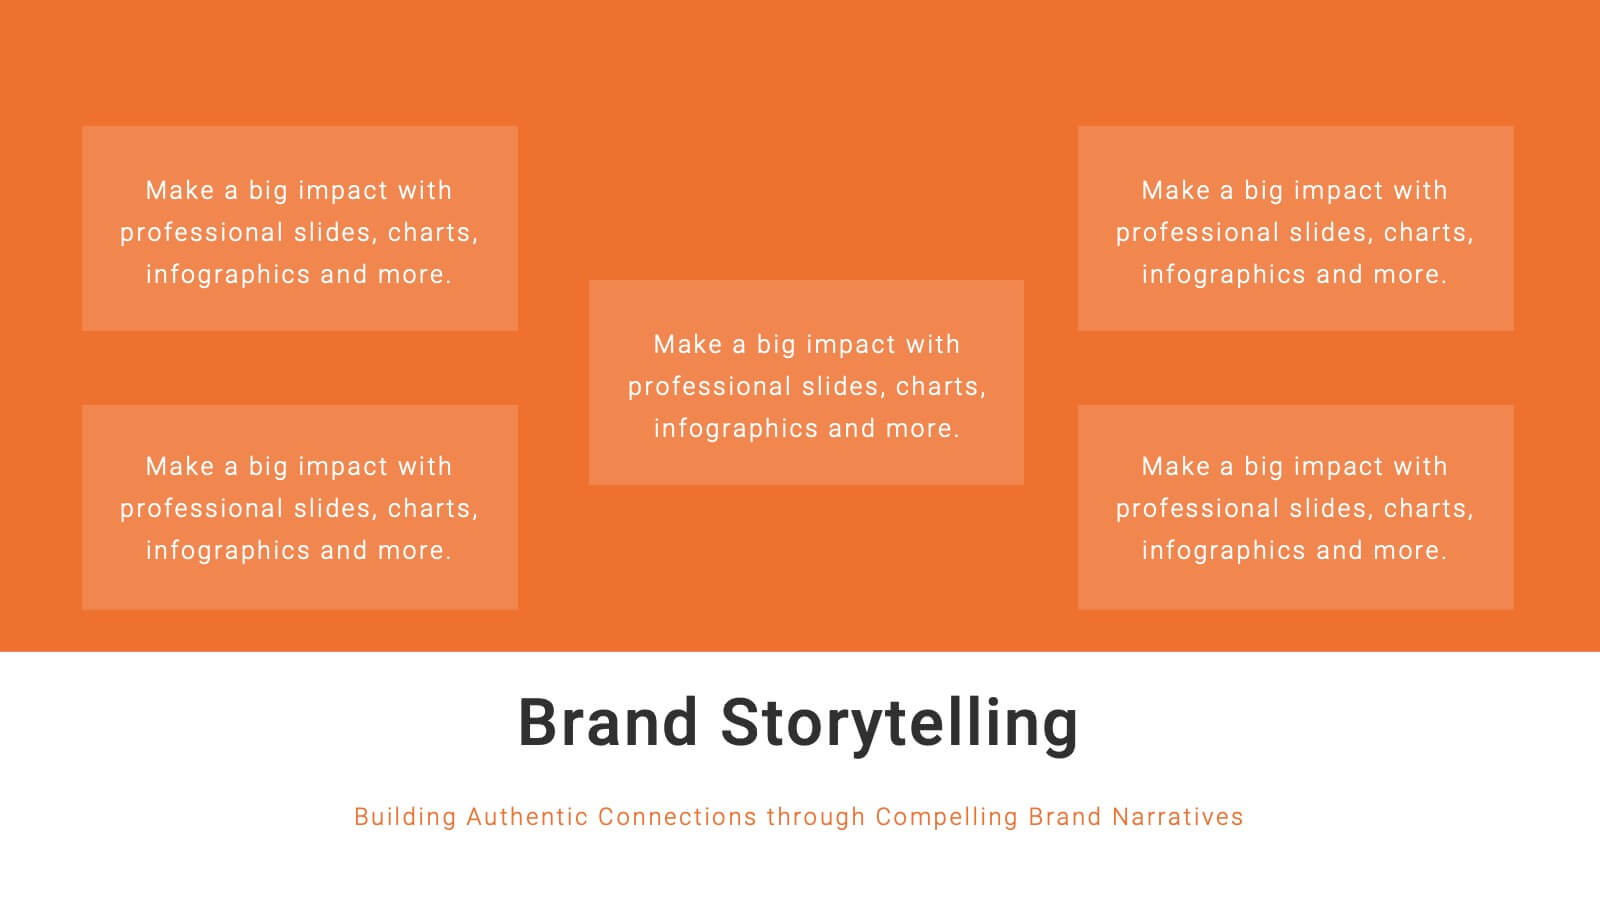
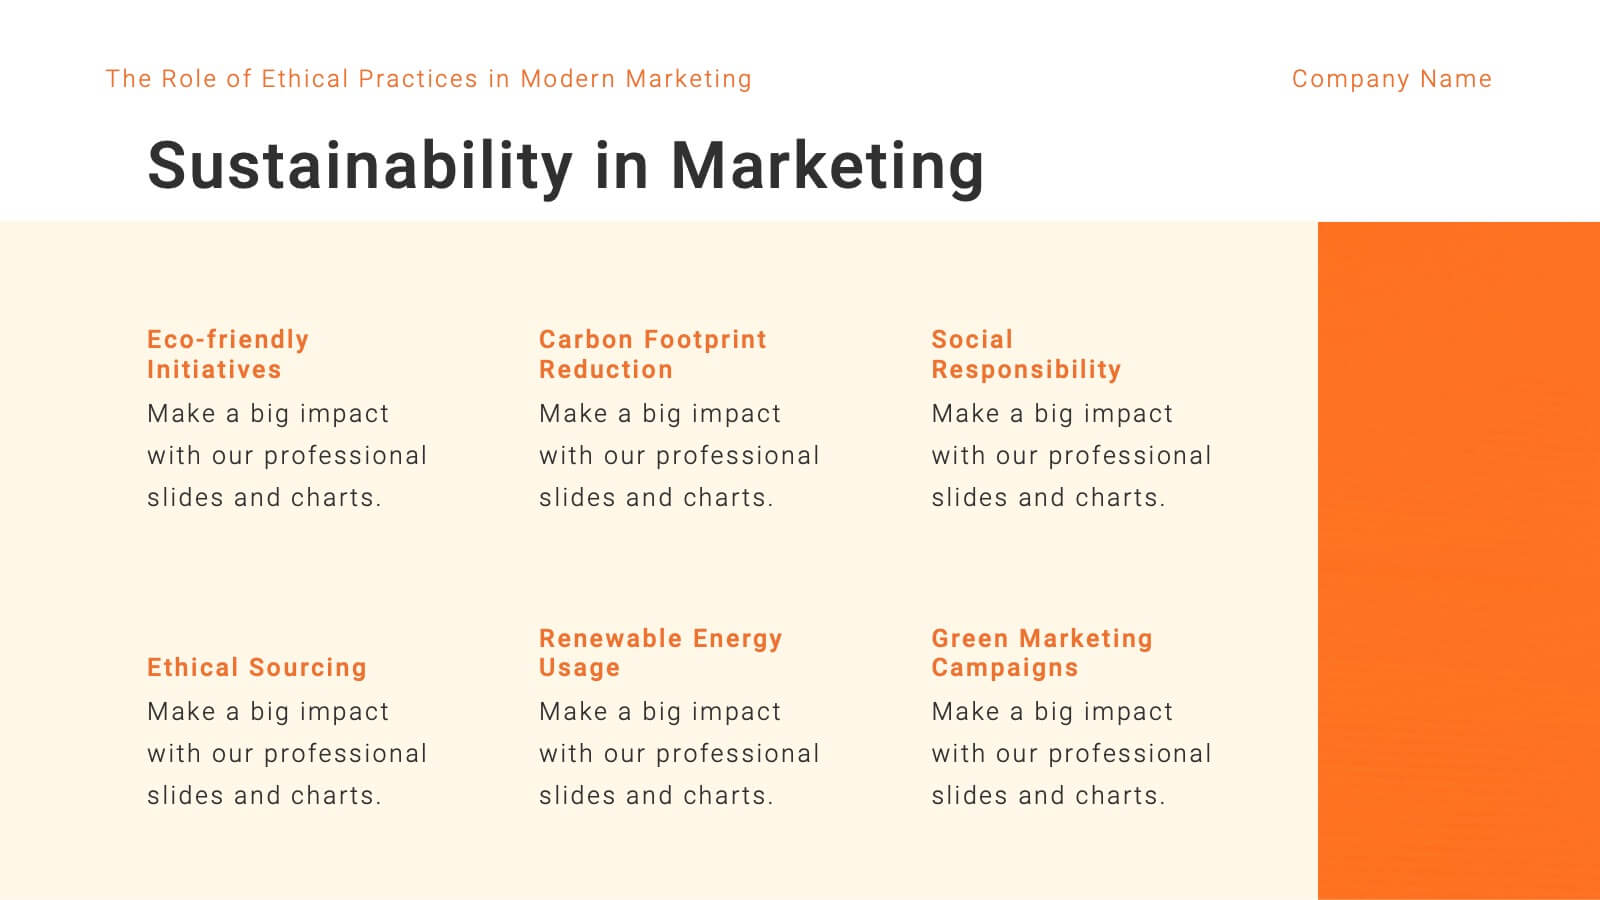
Mercury Marketing Research Report Presentation
Elevate your marketing strategy with this insightful and data-driven presentation template! Perfect for analyzing trends, consumer behavior, and emerging technologies, this template provides a thorough overview of today’s marketing landscape. From social media strategies to e-commerce trends, it covers all key areas. Fully customizable and compatible with PowerPoint, Keynote, and Google Slides for easy use.


7 slides
Mission Statement Infographic
Present your organization's core values and goals with clarity using this collection of professionally designed slide templates. Each one is crafted to communicate key elements of your strategic vision effectively, combining aesthetic appeal with functional design to ensure your message resonates. Featuring a clean and professional layout, these slides emphasize the importance of your foundational principles. The balanced use of images and text is ideal for enhancing corporate presentations, stakeholder meetings, or team workshops. With various designs available, you can select the layout that best aligns with your branding and organizational ethos. These templates are fully customizable, allowing for adjustments in color, font, and imagery to perfectly articulate your core messages. They are an excellent tool for motivating your team, impressing stakeholders, and conveying the driving purpose behind your initiatives.


6 slides
Touchpoint-Based Customer Journey Map Presentation
Visualize each stage of the user experience with this Touchpoint-Based Customer Journey Map presentation. Perfect for tracking interactions across the customer lifecycle—from awareness to loyalty—this layout helps pinpoint strengths and gaps at every phase. Clean columns and color-coded touchpoints ensure quick analysis. Fully compatible with PowerPoint, Canva, and Google Slides.


6 slides
Root Cause Breakdown with Impact Lines Presentation
Visualize the path from causes to consequences with the Root Cause Breakdown with Impact Lines Presentation. Designed with a clear horizontal arrow flow and dual-level layout, this slide helps you dissect key issues and their cascading effects. Ideal for risk analysis, incident reviews, and operational strategy meetings. Fully customizable in PowerPoint, Keynote, and Google Slides.


26 slides
Orion Creative Agency Pitch Deck Presentation
The Orion Creative Agency Portfolio is a visually stunning and comprehensive presentation template designed to showcase your agency's unique strengths and achievements. The first slide sets the tone with a clean and modern design, perfect for capturing your audience's attention. Following the introduction, the template takes you through an impressive journey of client success stories, highlighting the impact and value your agency brings to the table. The industry trend analysis and competitive landscape sections offer a deep dive into the market, positioning your agency as a leader in the field. You'll also find dedicated slides for your approach, creative process, and campaign execution, ensuring every detail of your agency's methodology is presented clearly. Testimonials and partnership opportunities add credibility, while the future outlook and social impact initiatives highlight your agency's forward-thinking and commitment to positive change. This template is fully compatible with PowerPoint, Keynote, and Google Slides, making it an ideal choice for any agency presentation.


6 slides
IT Architecture Diagram Presentation
Turn complex system structures into clear visual stories with this professional presentation. Perfect for mapping processes, software layers, or organizational workflows, it helps communicate how technology components connect and operate. Fully editable and compatible with PowerPoint, Keynote, and Google Slides for seamless customization and engaging technical presentations.


8 slides
Customer Targeting and Persona Creation Presentation
Hook your audience with a clean, modern layout that zooms in on what really matters—your ideal customer. This customer persona template helps visualize traits, behaviors, and key targets for effective marketing. Perfect for campaign planning, branding, or audience research. Fully compatible with PowerPoint, Keynote, and Google Slides.


5 slides
Iceberg Model Infographics
Introducing our Iceberg Model Infographic, this is a visual representation of the Iceberg Model which is a metaphor for understanding a problem or issue. It is based on the idea that just like an iceberg, only a small portion of the problem or issue is visible on the surface, while the majority of it lies beneath. In this vertical infographic use the top visible part of the iceberg to represent the things that are easily observed, and the larger hidden part of the iceberg can be the underlying causes or factors that are not easily visible. This is designed to help people understand the complexity of a problem and encourage them to look beyond the surface level.


6 slides
Demographic Trends and Audience Breakdown Presentation
Visualize key audience segments and population trends with this modern demographic breakdown slide. Featuring a clean circular chart layout, it's perfect for showcasing age, gender, location, or behavioral data. Ideal for marketing, branding, or user research reports, it turns complex demographics into clear, impactful insights for strategic planning and targeting.


4 slides
Employee Performance Feedback Presentation
Enhance your performance review process with the Employee Performance Feedback infographic. This structured and visually engaging template presents key evaluation criteria, employee achievements, and areas for improvement in a clear format. Fully customizable and compatible with PowerPoint, Keynote, and Google Slides.


7 slides
Side-by-Side Feature Comparison Presentation
Clearly showcase differences across multiple categories with this Side-by-Side Feature Comparison Presentation. Designed with a visual grid system and bold colors, it's perfect for highlighting product or service variations at a glance. Fully customizable in PowerPoint, Keynote, and Google Slides.


5 slides
Investment Strategy and Growth Planning Presentation
Visualize your growth strategy using this clean and modern infographic layout. Each pawn-shaped graphic highlights key steps in your investment plan, ideal for financial planning, business development, or progress tracking. Fully customizable in PowerPoint, Google Slides, and Keynote—perfect for presenting strategic priorities and actionable insights with visual impact.