


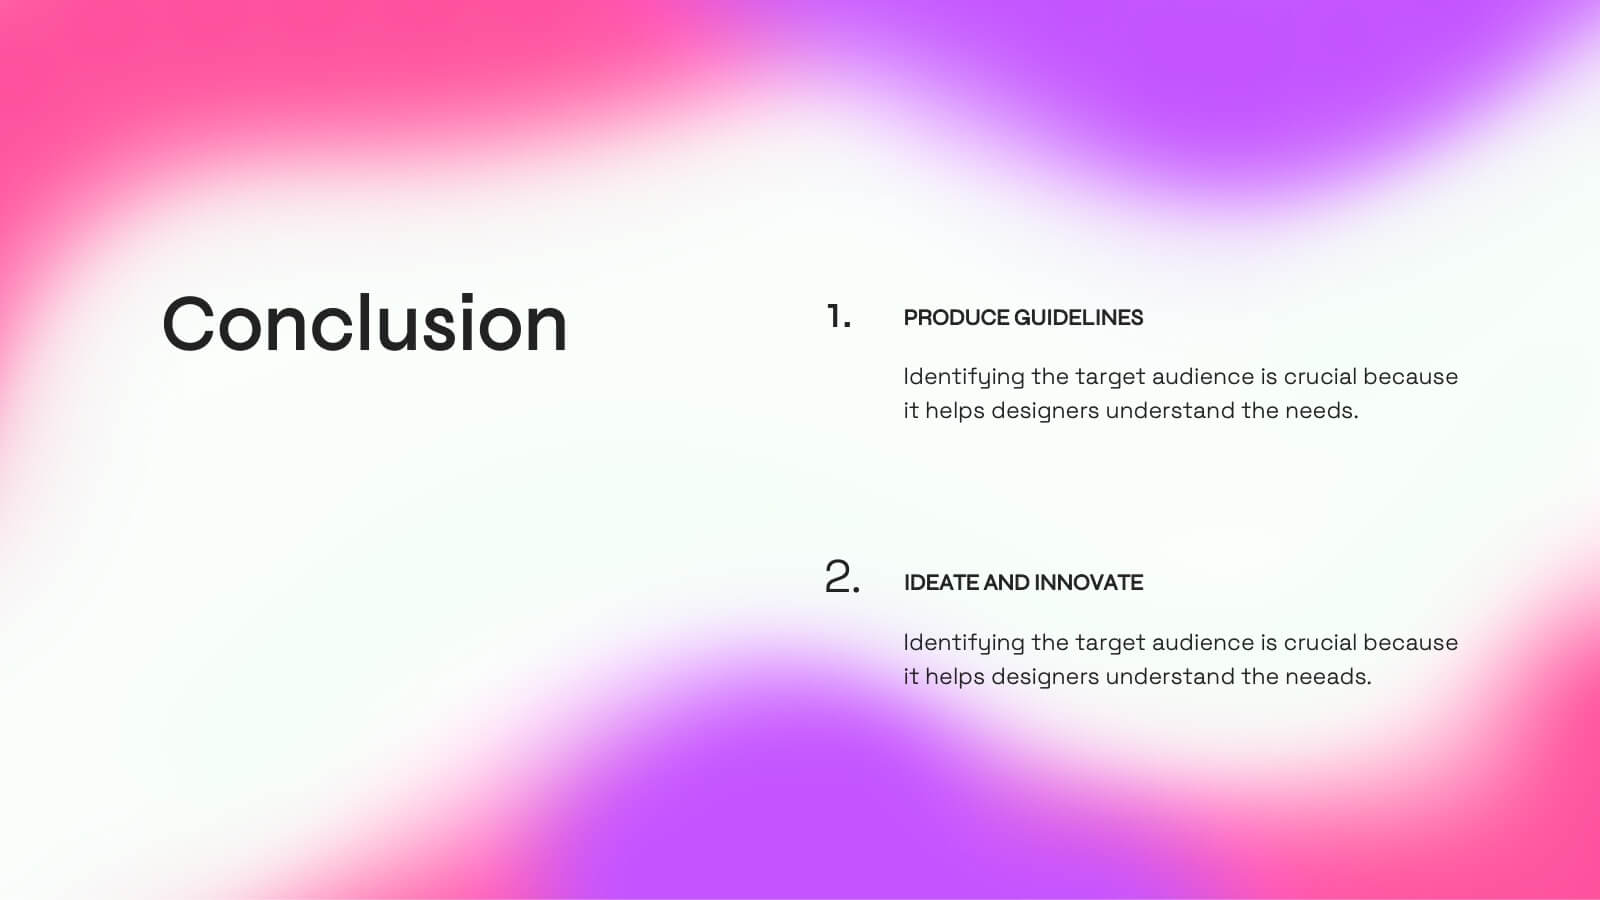
Features
- 6 Unique slides
- Fully editable and easy to edit in Microsoft Powerpoint, Keynote and Google Slides
- 16:9 widescreen layout
- Clean and professional designs
- Export to JPG, PDF or send by email


Do you have any questions?
Recommend


6 slides
Organizational Strategy via Mind Mapping
Clarify your corporate vision with the Organizational Strategy via Mind Mapping Presentation. This infographic-style slide uses a head silhouette and segmented arc to represent five strategic focus areas (A–E), making it perfect for showcasing alignment across departments, initiatives, or leadership goals. Fully customizable in PowerPoint, Keynote, and Google Slides for versatile strategic presentations.


4 slides
Strategic SWOT Matrix Overview Presentation
Present your strategic insights with clarity using the Strategic SWOT Matrix Overview Presentation. This modern slide layout features a sleek horizontal design that separates Strengths, Weaknesses, Opportunities, and Threats into visually distinct segments. Ideal for business planning, strategy reviews, or team discussions. Fully editable in PowerPoint, Canva, and Google Slides.


5 slides
Fitness Trainings Infographics
Fitness Training refers to structured physical activities or exercises designed to improve and maintain physical fitness, overall health, and athletic performance. Using these infographic templates, you can effectively educate your audience about different fitness training techniques, inspire them to adopt a healthy and active lifestyle, and provide them with practical tips and guidance for their fitness journey. These are designed to showcase various fitness training concepts, techniques, and tips. Whether you're a fitness instructor, personal trainer, or fitness enthusiast, this template is a valuable resource to educate and motivate your audience about fitness training.


6 slides
School Goals and Administration Presentation
Visualize key academic priorities with this notebook-style layout, perfect for school administrators and teachers. Featuring colorful pushpin markers and a two-page spread, this template is great for outlining goals, responsibilities, or class guidelines. Fully editable in PowerPoint, Keynote, and Google Slides for customized, classroom-ready presentations.


5 slides
Creative Watercolor Style Presentation
Splash your ideas onto the page with a layout that blends artistic watercolor accents and clean, modern structure. This presentation helps you showcase insights, steps, or concepts in a visually soothing format that feels both creative and professional. Ideal for storytelling or branding discussions. Fully compatible with PowerPoint, Keynote, and Google Slides.


26 slides
Venture Capital Presentation
Perfect for investors and startups, this Venture Capital presentation template is designed to effectively communicate the nuances of funding and investment strategies. Its professional layout, highlighted with bold colors and clear graphics, sets the stage for impactful discussions on the intricacies of venture capital. The slides are structured to guide you through every aspect of the investment journey, from introducing key players to dissecting financial forecasts and market analyses. Engaging visuals aid in illustrating company growth potential, funding stages, and investor expectations, while specialized slides enable a deep dive into competitive comparisons and future financial projections. This template, adaptable across PowerPoint, Keynote, and Google Slides, is an essential tool for anyone in the venture capital arena looking to present their ideas with confidence and precision.


6 slides
Milestones Technologies Infographics
Highlight significant milestones in technology with our Milestones Technologies infographic template. This template is fully compatible with popular presentation software like PowerPoint, Keynote, and Google Slides, allowing you to easily customize it to showcase pivotal moments and achievements in the world of technology. The Milestones Technologies infographic template offers a visually engaging platform to chronicle and celebrate key technological advancements, innovations, and breakthroughs throughout history. Whether you're a tech enthusiast, educator, or simply interested in technological progress, this template provides a user-friendly canvas to create informative presentations and educational materials. Deepen your appreciation for the impact of technology with this SEO-optimized Milestones Technologies infographic template, thoughtfully designed for clarity and ease of use. Customize it to highlight milestones across various fields, from computing and telecommunications to space exploration and biotechnology, making it a valuable resource for sharing the history of technology with your audience. Start crafting your personalized infographic today to explore the remarkable journey of technological progress.


21 slides
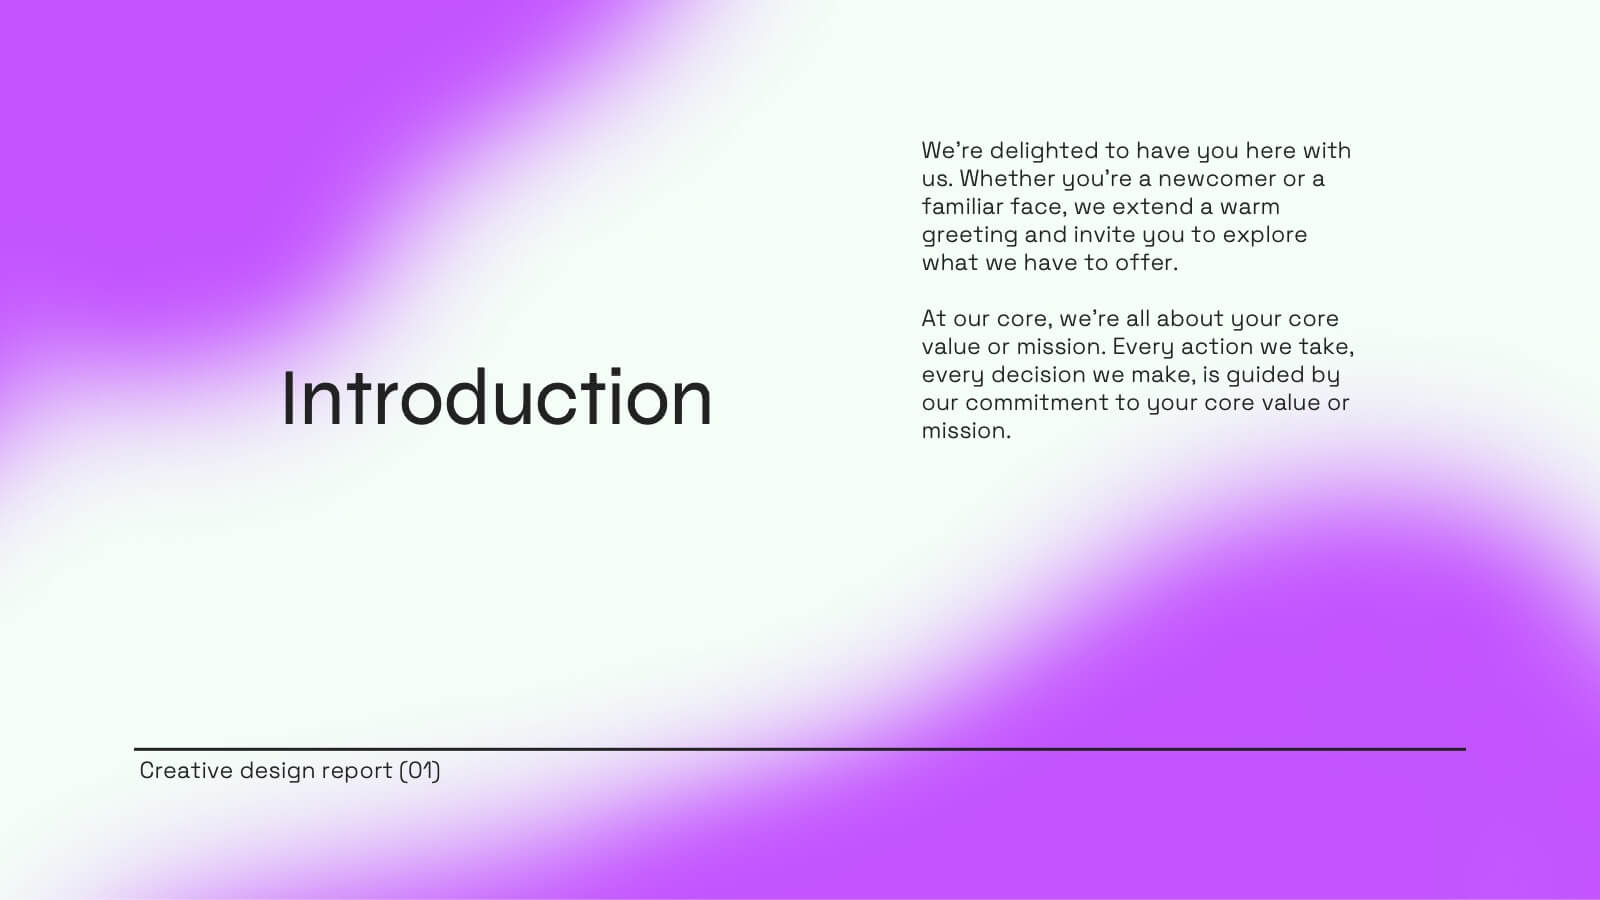
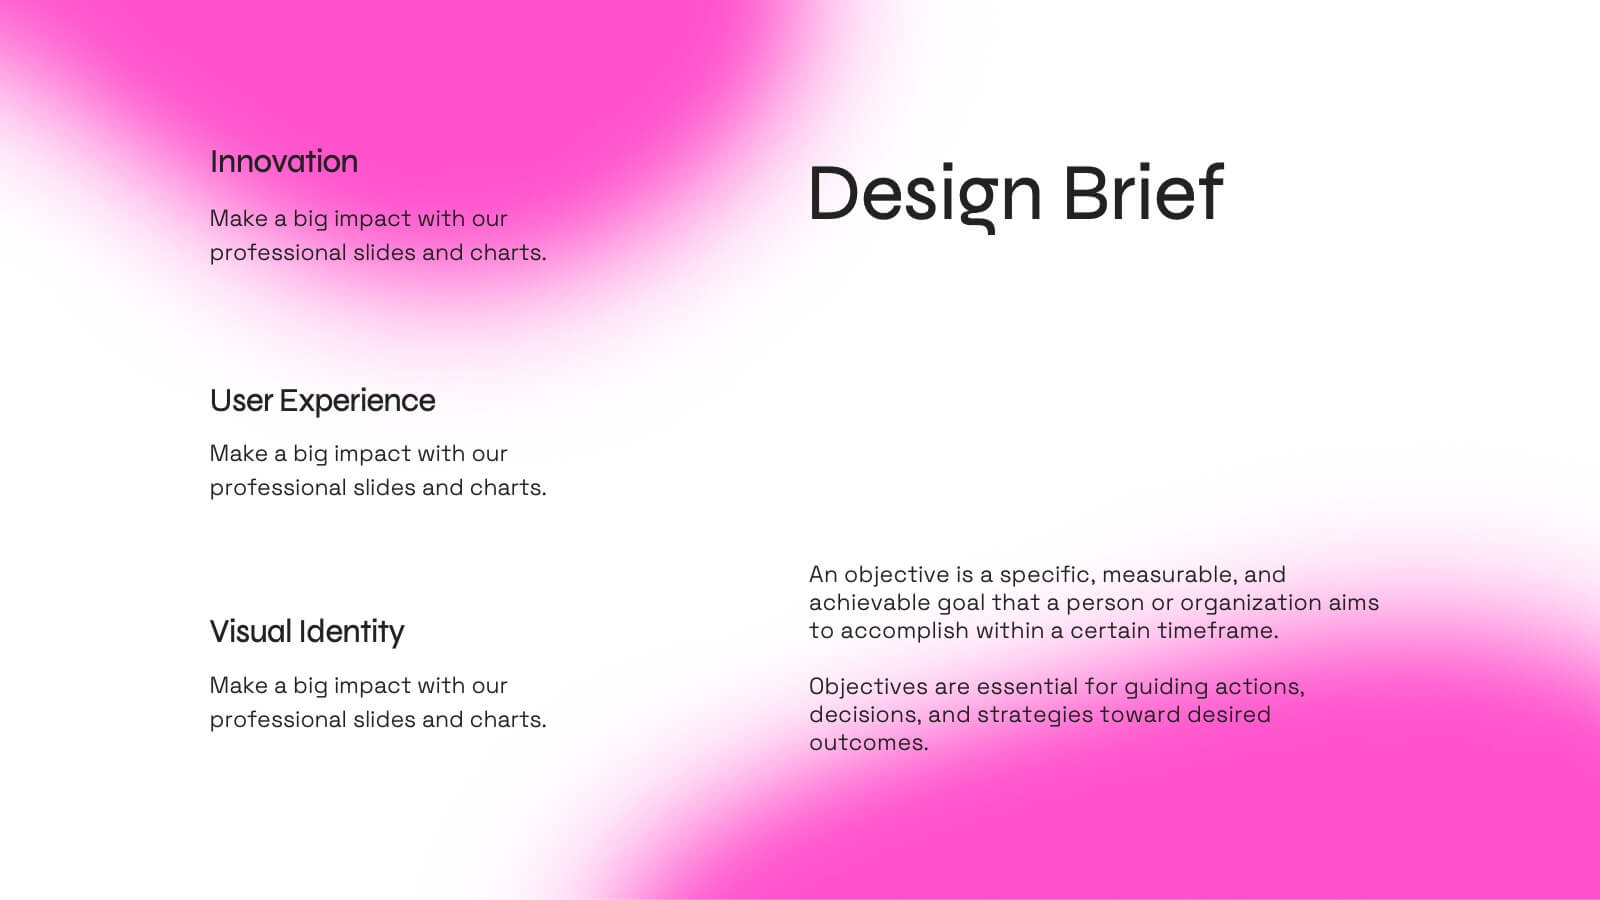
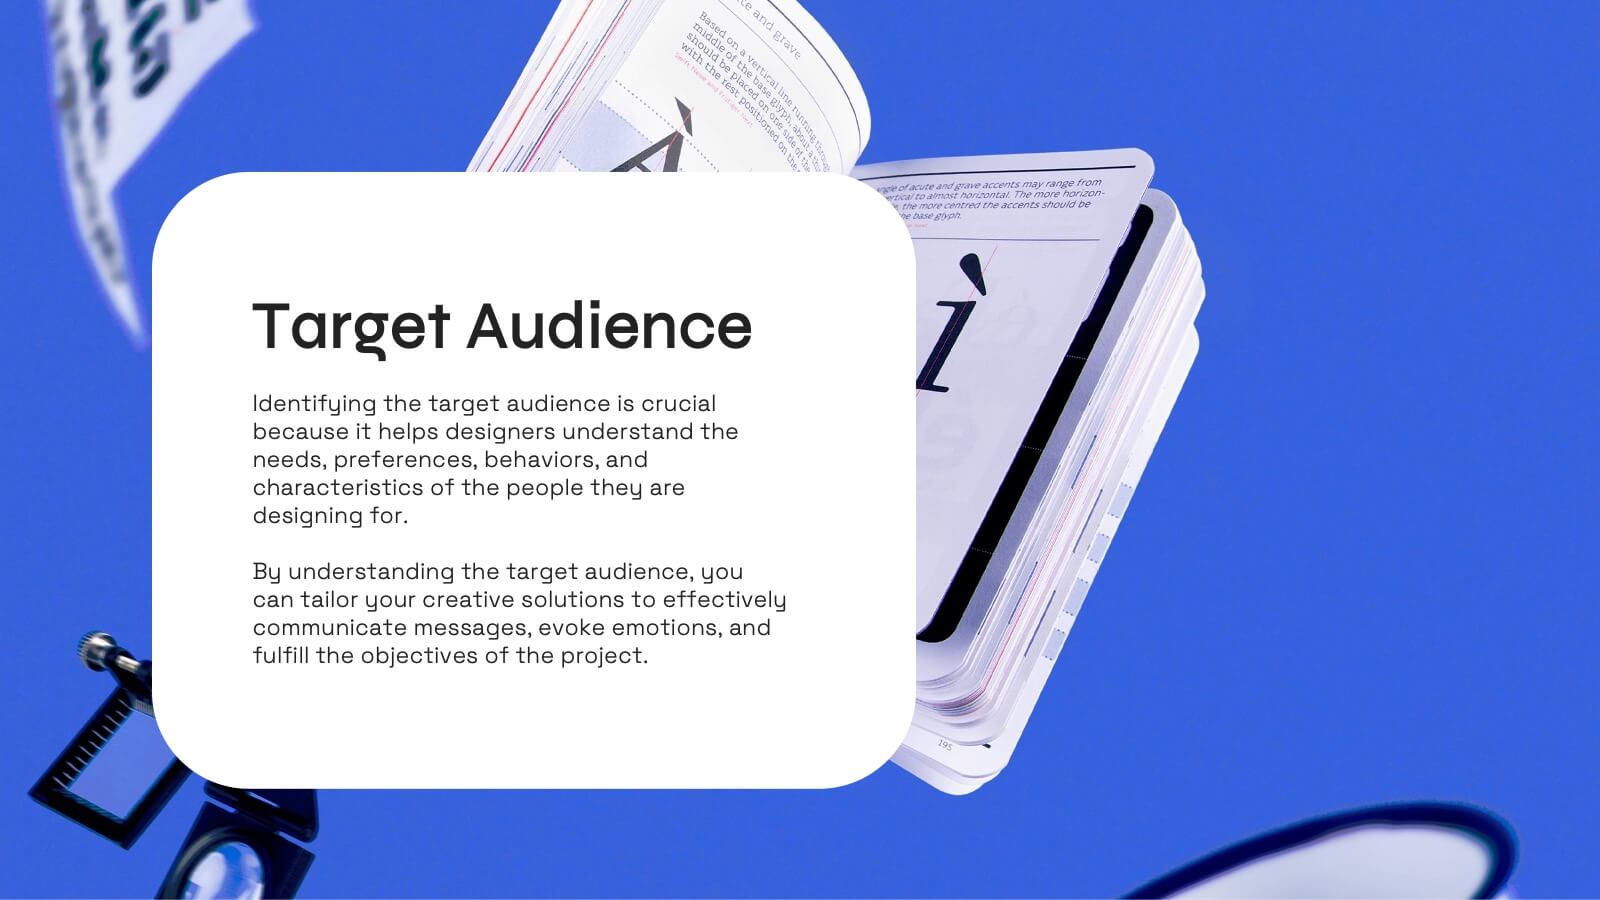
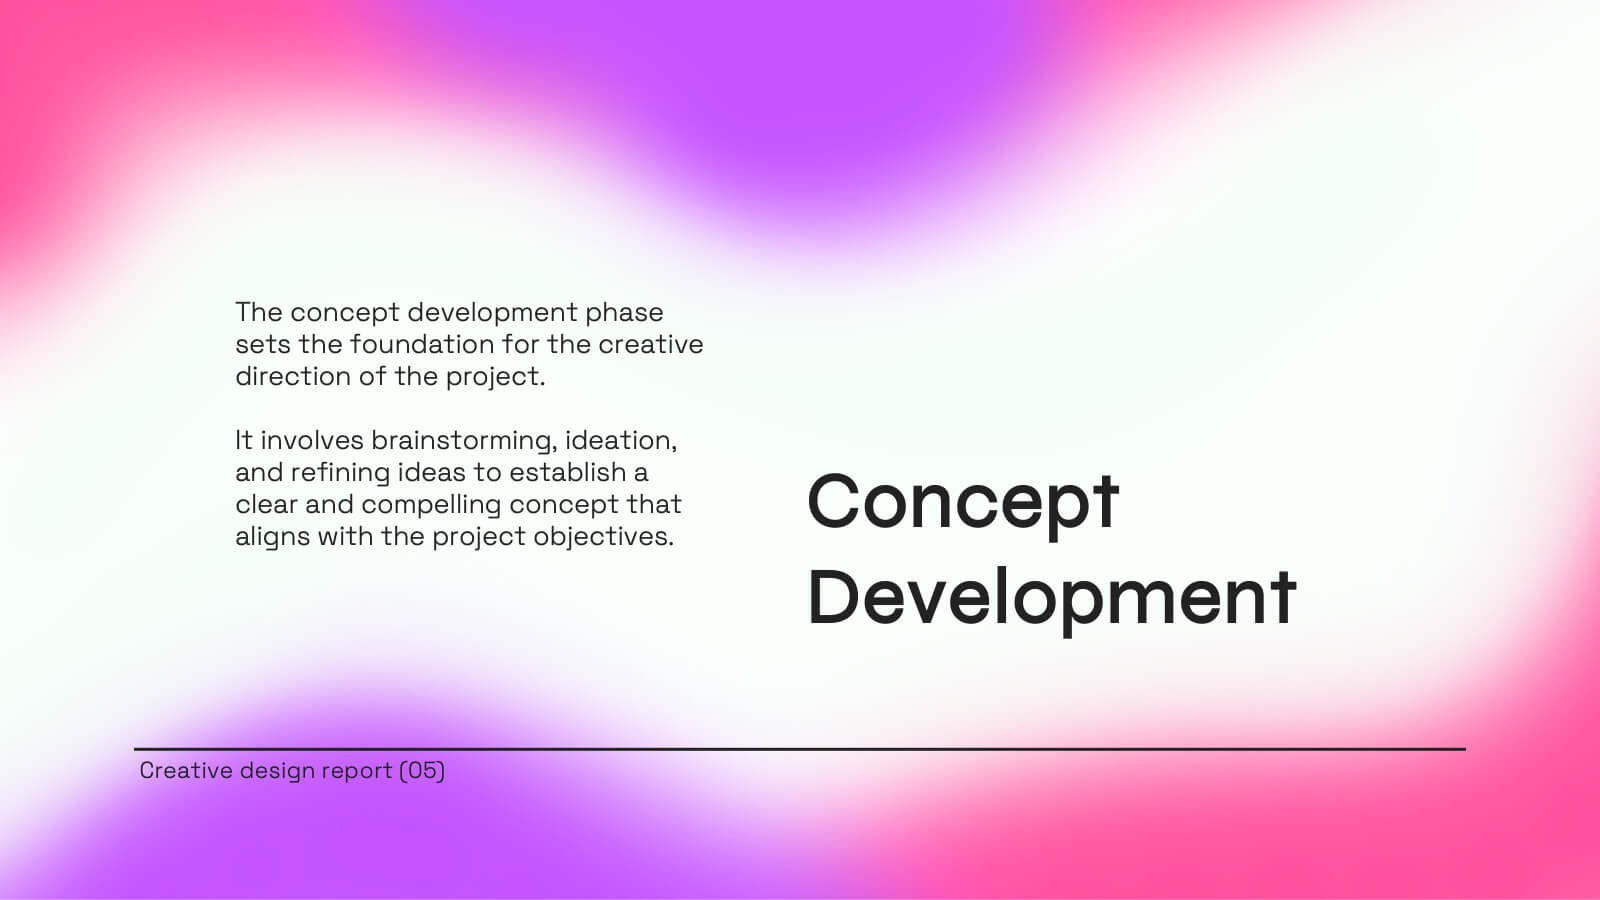
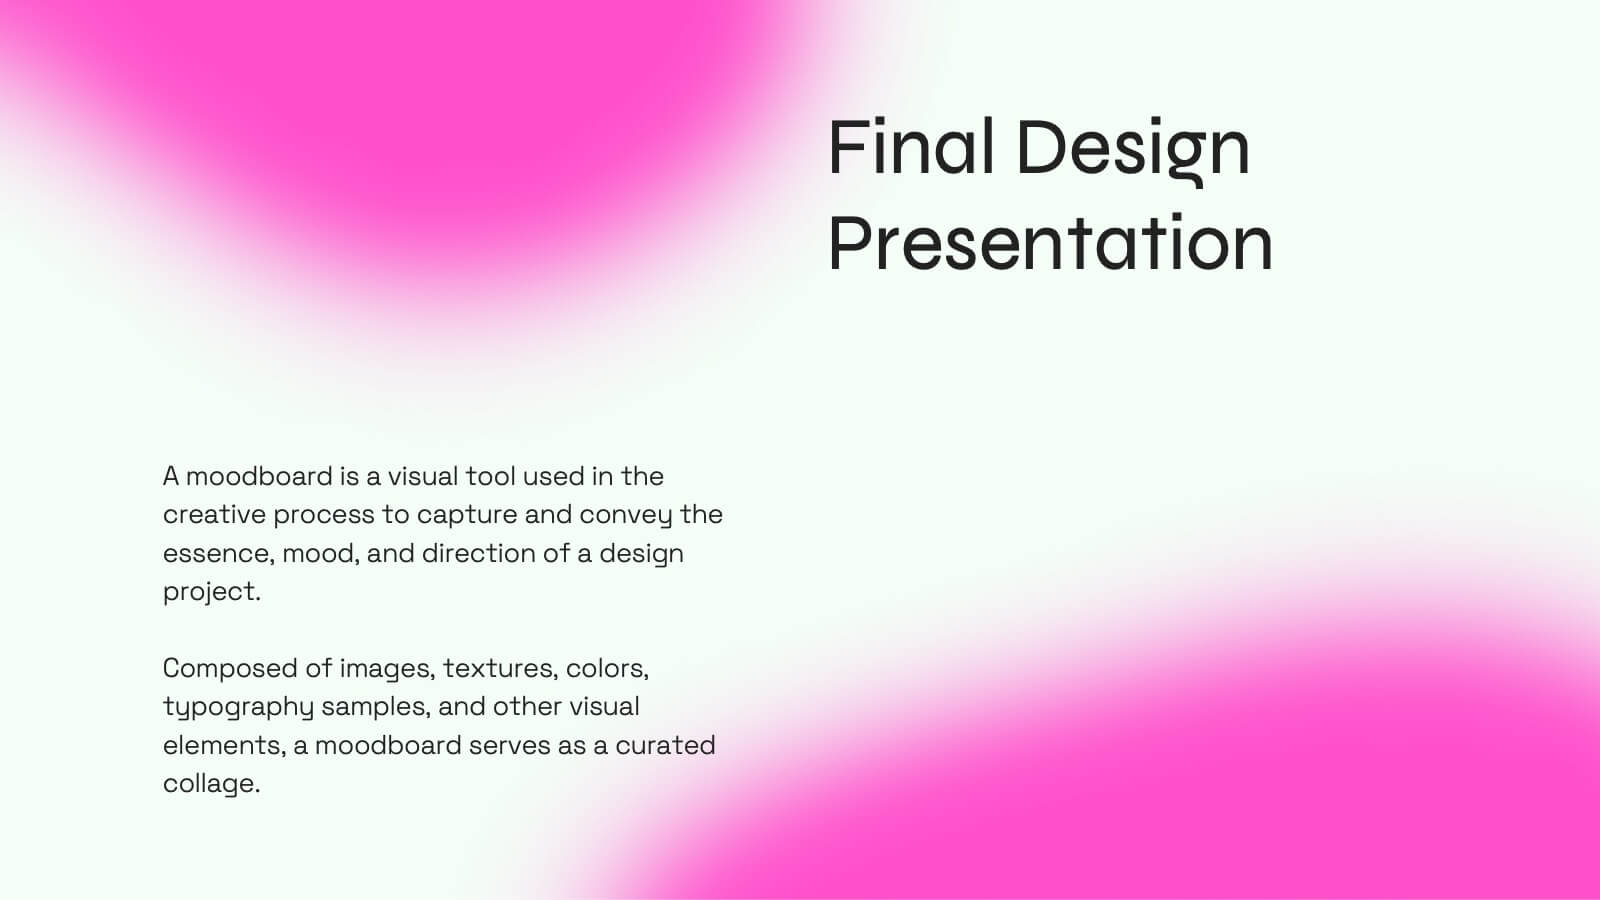
Jade Creative Design Report Presentation
Transform your design report into a captivating visual experience with this elegant jade-themed presentation template! Ideal for showcasing your creative projects, it effectively highlights key concepts, methodologies, and outcomes in a polished format. With its striking design, your work will impress clients and stakeholders alike. Compatible with PowerPoint, Keynote, and Google Slides.


7 slides
Skills Gap Report Infographic
A skills gap analysis is a systematic assessment of the difference between the skills or competencies that an individual, a team, or an organization currently possess and the skills they need to meet specific objectives or requirements. This infographic template is meticulously designed to present a deep analysis of the skills gap within an organization or industry, offering solutions and pathways to cultivate a skilled workforce. Compatible with Powerpoint, Keynote, and Google Slides. Highlight the skills that are in high demand, providing a clear understanding of where the gap exists.


4 slides
Visual Relationships in Venn Format Presentation
Highlight similarities and differences between two or more ideas using this clean, two-circle Venn diagram layout. Ideal for comparing concepts, teams, or strategies. Customize icons, text, and color themes effortlessly. Compatible with PowerPoint, Keynote, and Google Slides—perfect for business meetings, educational content, and marketing comparisons.


7 slides
World Maps Medical Security Infographic
Introducing our world map medical security infographic, a template designed to spotlight global medical security concerns and solutions. With a pristine white backdrop punctuated by shades of blue, this infographic offers a tranquil yet informative ambiance, reminiscent of the medical field. Embedded within are custom graphics of the world map, tailor-made to highlight regions based on their medical security levels, accompanied by relevant icons that represent various aspects of healthcare protection and risks. It’s compatibility with platforms such as PowerPoint, Keynote, and Google Slides ensures seamless presentations across various devices and audiences.


7 slides
Customer Thank You Infographic
Elevate your expressions of gratitude with this sophisticated collection, designed to blend elegance with heartfelt thanks. Each piece in this set is crafted with meticulous attention to detail, featuring a mix of subtle color palettes, elegant typography, and beautifully arranged visual elements to enhance the sincerity of your message. Choose from a variety of designs, ranging from minimalist to more richly layered compositions, each providing a unique way to communicate appreciation. These designs can be customized to suit any occasion, making them perfect for expressing professional thanks to clients, customers, or partners. Ideal for use across both digital and physical mediums, this collection helps ensure that your messages not only convey thanks but also resonate deeply with recipients, strengthening relationships and leaving a memorable impression.


7 slides
Fishbone Analysis Infographic Presentation
A fishbone Infographic is a technique used to brainstorm the cause of a problem. The unique design helps you understand how one thing can lead to another and is effective at helping you create a solution that reviews all aspects. Start this template off using the head of the fish as a prompt and webbing out from there, draw up to six main causal categories and then sub-categories. Use this infographic to organize your ideas and identify key factors, as well as decide how to prioritize them. This template is compatible and completely editable with Powerpoint, keynote and google slides.


5 slides
AIDA Funnel for Marketing Strategy Presentation
This presentation template breaks down the AIDA model—Attention, Interest, Desire, Action—into a clean, engaging layout. Perfect for marketing strategies, campaign planning, or customer journey mapping. Easily customizable in Canva, it combines modern icons, bold typography, and horizontal flow to clearly visualize your marketing funnel in a compelling, structured format.


7 slides
RAPID Traceability Matrix Infographic
The RAPID Traceability Matrix infographic template provides a visual tool for mapping out decision-making roles within project management. Compatible with PowerPoint, Google Slides, and Keynote, this template array features various layouts to assign and display the roles of Recommend, Agree, Perform, Input, and Decide across multiple team members and project tasks. Utilizing a clean and organized design, each slide incorporates colored icons and matrix tables to clearly delineate responsibilities. This approach helps in clarifying the decision-making process and ensuring accountability within project teams.


7 slides
Work From Home Benefits Infographic
The modern digital era has ushered in a revolution: the feasibility of working from home. Our work from home benefits infographic, crafted with a crisp white palette highlighted by shades of red and subtle black touches, dives deep into the multifaceted advantages of remote work. Whether it's the flexibility in hours, reduced commute stress, or the savings made, this template sheds light on every facet. This infographic template is perfect for professionals, team leaders, and organizations keen to adopt this model, its seamlessly compatible with PowerPoint, Keynote, and Google Slides.


2 slides
Elegant Thank You Slide Presentation
Leave a lasting impression with this elegant thank-you slide template! Perfect for closing presentations with professionalism, this design features a modern layout with space for contact details and branding. Ideal for business meetings, pitches, and corporate events. Fully customizable and compatible with PowerPoint, Keynote, and Google Slides for seamless editing.