


Features
- 12 Unique slides
- Fully editable and easy to edit in Microsoft Powerpoint, Keynote and Google Slides
- 16:9 widescreen layout
- Clean and professional designs
- Export to JPG, PDF or send by email


Do you have any questions?
Recommend


10 slides
Project Management Stages
Master project management with our "Project Management Stages" template. This visually engaging presentation design effectively illustrates the project lifecycle across five key stages: Initiation, Planning, Execution, Monitoring, and Closure. Each stage is distinctively represented by a colored 3D block, visually stacked to highlight the progression and foundational importance of each phase. This clear, structured layout simplifies complex processes and emphasizes effective project management techniques. Ideal for project managers, team leaders, and educators, it serves as a vital tool for explaining workflows and responsibilities. Compatible with PowerPoint, Keynote, and Google Slides, this template is perfect for enhancing presentations on project planning and execution.


6 slides
Threat and Mitigation Bowtie Model
Break down complex threats and responses with the Threat and Mitigation Bowtie Model Presentation. This infographic visualizes the relationship between root causes, a central hazard event, and its potential consequences—alongside the controls that mitigate them. Clean, editable layouts and multiple visual states let you emphasize either side of the bowtie. Ideal for risk assessments, business continuity planning, and safety presentations. Compatible with PowerPoint, Keynote, and Google Slides.


6 slides
Sales Associate Infographic
A sales associate, also known as a sales representative or salesperson, is an individual who is responsible for selling products or services to customers. This infographic template is designed to highlight the key roles, skills, and responsibilities of a sales associate. It provides an informative and engaging overview of the sales associate's role within a company or organization, showcasing their contribution to sales and customer satisfaction. This template is suitable for various industries and can be customized to fit specific company or organizational contexts. Compatible with Powerpoint, Keynote, and Google Slides, this is easily customizable.


26 slides
Forge Brand Strategy Report Presentation
The Brand Strategy Presentation Template is a sleek solution for showcasing brand identity. Highlight mission, values, audience personas, and future growth plans across 26 structured slides. Fully customizable for PowerPoint, Keynote, and Google Slides, it’s ideal for presenting brand insights to clients or stakeholders with professionalism and clarity.


7 slides
Root Cause Model Infographic
Unlock problem-solving efficiency with our Root Cause Analysis Model Infographic, designed for process engineers, quality assurance teams, and business managers. This infographic is a strategic tool to dissect complex issues and identify underlying causes of operational challenges. Our infographic outlines a step-by-step methodology to trace problems back to their fundamental causes, using visual diagrams to map out cause-and-effect relationships. It's crafted to facilitate a thorough examination of processes, systems, and outcomes, promoting a deep understanding of business issues. Customizable elements allow you to detail specific causes, impacts, and the interplay between different contributing factors. This SEO-optimized infographic is designed to be an accessible resource for professionals dedicated to continuous improvement and corrective action planning. Employ this infographic to guide your team through root cause analysis, fostering a culture of proactive problem-solving and sustainable solutions within your organization.


6 slides
Advanced Project Timeline with Gantt Layout
Keep complex projects on track with the Advanced Project Timeline with Gantt Layout Presentation. This slide makes it easy to outline task durations over multiple weeks, providing a clear visual of overlaps, dependencies, and pacing. Ideal for managers, teams, and stakeholders needing a structured view of multi-week initiatives. Compatible with PowerPoint, Keynote, and Google Slides for seamless updates.


7 slides
Change Management Presentation Template
Our Change Management Infographic is designed to visually present your information. This infographic presentation comes with a seven page layout, all neatly arranged into a well-organized structure, which shows the steps of a change management process. This can be used for any kind of presentation purpose, education, employees, new product launch or even for training executives, managers and supervisors. With this template the variety of elements included are to help you create your own personalized content, you can make your own presentations for any business or industry in just minutes!


5 slides
4-Piece Puzzle Diagram Presentation
Break down complex concepts with the 4-Piece Puzzle Diagram. This intuitive visual aid allows you to illustrate relationships, key components, and strategic elements in a clear and structured format. Perfect for business presentations, project planning, and educational content, this template ensures seamless customization and compatibility with PowerPoint, Keynote, and Google Slides.


6 slides
Workplace Safety and Compliance
Simplify safety protocols with this visual workplace compliance slide. Featuring a clear cone-style graphic and three editable sections, it's ideal for outlining procedures, regulations, and training checkpoints. Perfect for HR teams, safety briefings, and internal audits. Editable in PowerPoint, Keynote, and Google Slides.


3 slides
Stock Market Investment Analysis Presentation
Unlock the secrets of the stock market with our "Stock Market Investment Analysis" presentation templates. Ideal for financial analysts and investors, these templates provide a clear framework for analyzing trends and making informed decisions. With easy-to-edit elements and professional design, they are perfect for delivering compelling investment insights. Compatible with PowerPoint, Keynote, and Google Slides, they ensure your analysis looks sharp and persuasive across all platforms.


4 slides
Product & Pricing Plan Matrix Presentation
Simplify complex pricing and product details with the Product & Pricing Plan Matrix Presentation. This structured grid layout is ideal for comparing multiple service tiers, packages, or feature sets side-by-side. Easily customizable, each block allows you to highlight key offerings, benefits, and pricing strategies. Compatible with Canva, PowerPoint, Keynote, and Google Slides.


3 slides
Break Even Financial Model Presentation
Bring your financial story to life with this sleek and professional presentation design. Ideal for illustrating profit margins, cost recovery, or growth potential, it helps visualize when investments start to pay off. Fully customizable and compatible with PowerPoint, Keynote, and Google Slides for effortless editing and impactful presentations.


7 slides
Aviation School Infographic Presentation
If you're in search of striking visuals for your upcoming aviation school presentation, we've got just the solution for you. Our expertly crafted infographic template is designed to captivate and engage your audience, ensuring that your message is conveyed with maximum impact. Our template covers a diverse range of aviation topics, including airport and runway security. This guarantees that your information is presented in a clear, concise, and visually compelling manner. With our aviation infographic template, you'll be able to deliver an outstanding presentation that resonates with your audience and leaves a lasting impression.


22 slides
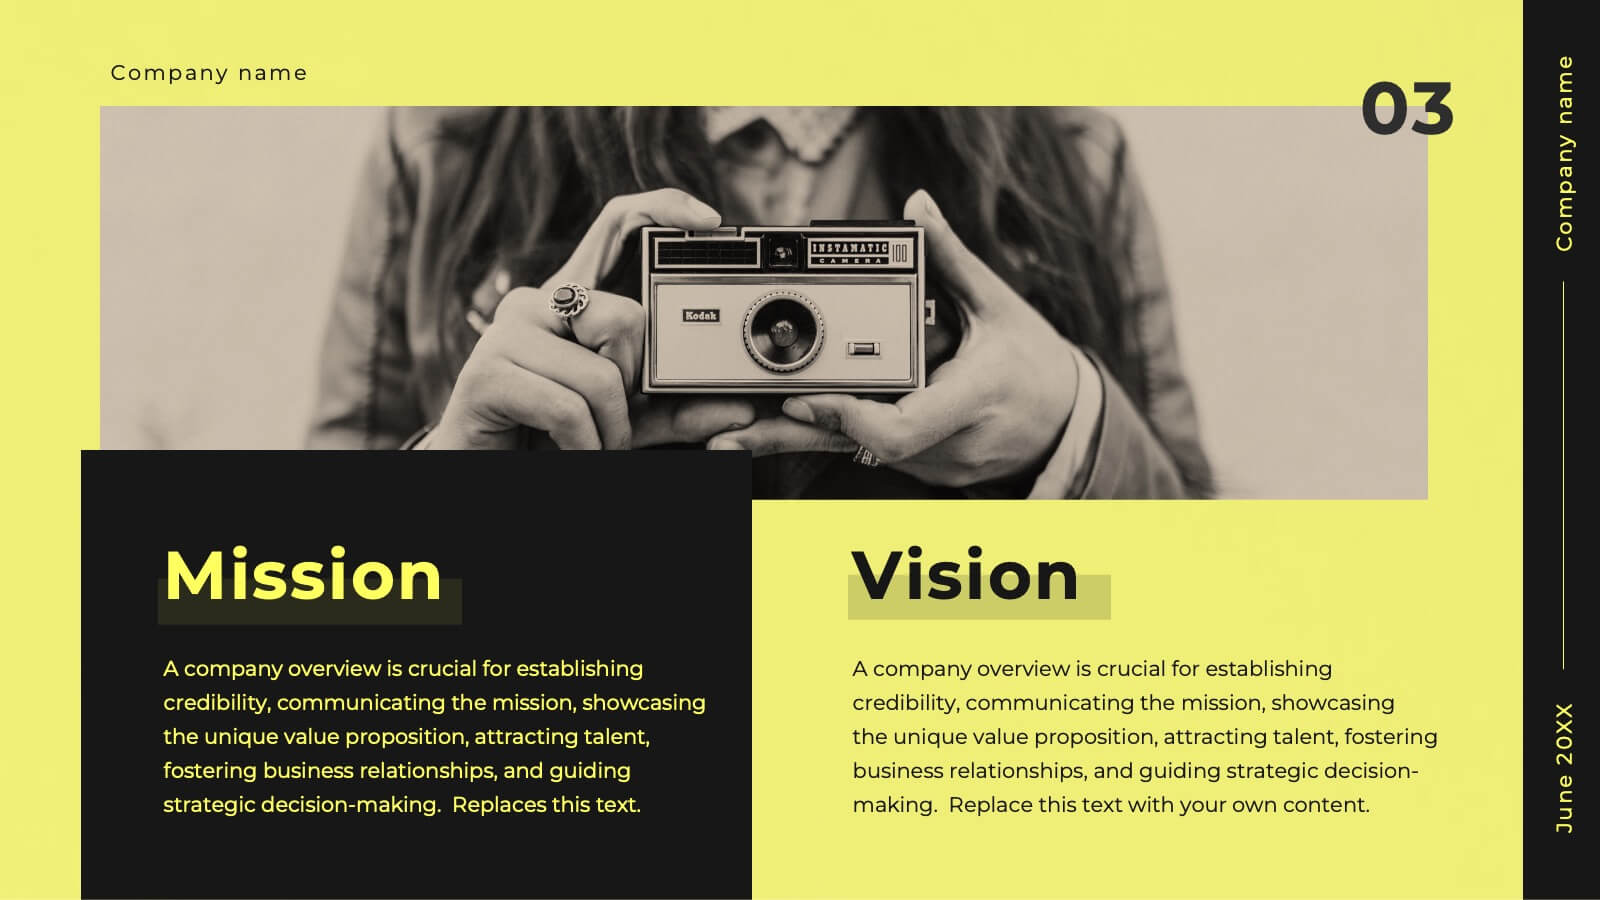
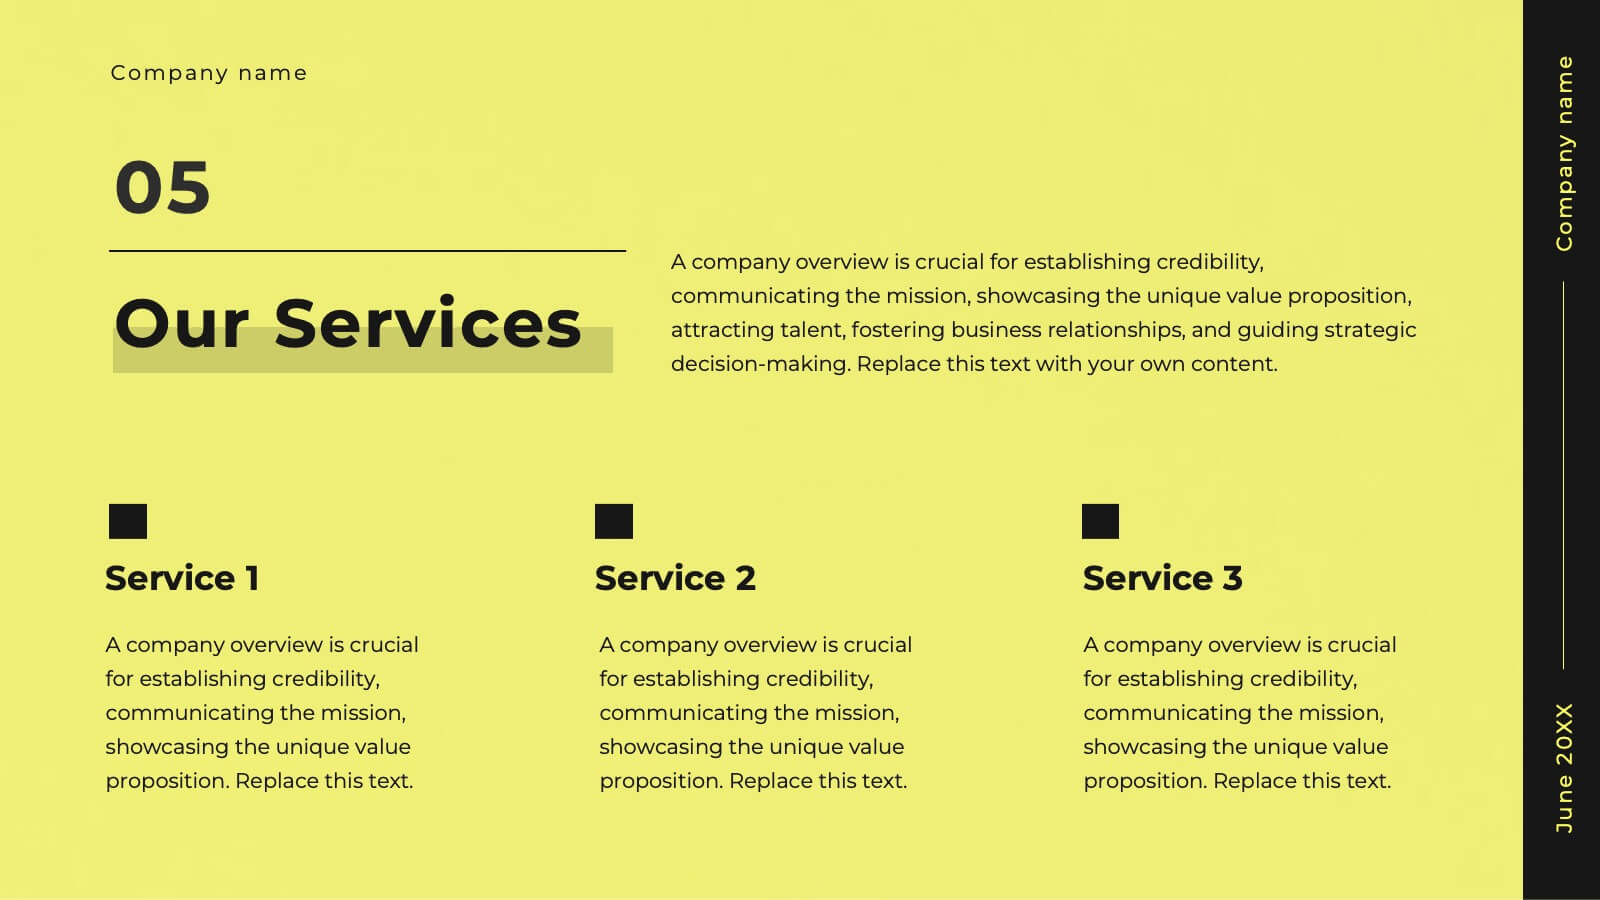
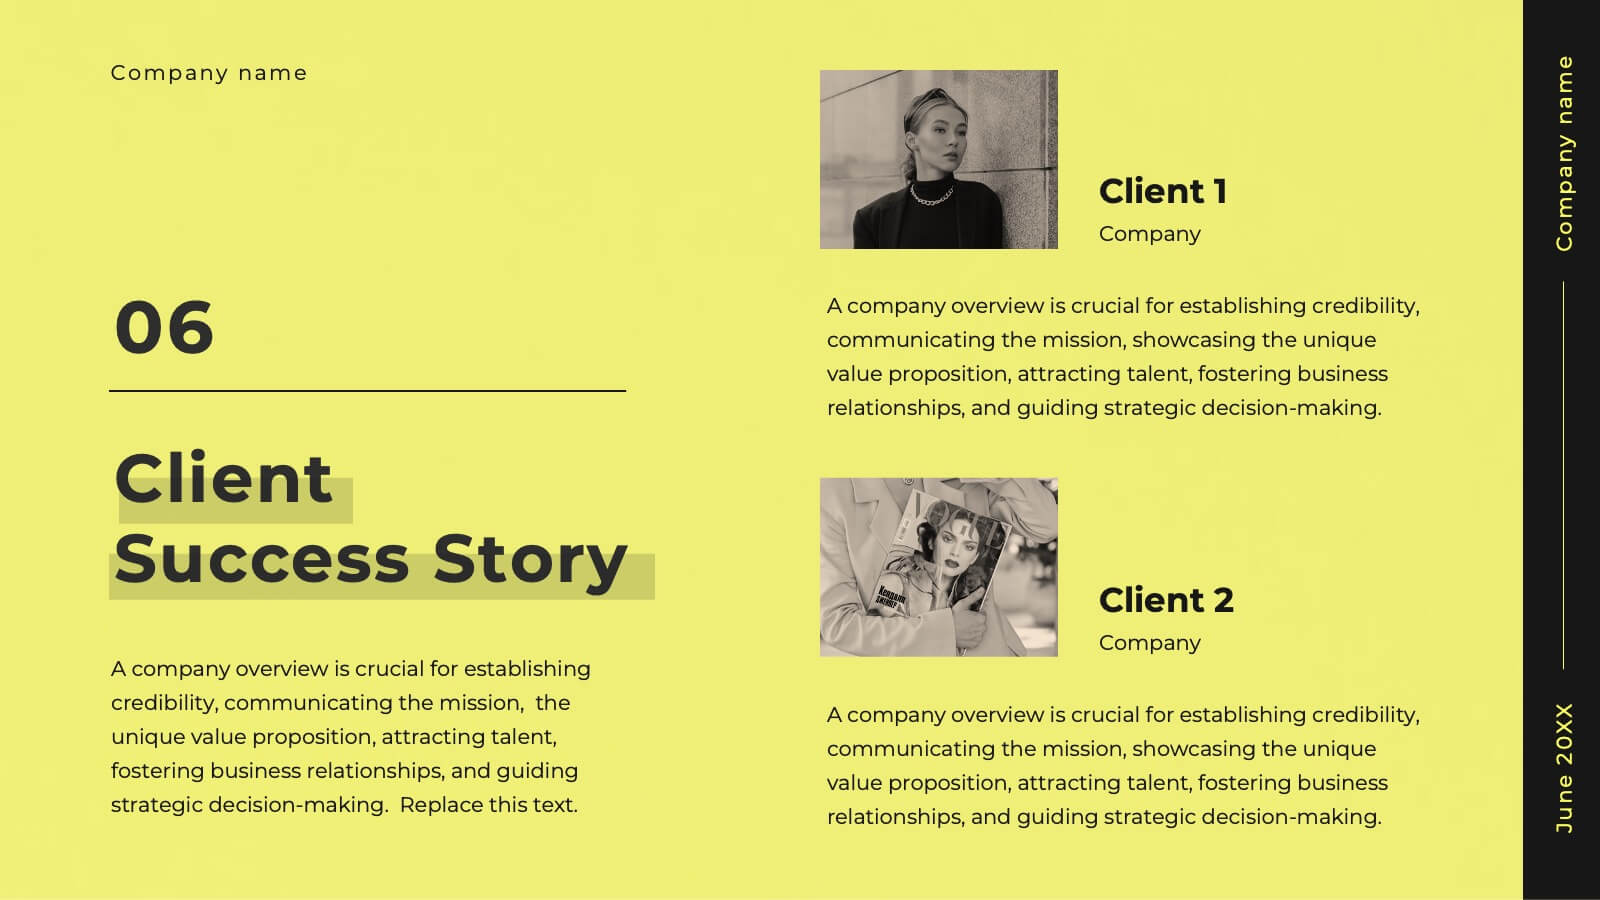
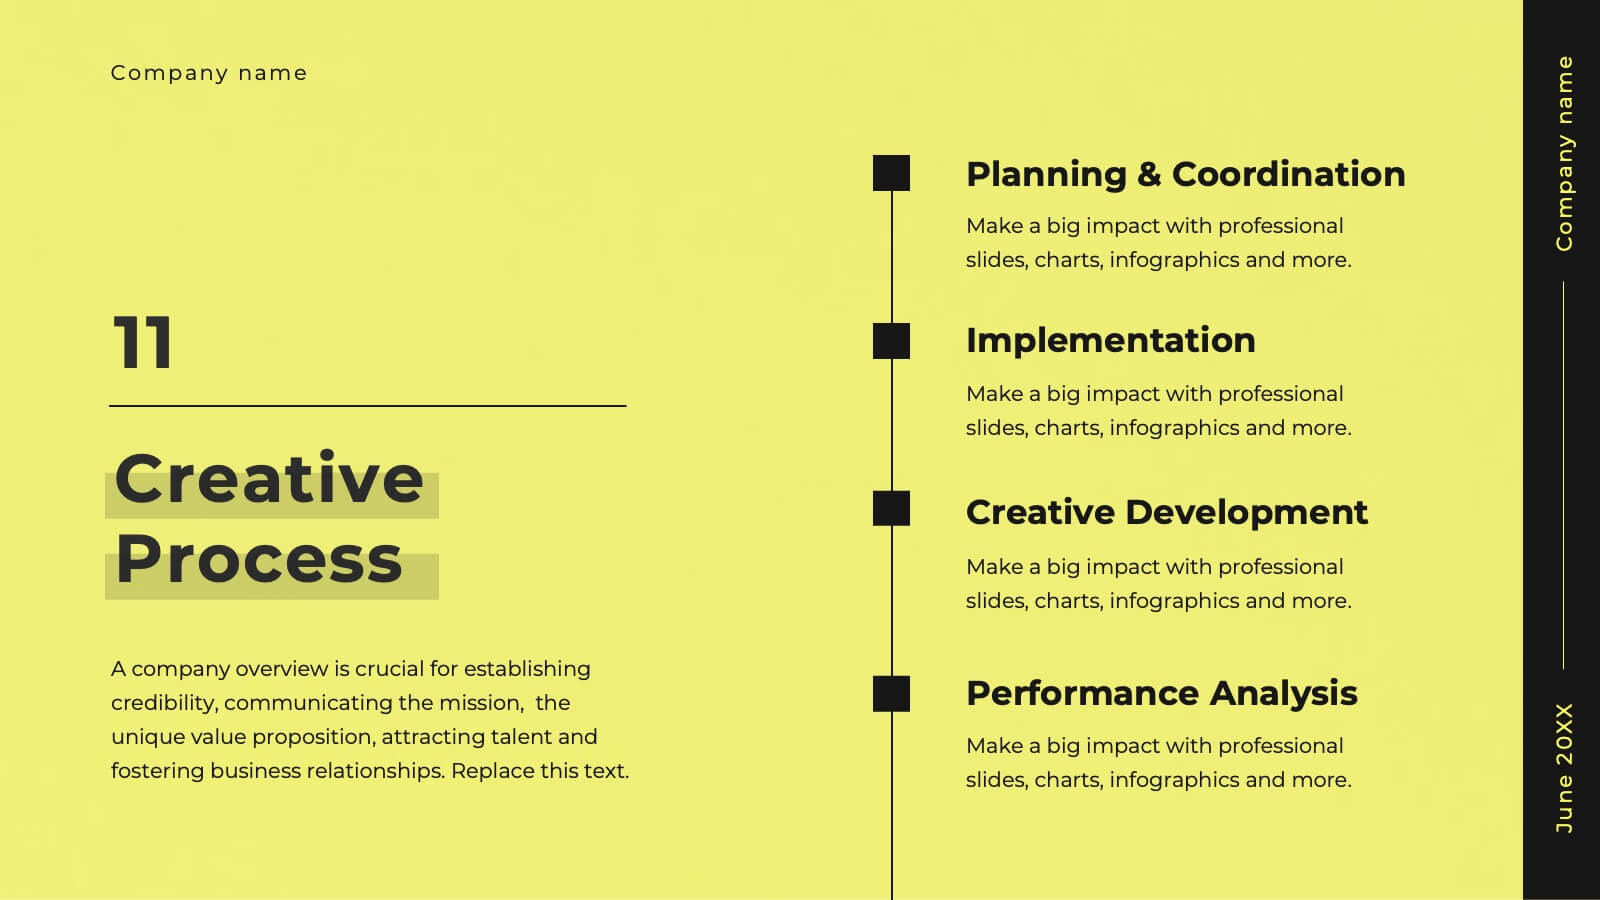
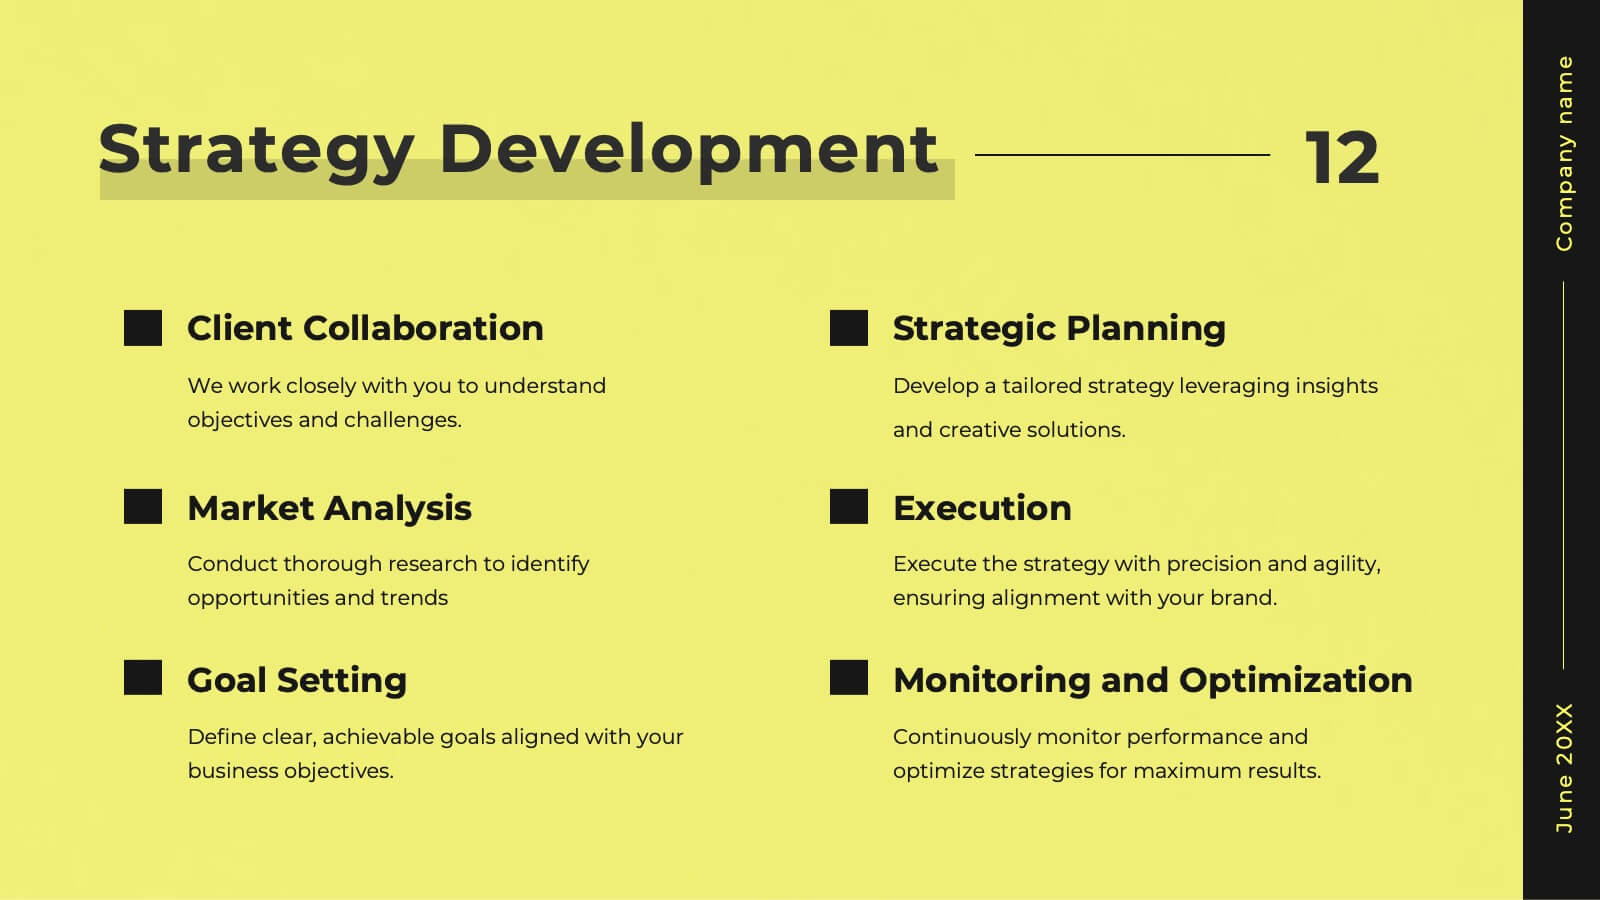
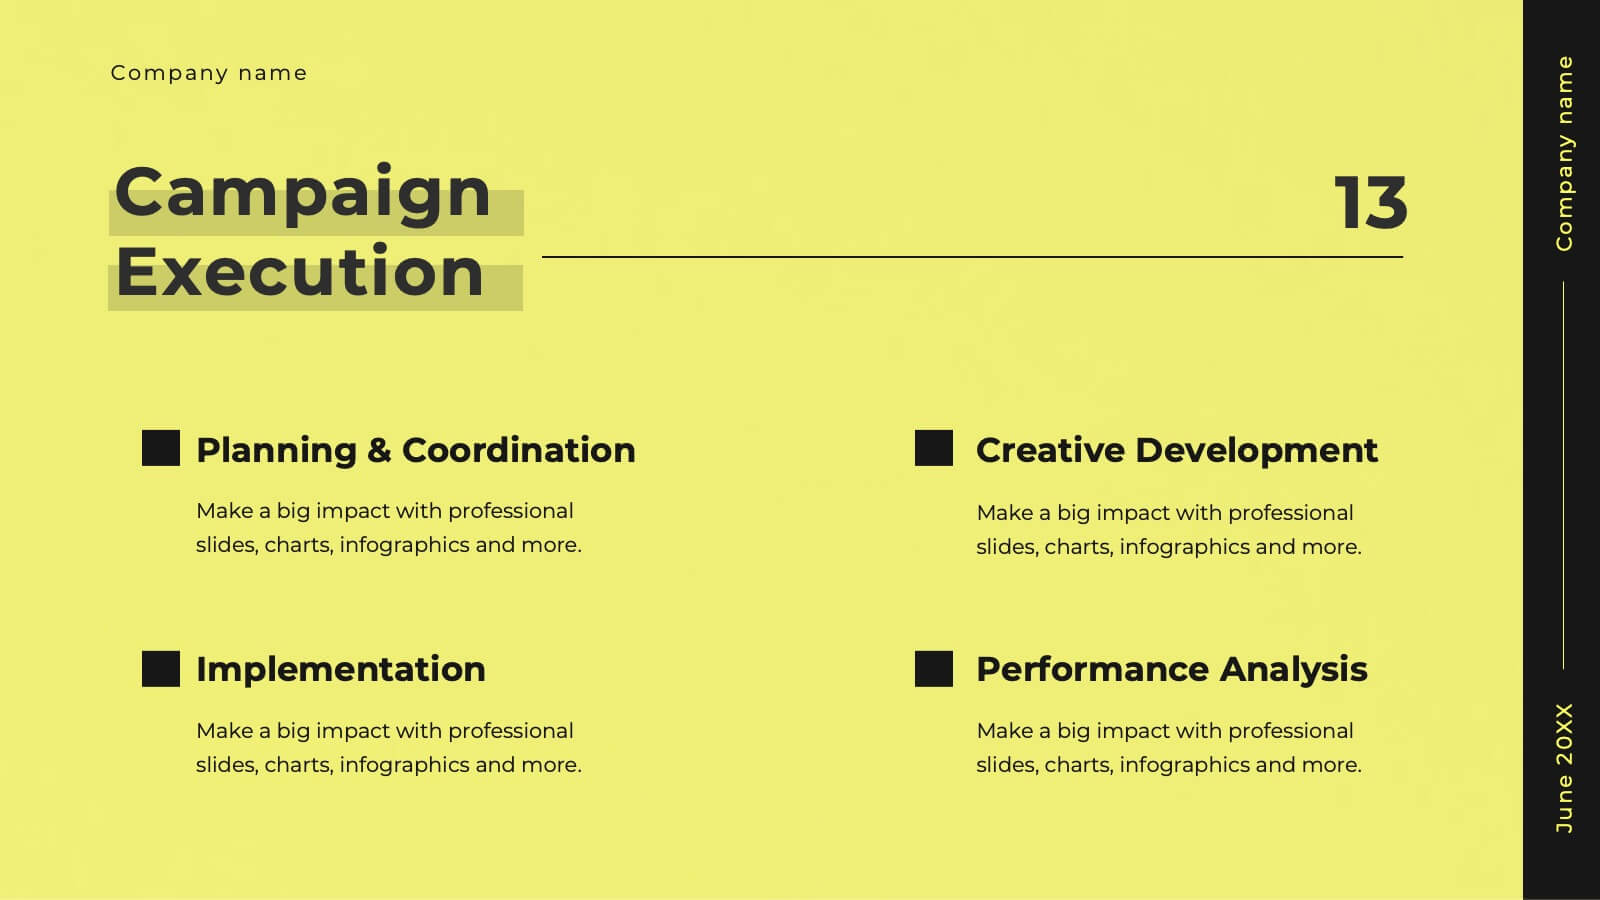
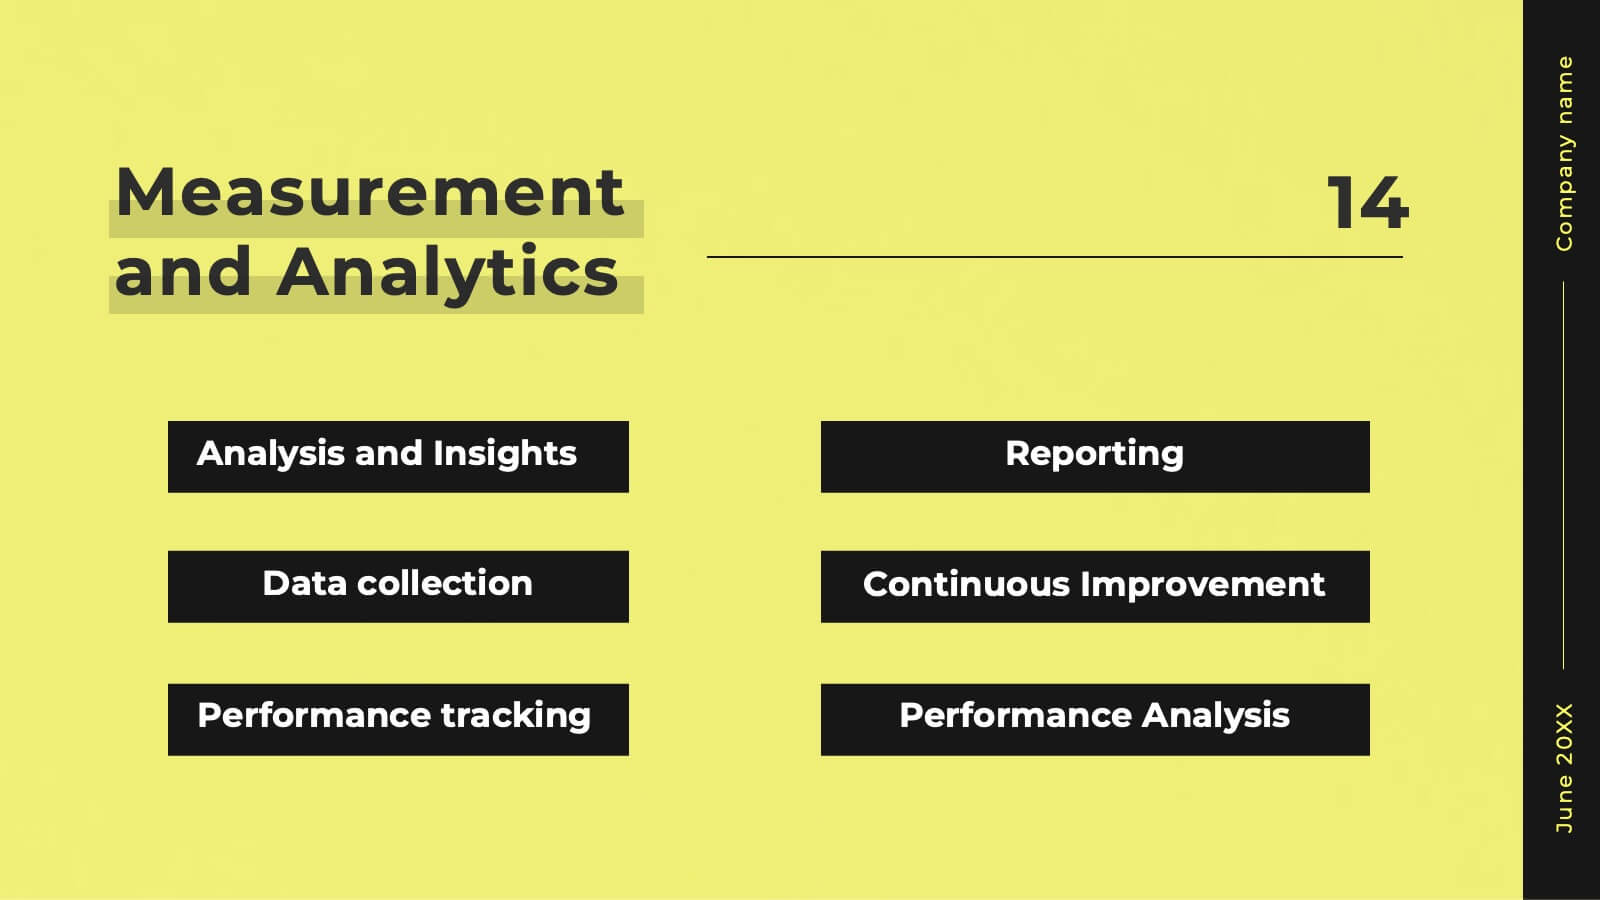
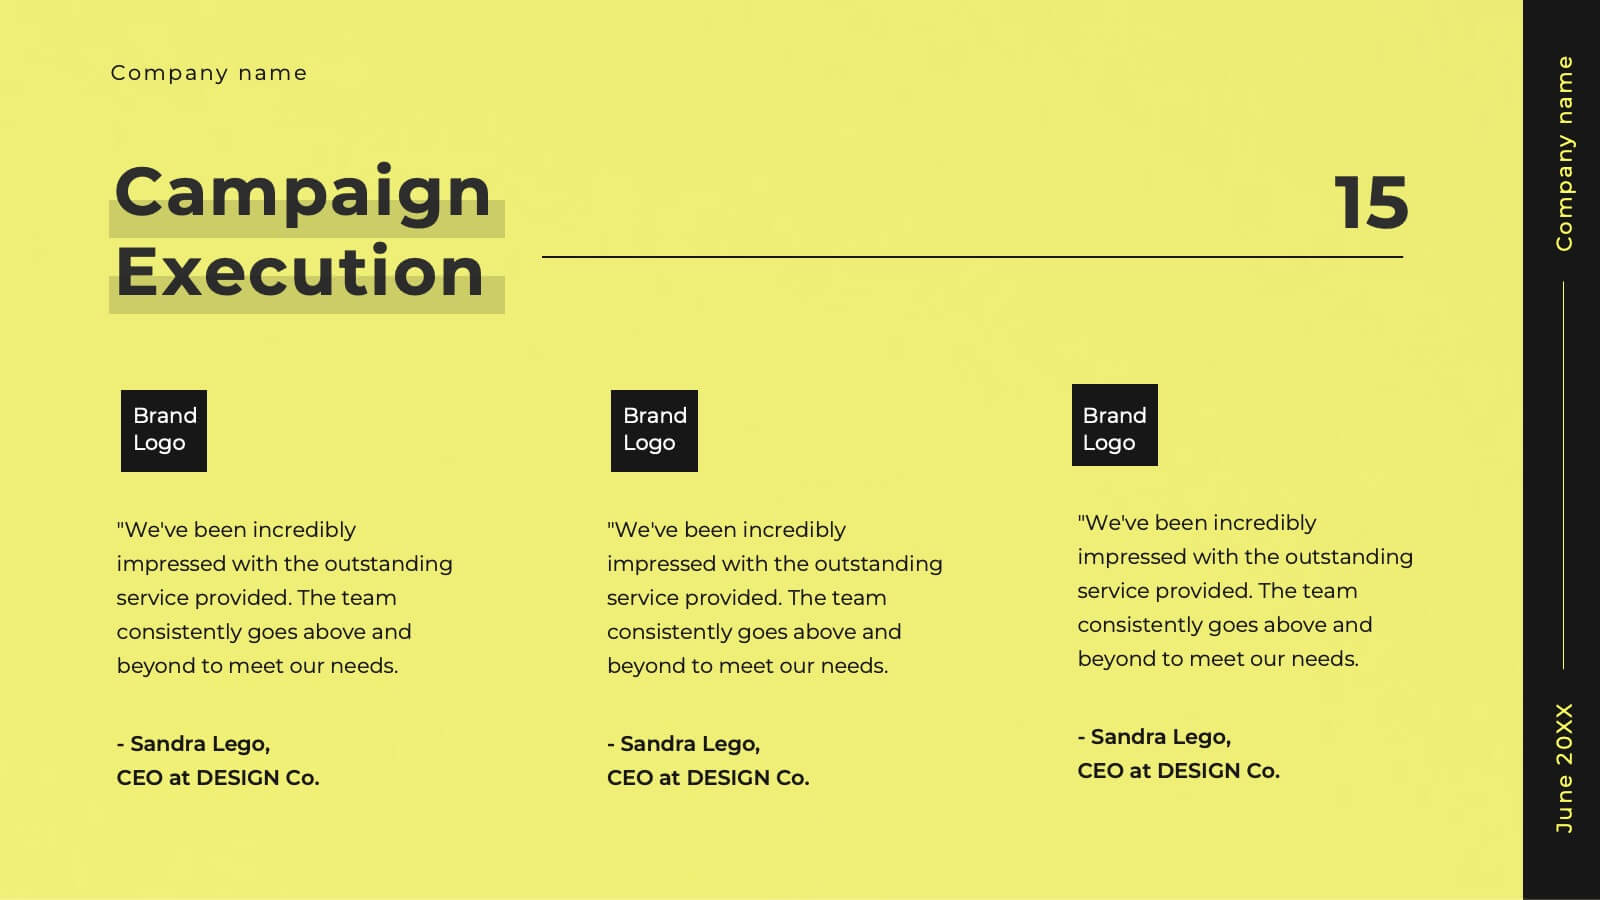
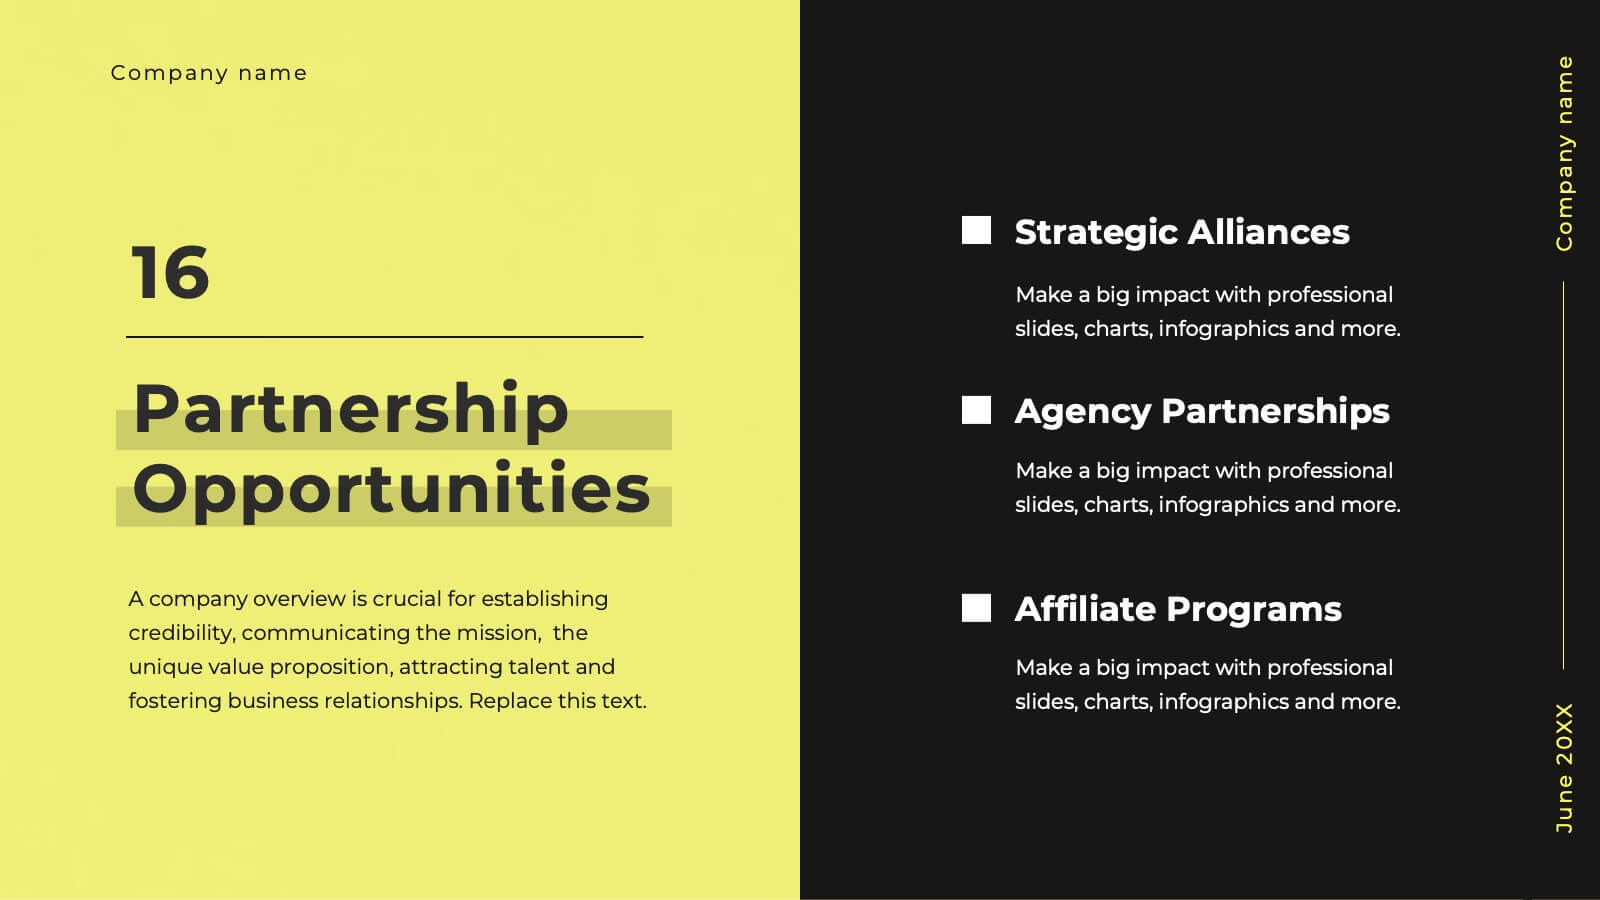
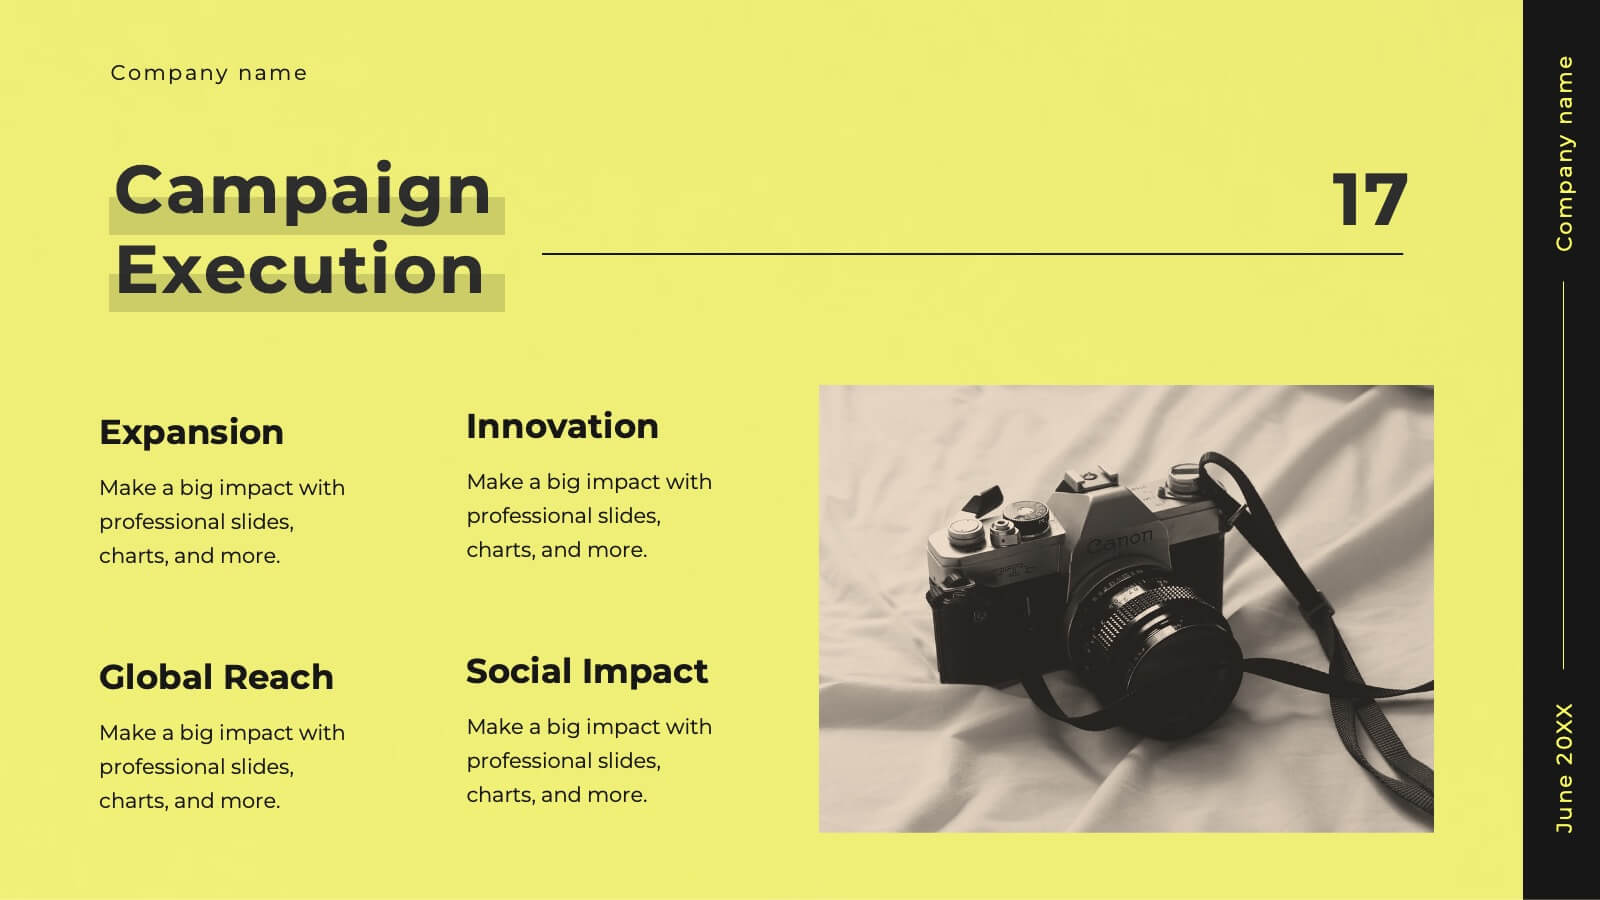
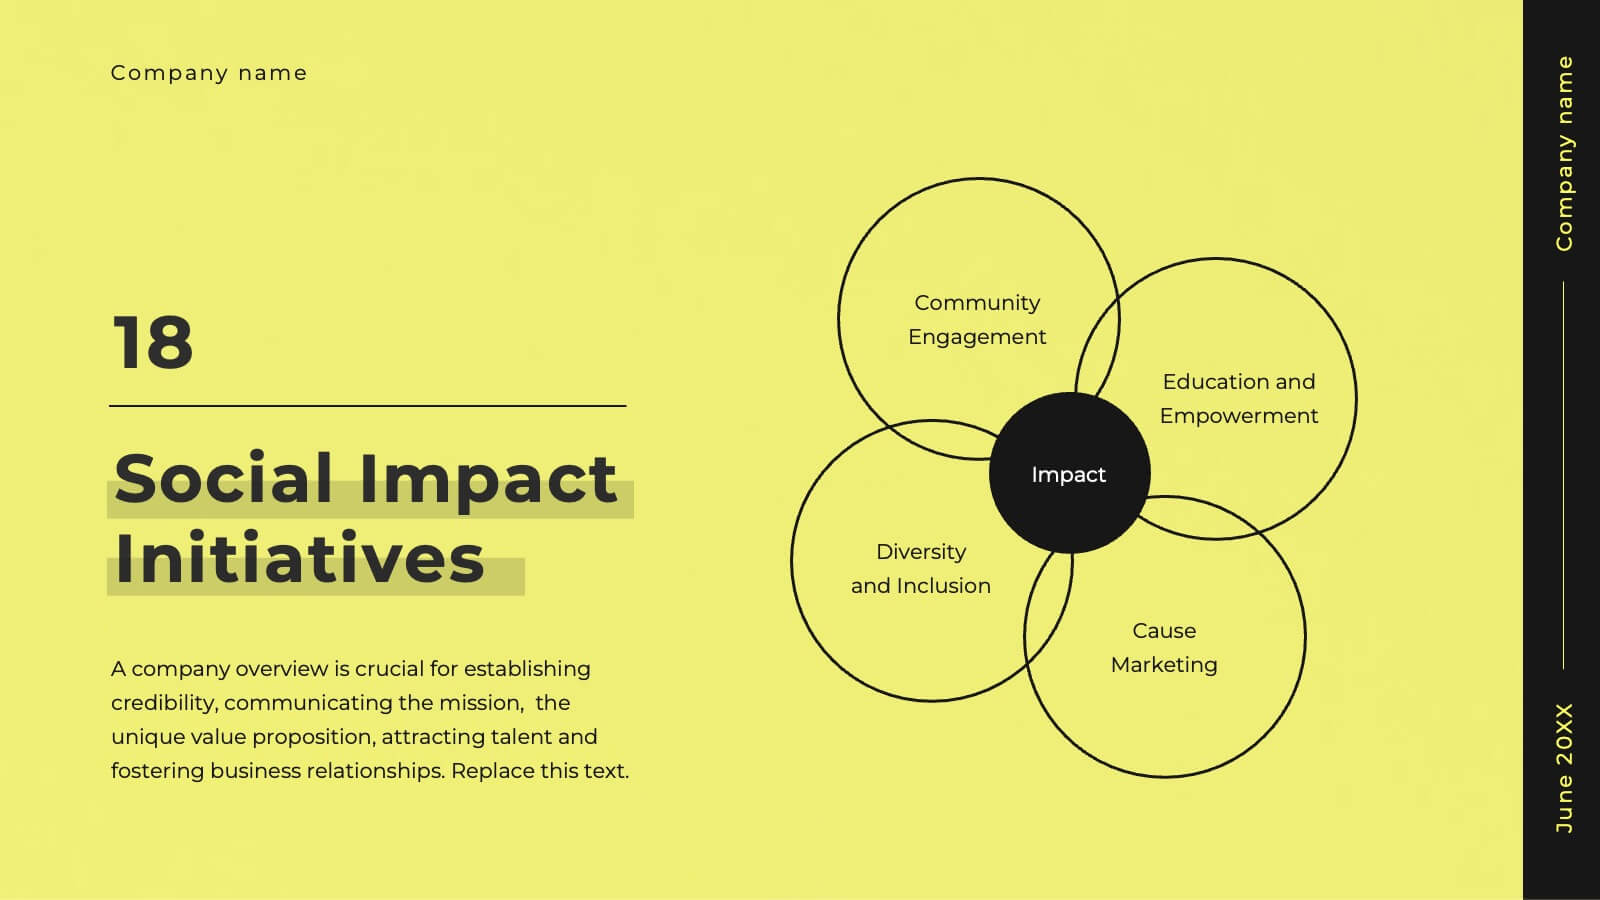
Glimmer Creative Agency Pitch Deck Presentation
Step up your game with this vibrant agency pitch deck template! Ideal for showcasing your services, client success stories, and strategic approach, it includes dynamic slides for market analysis and campaign execution. Engage potential clients with compelling visuals and well-organized content. Compatible with PowerPoint, Keynote, and Google Slides for a smooth presentation experience on any platform.


5 slides
Closing Talent Gaps with Skills Data Presentation
Showcase a clear talent strategy with the Closing Talent Gaps with Skills Data Presentation. This infographic-style layout visualizes key workforce stages, helping teams align talent capabilities with organizational needs. Ideal for HR, L&D, and talent management discussions. Fully customizable in Canva, PowerPoint, Google Slides, and Keynote.


5 slides
Vaccine Myths Infographic
Vaccine Myths are false or misleading claims about vaccines that can contribute to vaccine hesitancy and misinformation. These infographic templates are designed to debunk common misconceptions and myths surrounding vaccines. These visually appealing and informative templates are ideal for healthcare professionals, educators, and organizations aiming to promote accurate information about vaccines and combat vaccine hesitancy. These infographics aim to educate and empower individuals to make informed decisions about vaccination and contribute to public health efforts. Compatible with Powerpoint, Keynote, and Google Slides.


6 slides
Constructive Feedback Infographics
Improve your feedback processes with our Constructive Feedback infographic template. This template is fully compatible with popular presentation software like PowerPoint, Keynote, and Google Slides, allowing you to easily customize it to illustrate and communicate the principles of providing effective constructive feedback. The Constructive Feedback infographic template offers a visually engaging platform to outline the key elements of delivering feedback that promotes growth and improvement. Whether you're a manager, team leader, educator, or simply interested in enhancing your feedback skills, this template provides a user-friendly canvas to create informative presentations and educational materials. Optimize your feedback delivery with this SEO-optimized Constructive Feedback infographic template, thoughtfully designed for clarity and ease of use. Customize it to showcase the importance of specific, actionable, and balanced feedback, helping you enhance communication and drive positive change within your team or organization. Start crafting your personalized infographic today to become more proficient in providing constructive feedback.