


Features
- 5 Unique slides
- Fully editable and easy to edit in Microsoft Powerpoint, Keynote and Google Slides
- 16:9 widescreen layout
- Clean and professional designs
- Export to JPG, PDF or send by email


Do you have any questions?
Recommend


7 slides
Aviation Infographic Presentation Template
Featuring our light, vibrant and eye-catching aviation infographic template compatible with PowerPoint. The theme is designed to show you the key facts and figures about your topic, so you can easily produce a stunning presentation. This infographic is a visual representation of information related to aviation, presented in a clear and visually appealing way. With this template cover topics such as aviation history or the economic impact of the aviation industry. The information in the template can be in the form of statistics, data visualizations, timelines, maps, or other graphical elements.


6 slides
Harvey Ball Analysis Infographic
The Harvey Ball Analysis, often referred to as the Harvey Ball Method or simply the Harvey Ball, is a visual representation technique used for comparative assessment. This infographic template visually represents data using Harvey Balls, which are simple circular icons that can be filled or unfilled to represent different levels of a specific attribute. The infographic involves using a series of circles, typically colored, to represent and compare different items or variables. This template is perfect for businesses and decision-making to visually communicate the relative performance or significance of various options, elements, or categories.


26 slides
Abstract Technology Presentation
Artificial intelligence is helping to drive the future and make it better, it has the potential to transform how we live and work. This is a detailed presentation template for artificial intelligence technology, with an abstract design and chart slides that can be used to demonstrate how this technology works. This template will help you inform your audience about what artificial intelligence is. Easy to edit and customize, this template will allow you to create your own story around the concept of artificial intelligence, while still presenting your information in an organized format.


6 slides
Financial Credit Card Analysis Presentation
The Financial Credit Card Analysis presentation template offers a comprehensive visual tool for comparing different aspects of credit card features. Designed for clarity and impact, this template showcases key data points like interest rates, reward programs, fees, and user benefits across multiple cards in a color-coded format. Each segment is clearly labeled for easy understanding, making it an excellent choice for financial analysts, advisors, or anyone presenting credit card options to clients or within financial education workshops. The modular design allows for customizable sections to adapt to specific needs or to highlight particular cards or features effectively.


26 slides
Modern Company Profile Striped Presentation
Present your company with style, our modern company profile presentation, is the perfect template to showcase your business in a contemporary and stylish way. This template combines professionalism with a touch of flair and striped elements, making it ideal for modern businesses looking to make a lasting impression. Ideal for tech startups, creative agencies, or a professional service firms, this presentation will help you convey your company's professionalism. Fully customizable and compatible with Powerpoint, Keynote, and Google Slides. This makes it easy for potential clients, partners, and investors to reach out!


26 slides
Venture Capital Dark Presentation
Present your investment vision with confidence using our Venture Capital presentation template, ideal for PowerPoint, Keynote, and Google Slides. This template is expertly crafted for venture capitalists, startup founders, and financial advisors looking to create persuasive and engaging presentations that attract investment. Our Venture Capital template is designed to showcase the potential of innovative startups to savvy investors. It includes a range of slides that detail market analysis, growth potential, business strategies, and investment opportunities, all laid out in an easy-to-understand format. With this template, you can effectively communicate complex financial data and investment propositions through clear visuals and concise text. Featuring customizable charts, graphs, and diagrams, the template allows for a personalized touch, making it easier to highlight the unique selling points of investment opportunities. Whether you're presenting to angel investors, venture capital firms, or at a funding pitch, this template will help you to articulate your message with clarity and impact. Increase the visibility of your venture capital presentations with our SEO-optimized template and position yourself as a thought leader in the field of investment and startup growth.


8 slides
Health Metrics and Wellbeing Dashboard Presentation
Visualize patient insights with this dashboard-style layout combining human figures, progress bars, and anatomical icons. Ideal for healthcare data, wellness reporting, or gender-based analysis, it balances stats and storytelling effectively. Customize it easily in PowerPoint, Keynote, or Google Slides for your next health-focused presentation.


5 slides
Small Business Plan Presentation
The "Small Business Plan Presentation" template is designed to visually articulate the essential elements of a business strategy effectively. This infographic employs 3D block graphics in varied colors to denote different sections of a business plan, such as market analysis, operations, marketing strategies, and financial projections. Each block is labeled clearly, facilitating an easy understanding and discussion of each business aspect. Ideal for entrepreneurs and small business owners, this template aids in presenting complex information in a straightforward, organized format during meetings with stakeholders or potential investors, ensuring key points are communicated clearly and professionally.


7 slides
Roadmap Infographic Presentation Template
A Roadmap Infographic is a visual representation of a plan or strategy for achieving a specific goal or set of goals. It includes a timeline and a series of steps or milestones that need to be accomplished in order to reach the final destination. This template is perfect for showing your plan or strategy in a fun and interactive way. This template includes lots of photo layouts and different types of charts that you can customize with your own information. Use this roadmap infographic template to show the progress of a project, the steps in a process, or the timeline for a product launch.


8 slides
Geographic Heat Map Analysis Presentation
Bring your data to life with a vibrant map that instantly reveals regional patterns and performance differences. Ideal for presenting location-based insights, sales metrics, or demographic trends, this presentation combines clarity with visual impact. Fully compatible with PowerPoint, Keynote, and Google Slides for easy editing and professional results.


10 slides
Startup Pitch Deck Presentation
Make your big idea impossible to ignore with a sleek, investor-ready design that tells your startup’s story with clarity and confidence. This presentation helps you outline your vision, market potential, and business strategy in a compelling way. Fully compatible with PowerPoint, Keynote, and Google Slides for effortless customization.


5 slides
Responsibility Assignment Using RACI Model Presentation
Visualize role clarity with the Responsibility Assignment Using RACI Model Presentation. This template helps define team responsibilities across four key roles—Responsible, Accountable, Consulted, and Informed—in a simple and clean radial layout. Ideal for aligning teams, assigning tasks, and preventing confusion. Fully customizable in PowerPoint, Canva, and Google Slides.


5 slides
Project Risk Management Framework Presentation
Visualize challenges before they arise with this dynamic framework designed to map, assess, and mitigate project risks efficiently. Its circular layout highlights every critical stage, helping you communicate strategies clearly and professionally. Fully editable and compatible with PowerPoint, Keynote, and Google Slides for effortless customization and presentation flexibility.


6 slides
Creative Solutions for Business Challenges Presentation
Present your strategy with impact using the Creative Solutions for Business Challenges Presentation. Featuring a dynamic cloud and gear diagram, this layout helps illustrate interconnected solutions and innovative thinking. Ideal for brainstorming, strategic planning, and team problem-solving discussions. Fully editable in PowerPoint, Keynote, and Google Slides.


8 slides
International Marketing Infographic
International Marketing refers to the strategies and activities undertaken by businesses to promote and sell their products or services in markets outside of their home country. This infographic template highlights key aspects of international marketing strategies and best practices. It is designed to help businesses understand the complexities and opportunities of marketing products or services in global markets. This provides an overview of international marketing concepts and strategies. Compatible with Powerpoint, Keynote, and Google Slides. This template is suitable for businesses aiming to expand their reach and succeed in the global marketplace.


20 slides
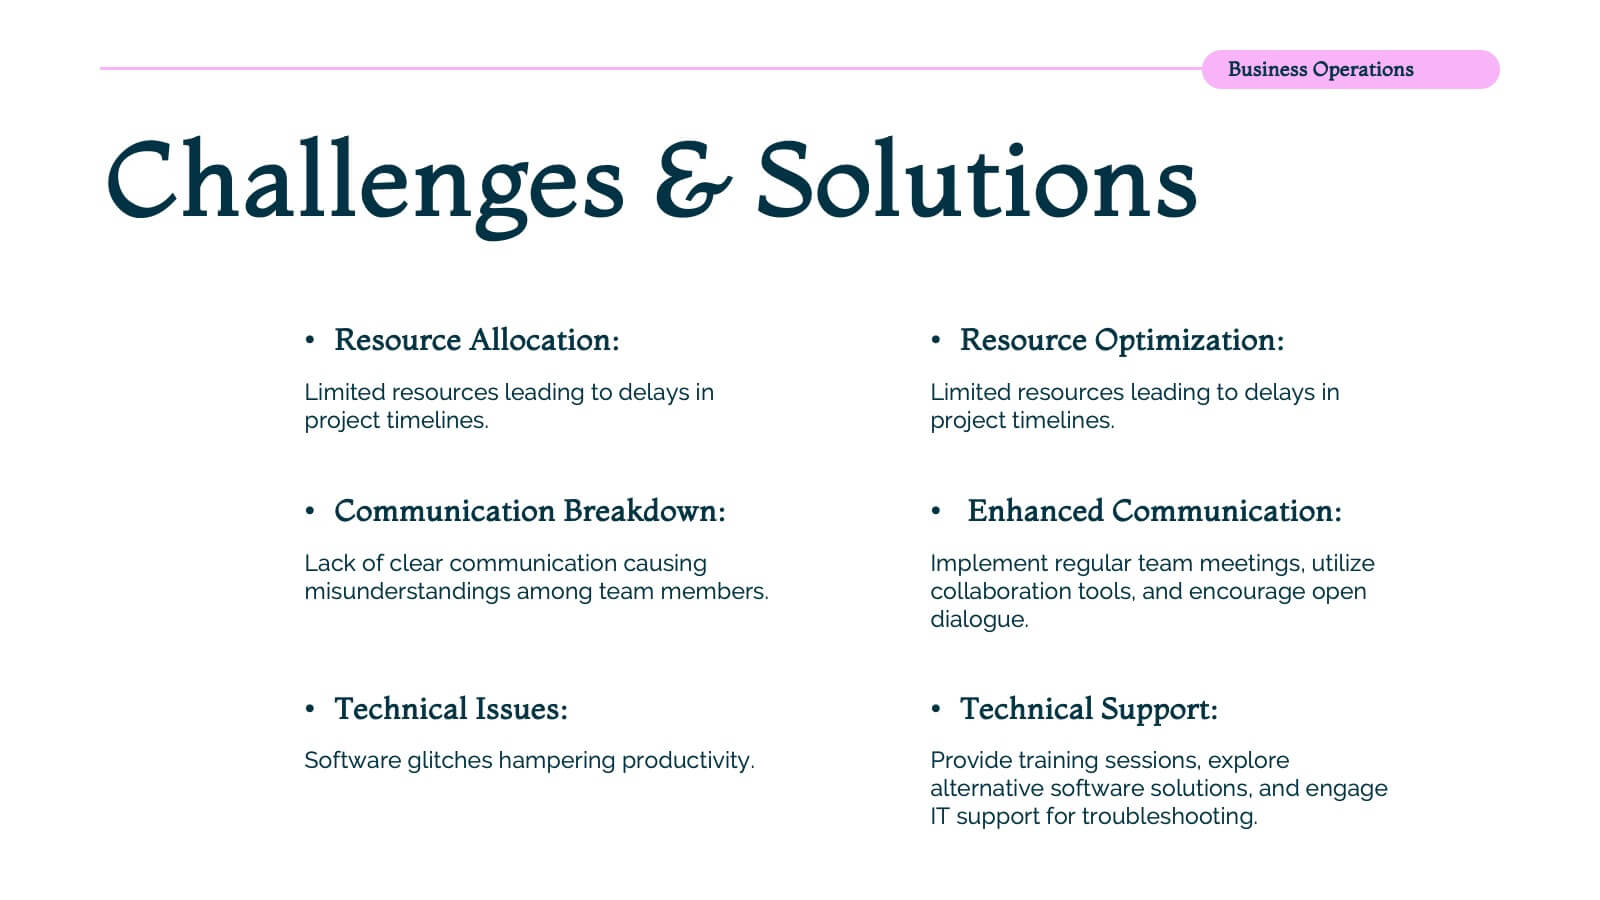
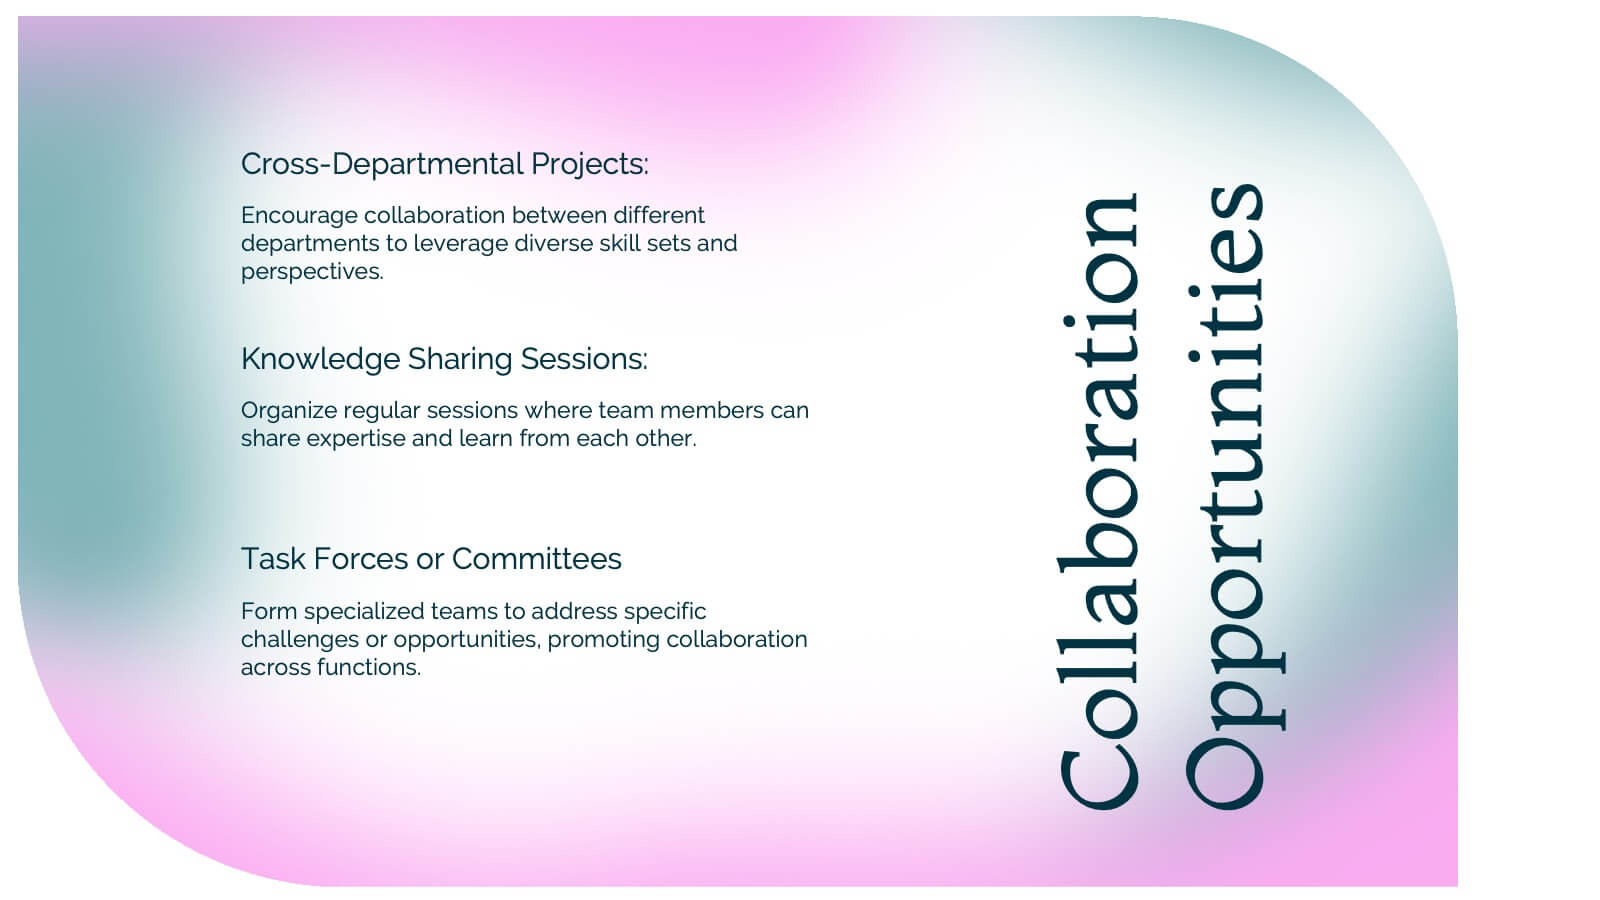
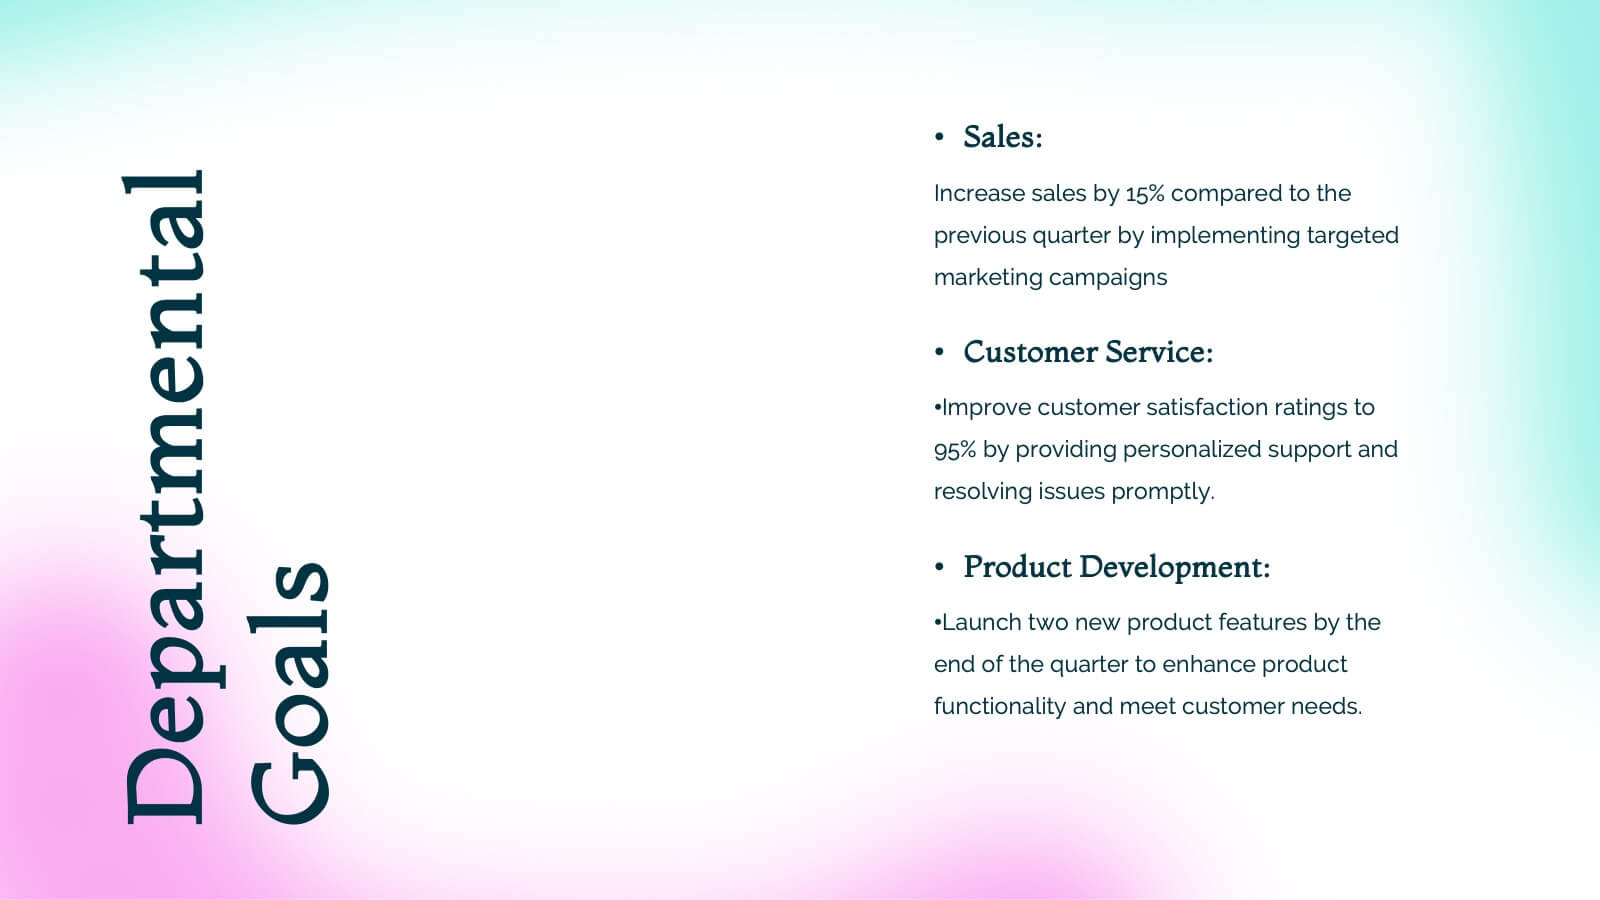
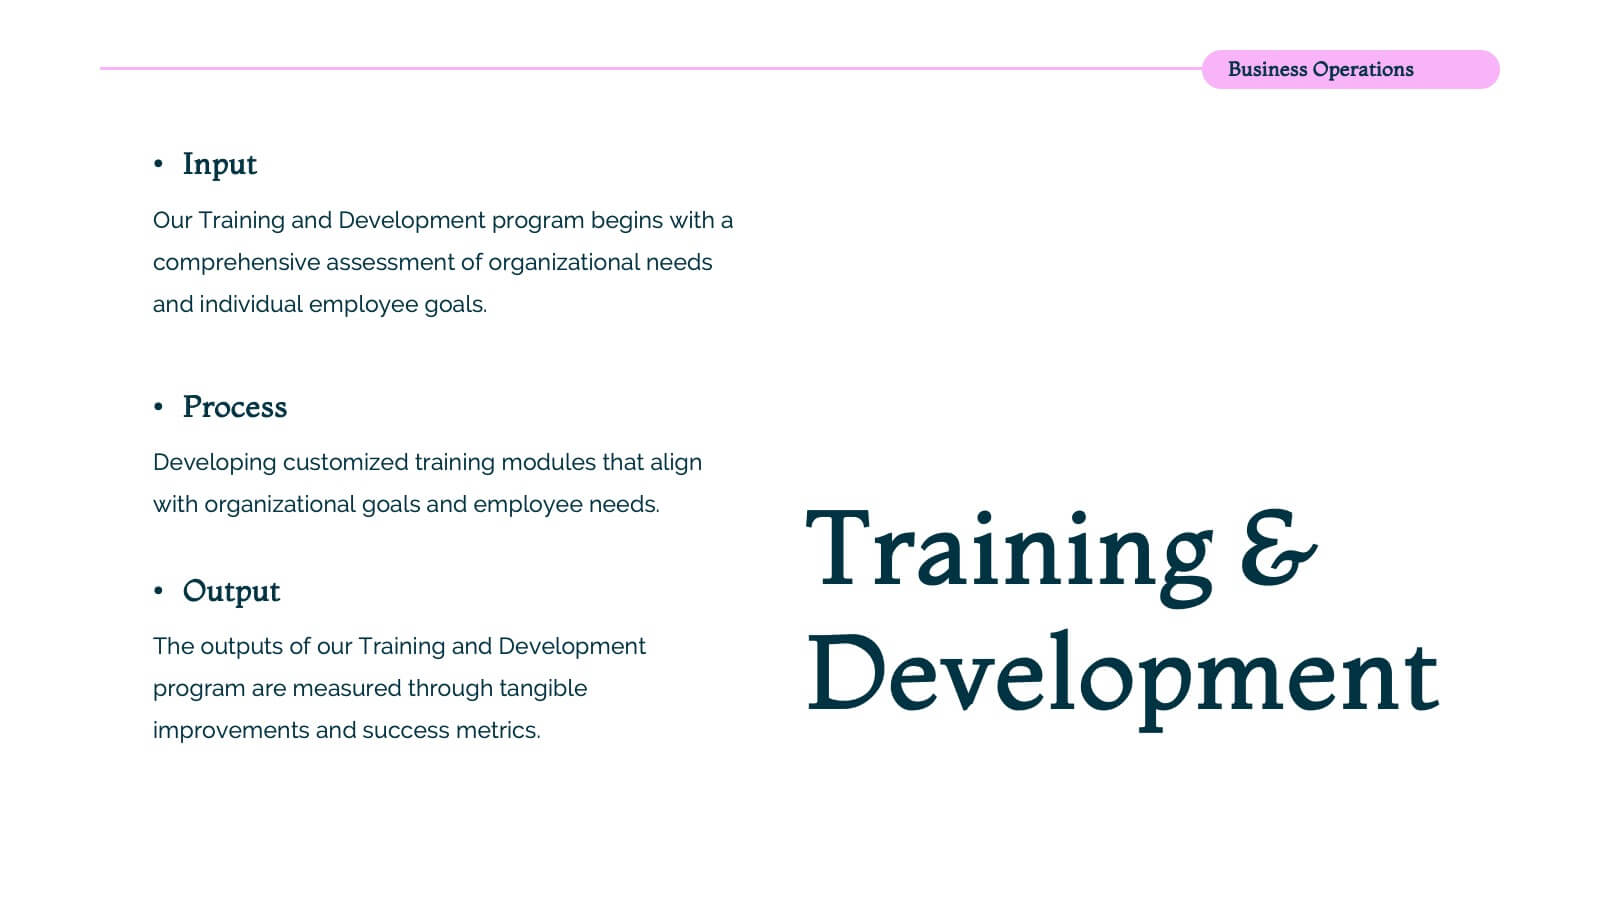
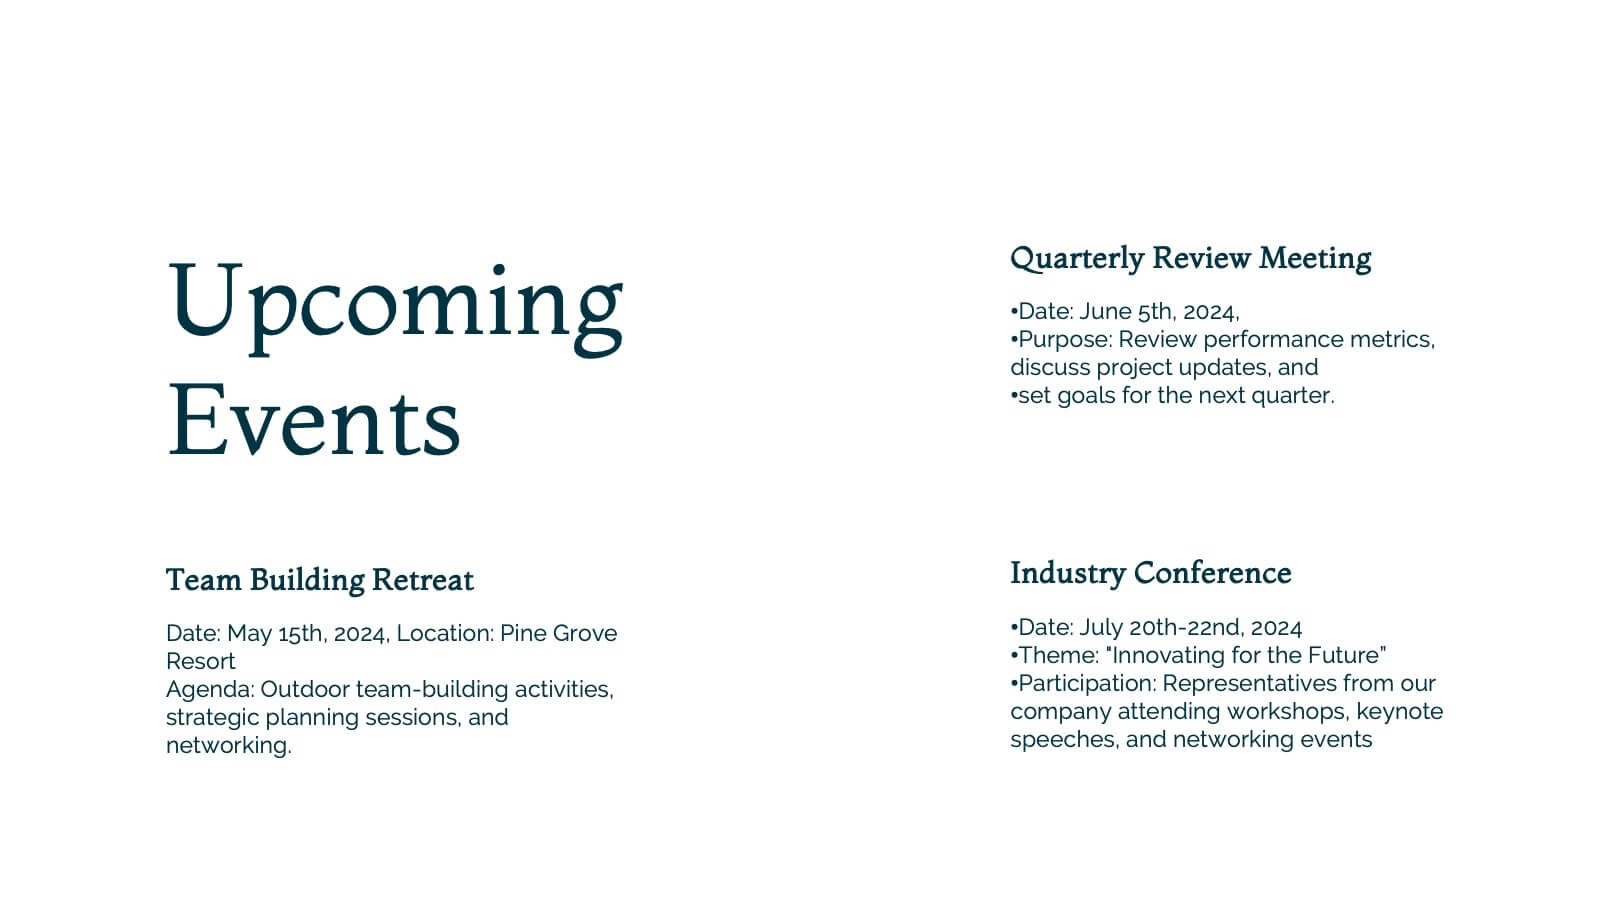
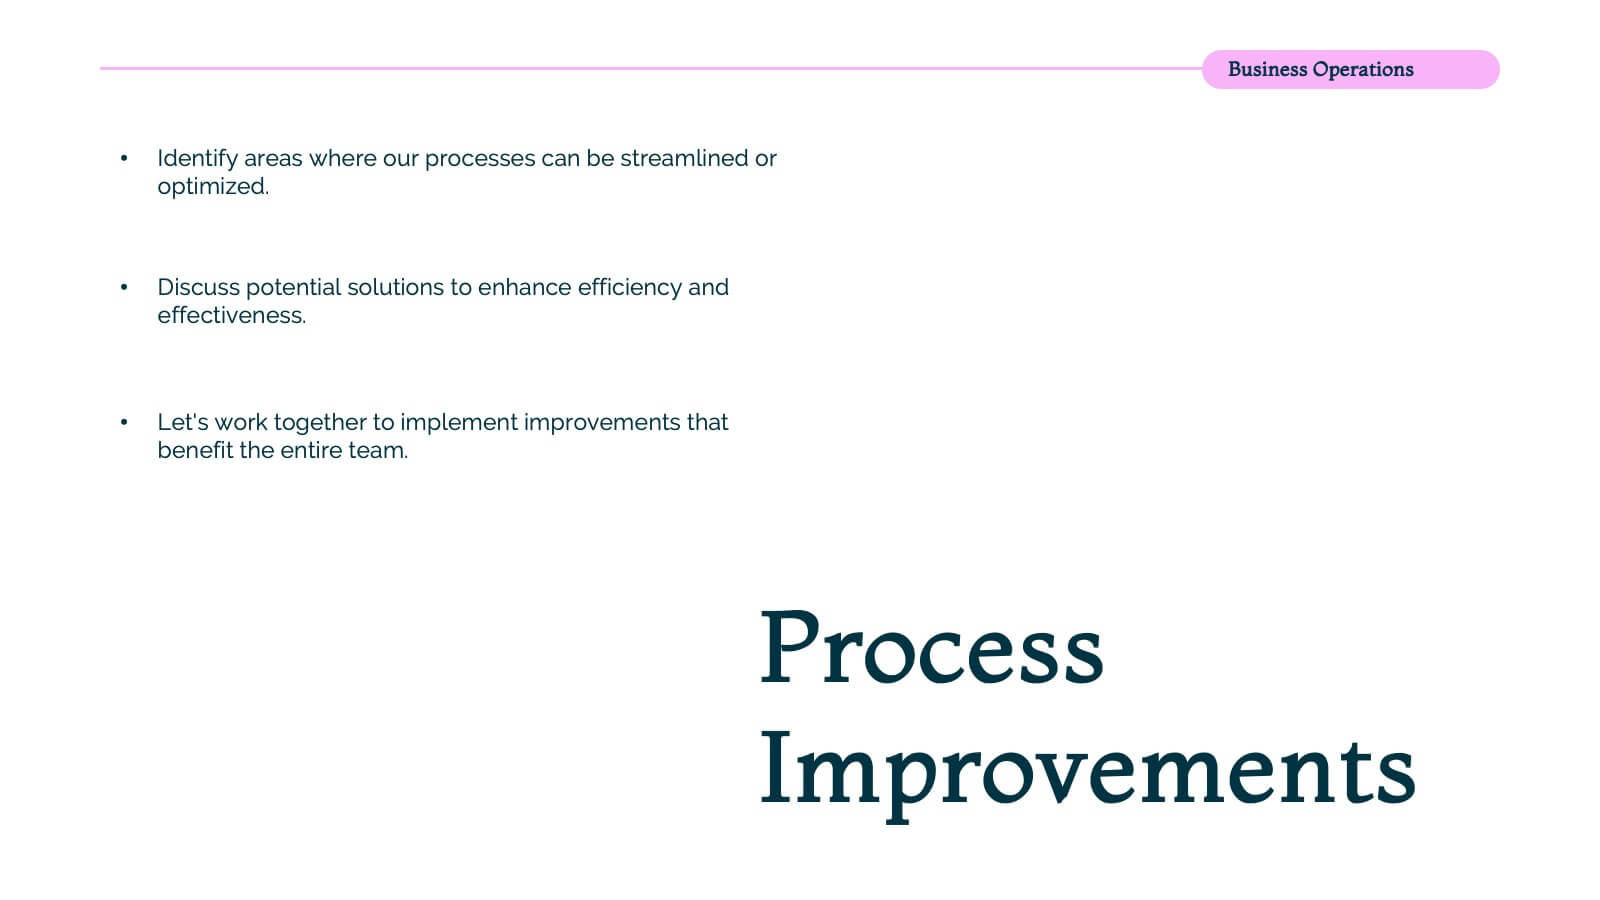
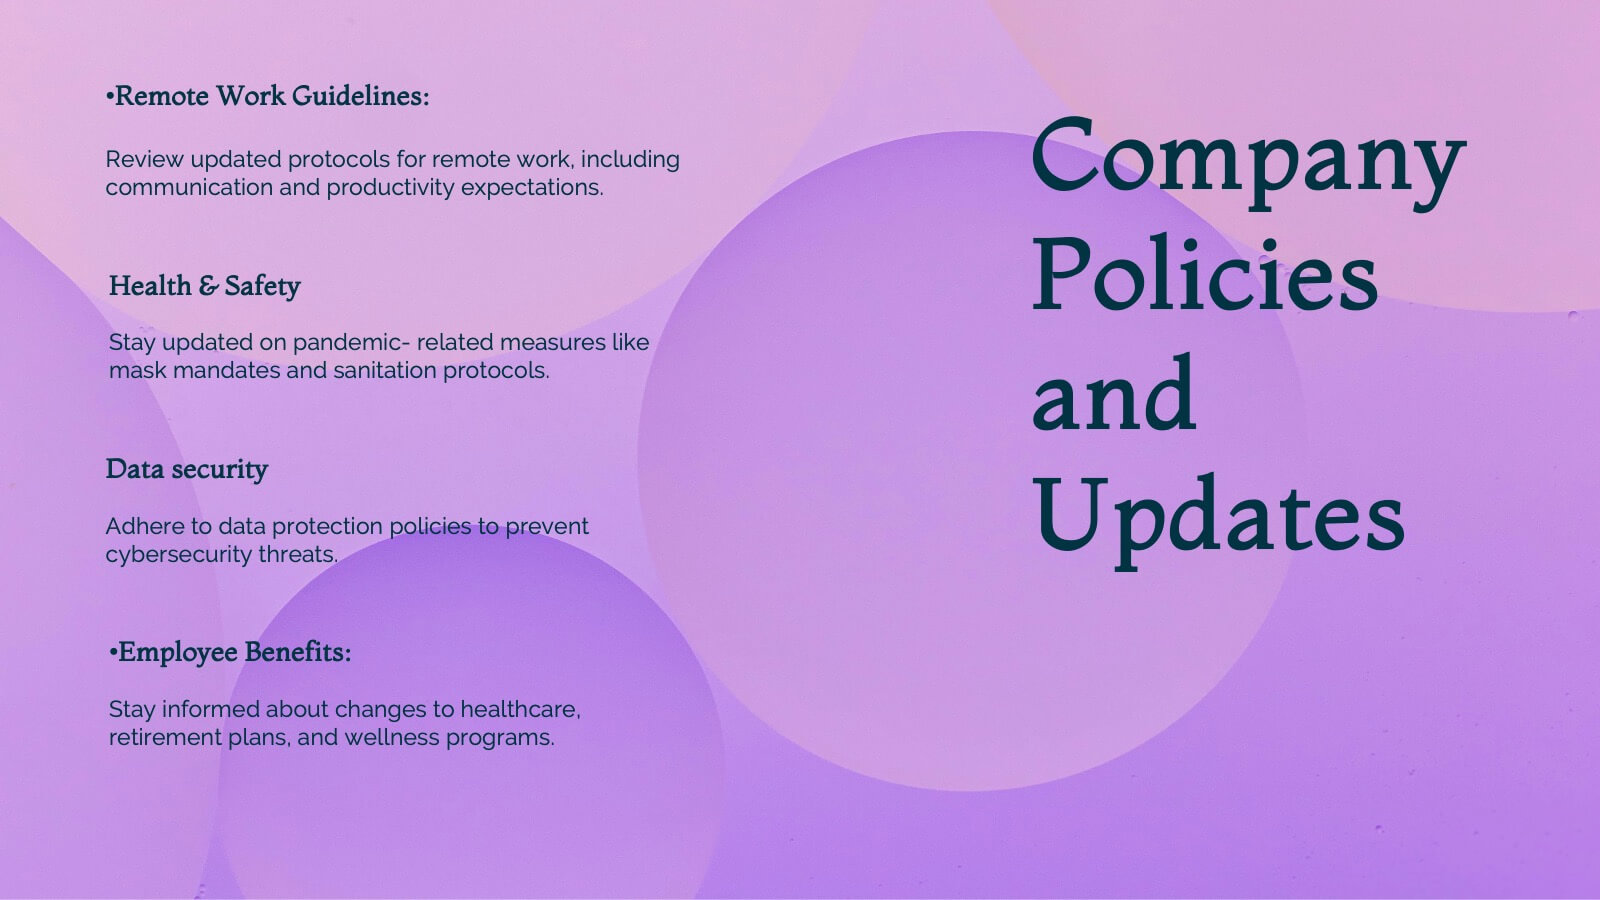
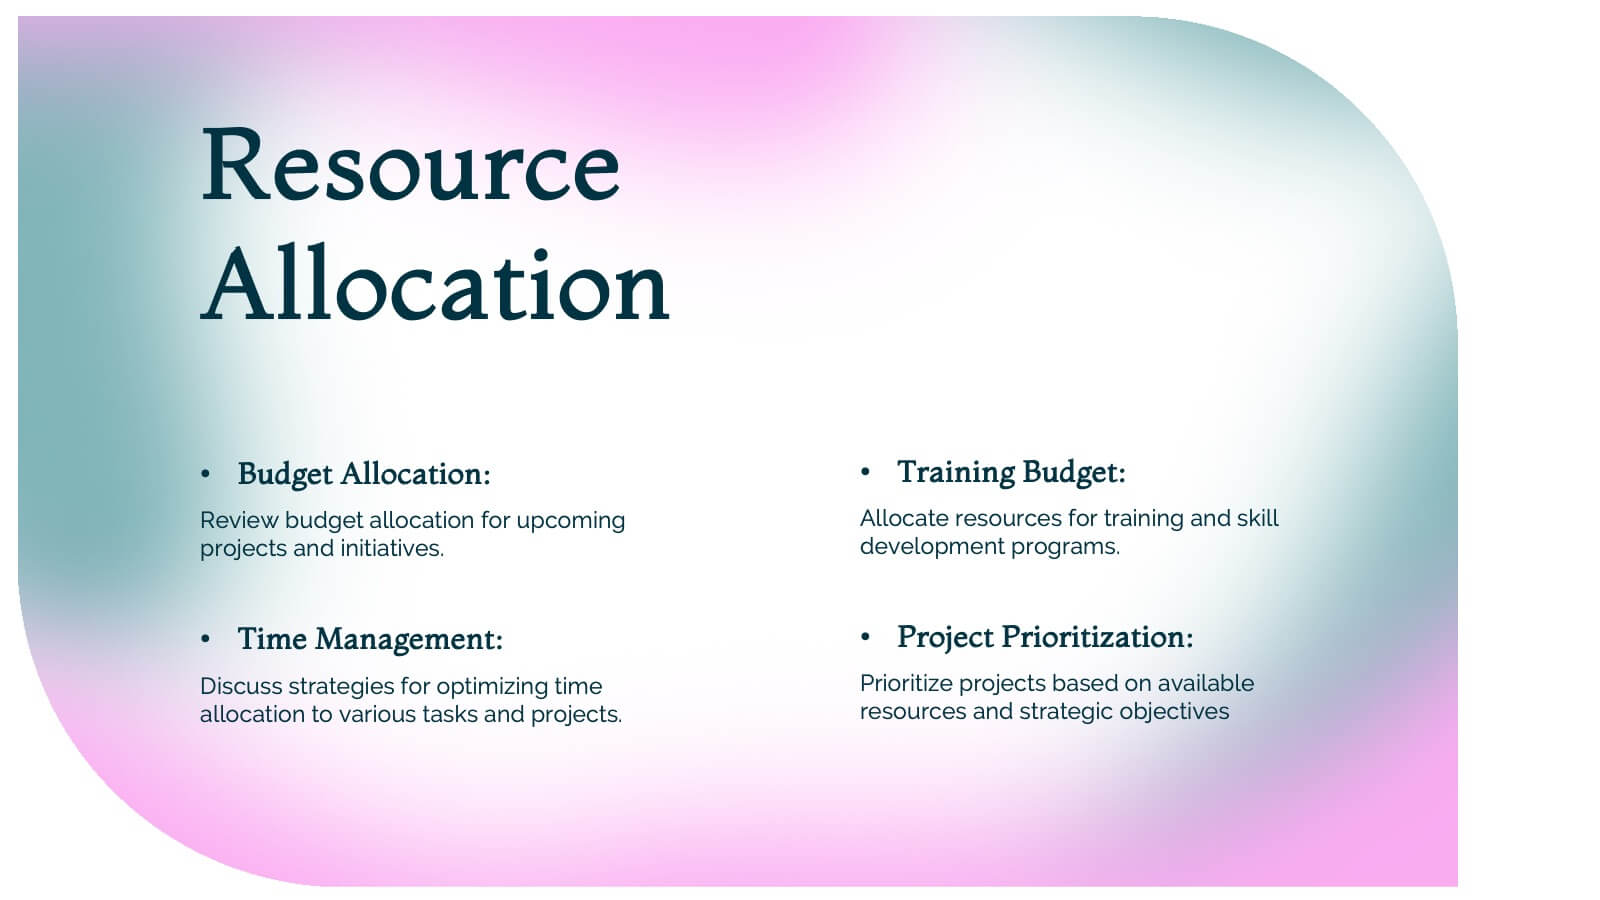
Nova Business Operations Plan Presentation
Create a polished business operations plan with this modern and organized template! It covers everything from team updates and project overviews to resource allocation and collaboration opportunities. Perfect for structuring departmental goals, process improvements, and employee recognition. Compatible with PowerPoint, Keynote, and Google Slides for a seamless, professional presentation.


5 slides
Teaching Strategy for Classrooms Presentation
Make classroom planning more engaging with the Teaching Strategy for Classrooms Presentation. This stacked book-style layout is ideal for outlining instructional steps, lesson phases, or teaching priorities. Perfect for teachers, education trainers, or curriculum planners. Fully editable in PowerPoint, Keynote, Canva, and Google Slides.