


Features
- 20 Unique Slides
- Fully editable and easy to edit in Microsoft Powerpoint, Keynote and Google Slides
- 16:9 widescreen layout
- Clean and professional designs
- Export to JPG, PDF or send by email


Do you have any questions?
Recommend


5 slides
Dual Axis Butterfly Diagram Presentation
Give your data the spotlight it deserves with a modern layout designed for clarity and balance. This presentation is perfect for comparing two perspectives, processes, or variables side by side in a visually appealing way. Fully customizable and compatible with PowerPoint, Keynote, and Google Slides.


6 slides
Business Plan Next Steps Presentation
Map out your strategy with the Business Plan Next Steps Presentation template. This visually structured layout helps outline key actions, milestones, and priorities for business growth and execution. Ideal for entrepreneurs, executives, and project managers, this slide ensures clarity and alignment on upcoming initiatives. Fully customizable in PowerPoint, Keynote, and Google Slides for easy integration into your planning process.


23 slides
Staccato Business Plan Presentation
Present your business plan with this elegant and structured template, designed for clarity and professionalism. This presentation layout provides all the essential elements for showcasing your strategy, goals, and objectives, ideal for entrepreneurs, startups, and established businesses alike. Featuring dedicated sections for company overview, panel discussions, workshop sessions, and closing remarks, the slides are organized for seamless storytelling. Highlight your team, workshop takeaways, and key resources with polished visuals and easy-to-follow layouts. The Q&A and networking break slides allow you to engage your audience effectively while maintaining a professional tone. Fully compatible with PowerPoint, Google Slides, and Keynote, this template is fully editable, allowing you to customize colors, text, and images to reflect your brand. Deliver your business ideas confidently with a presentation template that ensures a strong, lasting impression.


26 slides
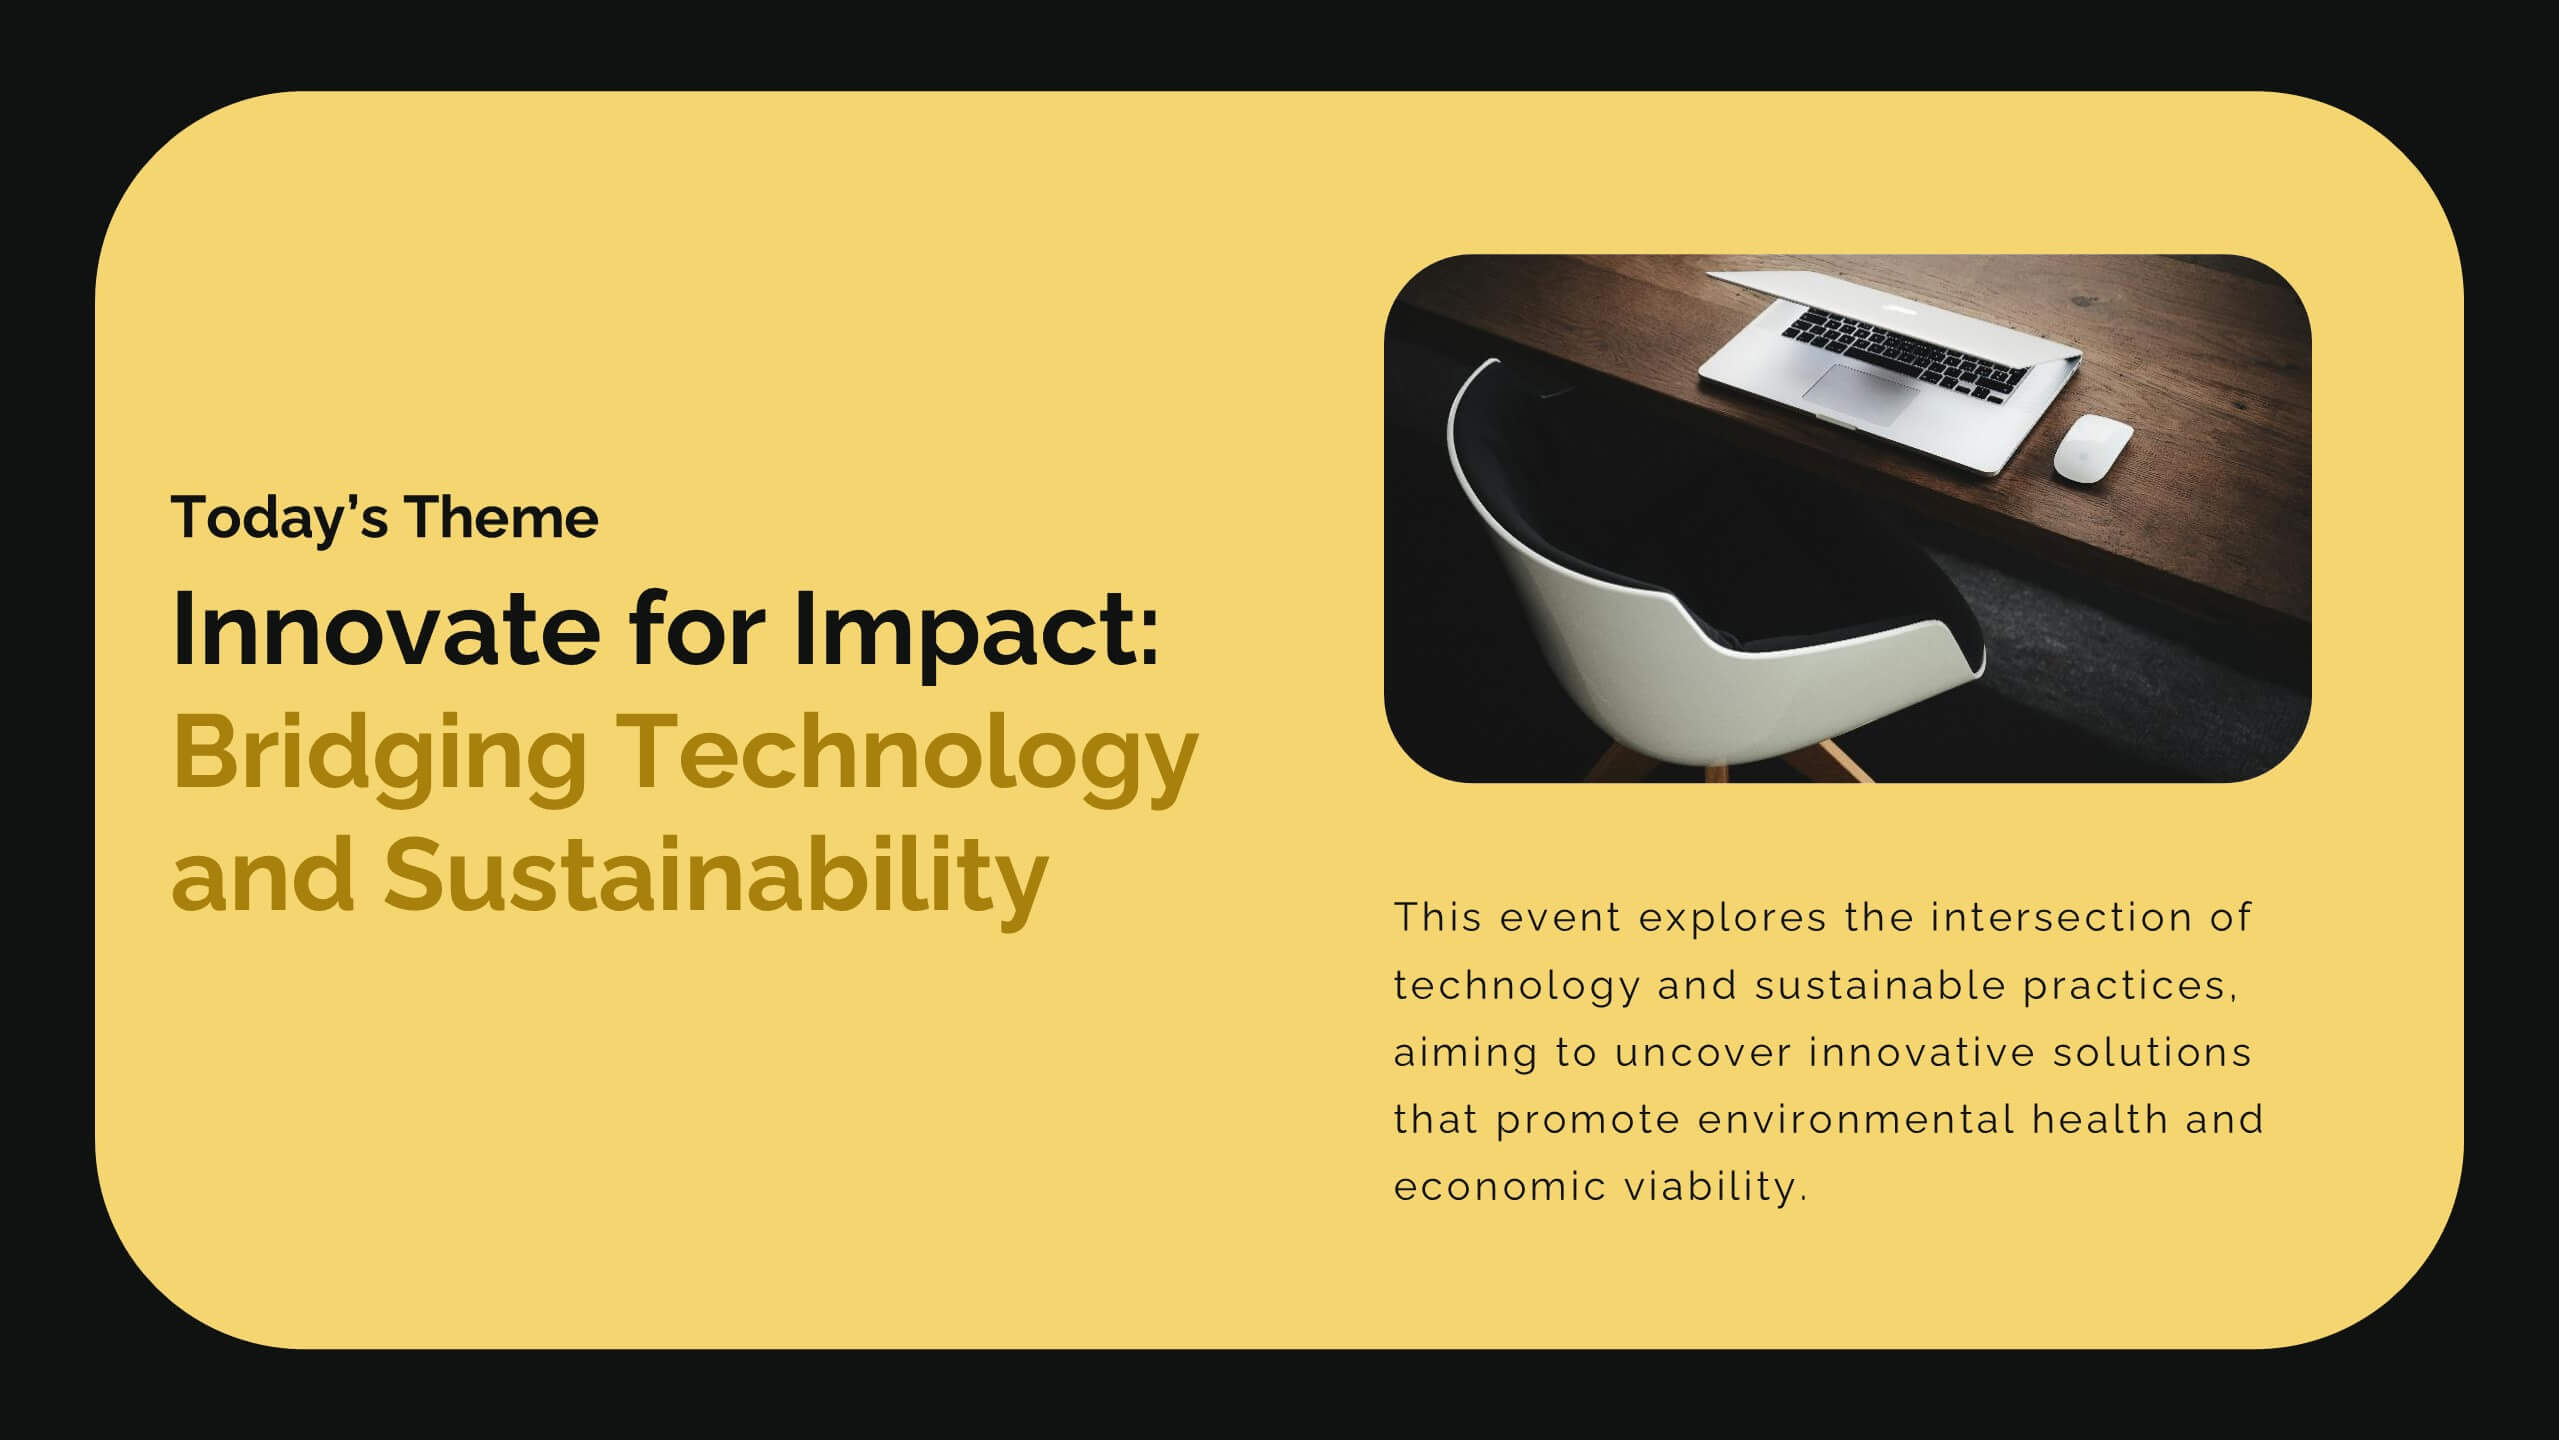
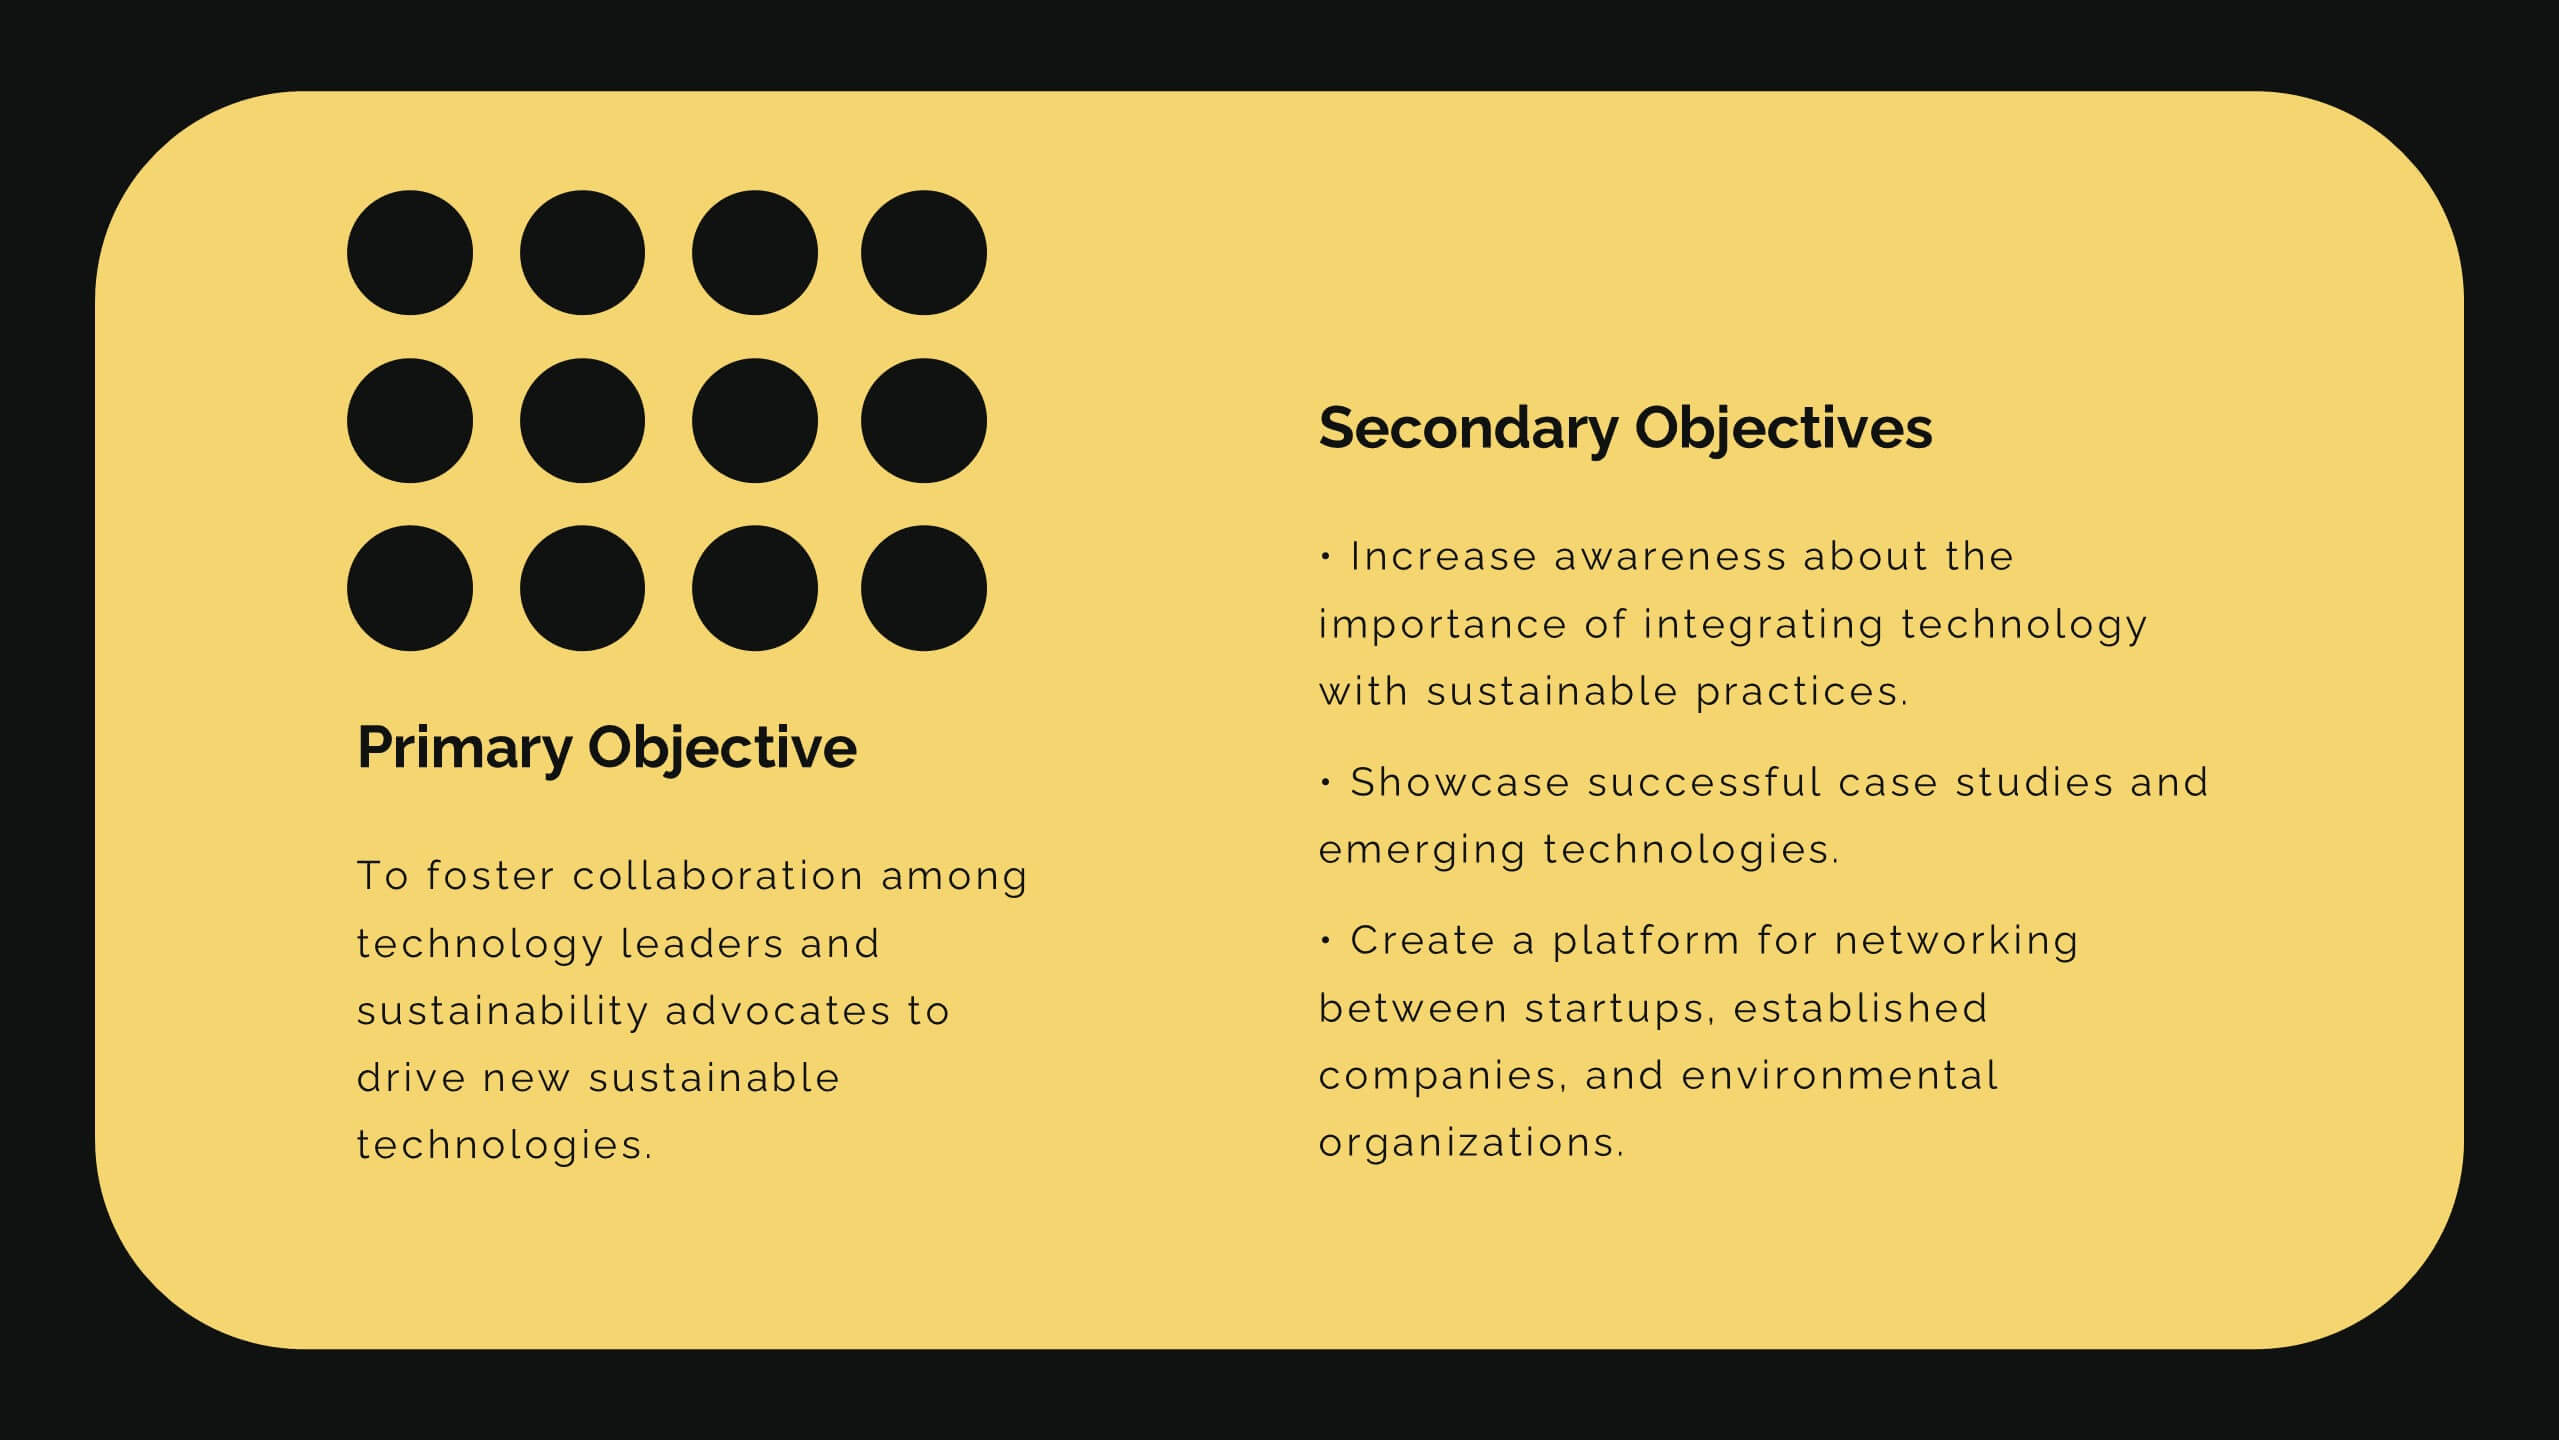
Soren Presentation Template
Soren is a cool, clean, simple easy to use template. This beautiful template is great for all types of businesses and creative projects. The colors are bold and simple to capture the audience needs. Soren is a multipurpose theme that can be used to capture the attention of your clients in a friendly, unique way. This template is a minimalistic design to attract your customers. The simple text, charts and tables make it easy to customize this template to match your brand. Whether you’re in need of a business presentation, newsletter or even social media posts – Soren is the perfect fit for you.


6 slides
Best Solution Proposal Presentation
Present your ideas with clarity and confidence using this modern, structured layout that highlights problems, opportunities, and proposed solutions step by step. Ideal for showcasing strategies or business improvements, it keeps information organized and persuasive. Fully compatible with PowerPoint, Keynote, and Google Slides for effortless customization and presentation.


21 slides
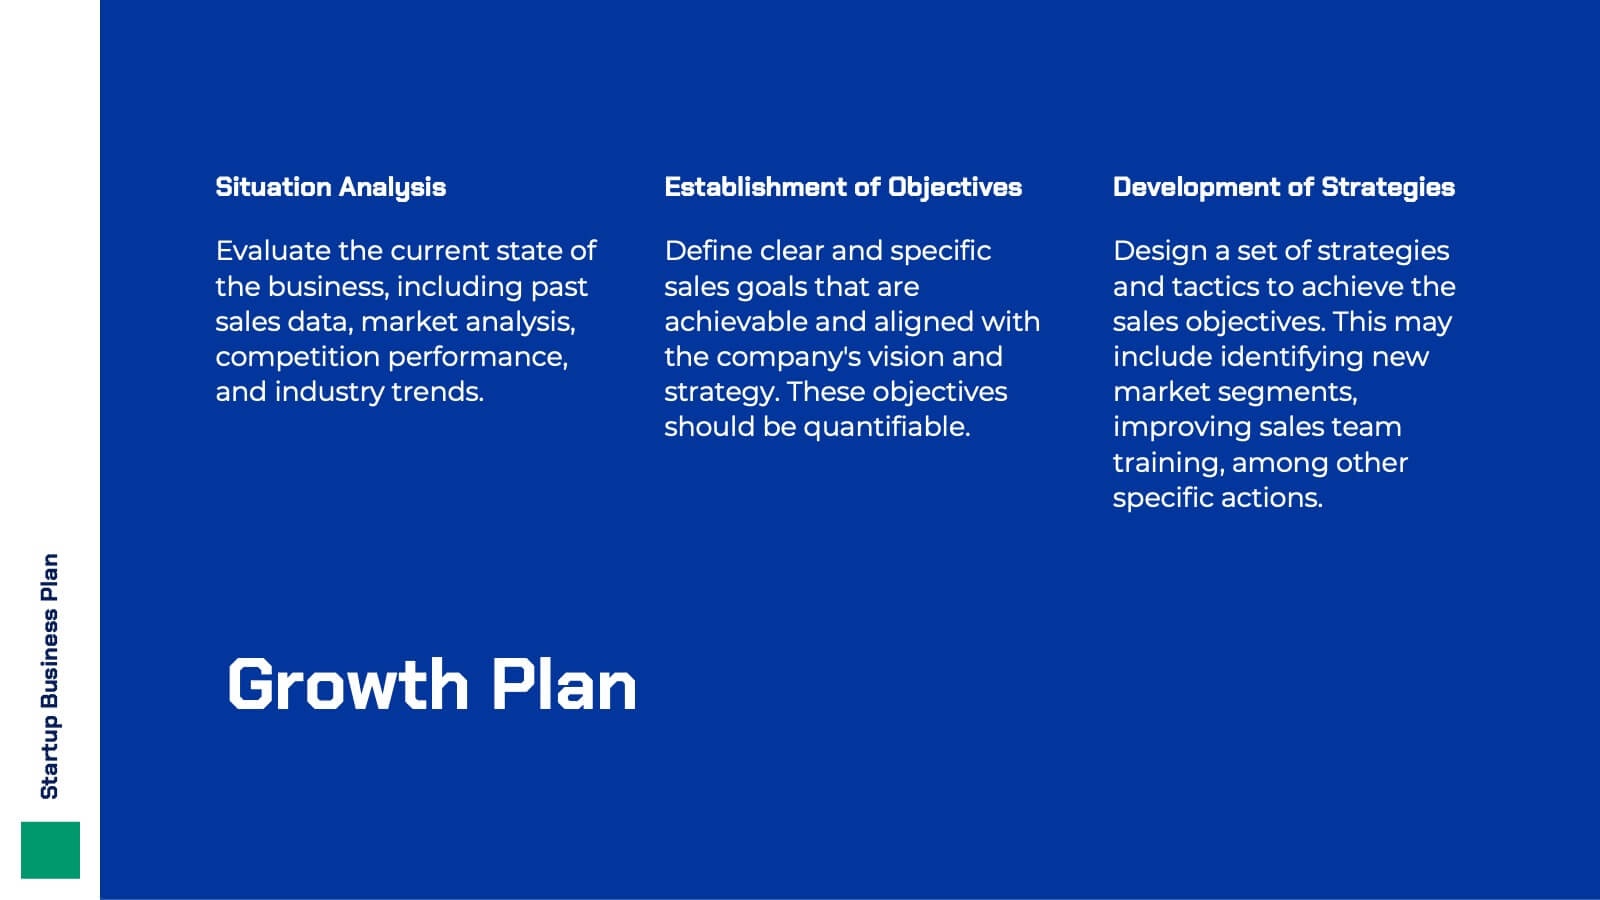
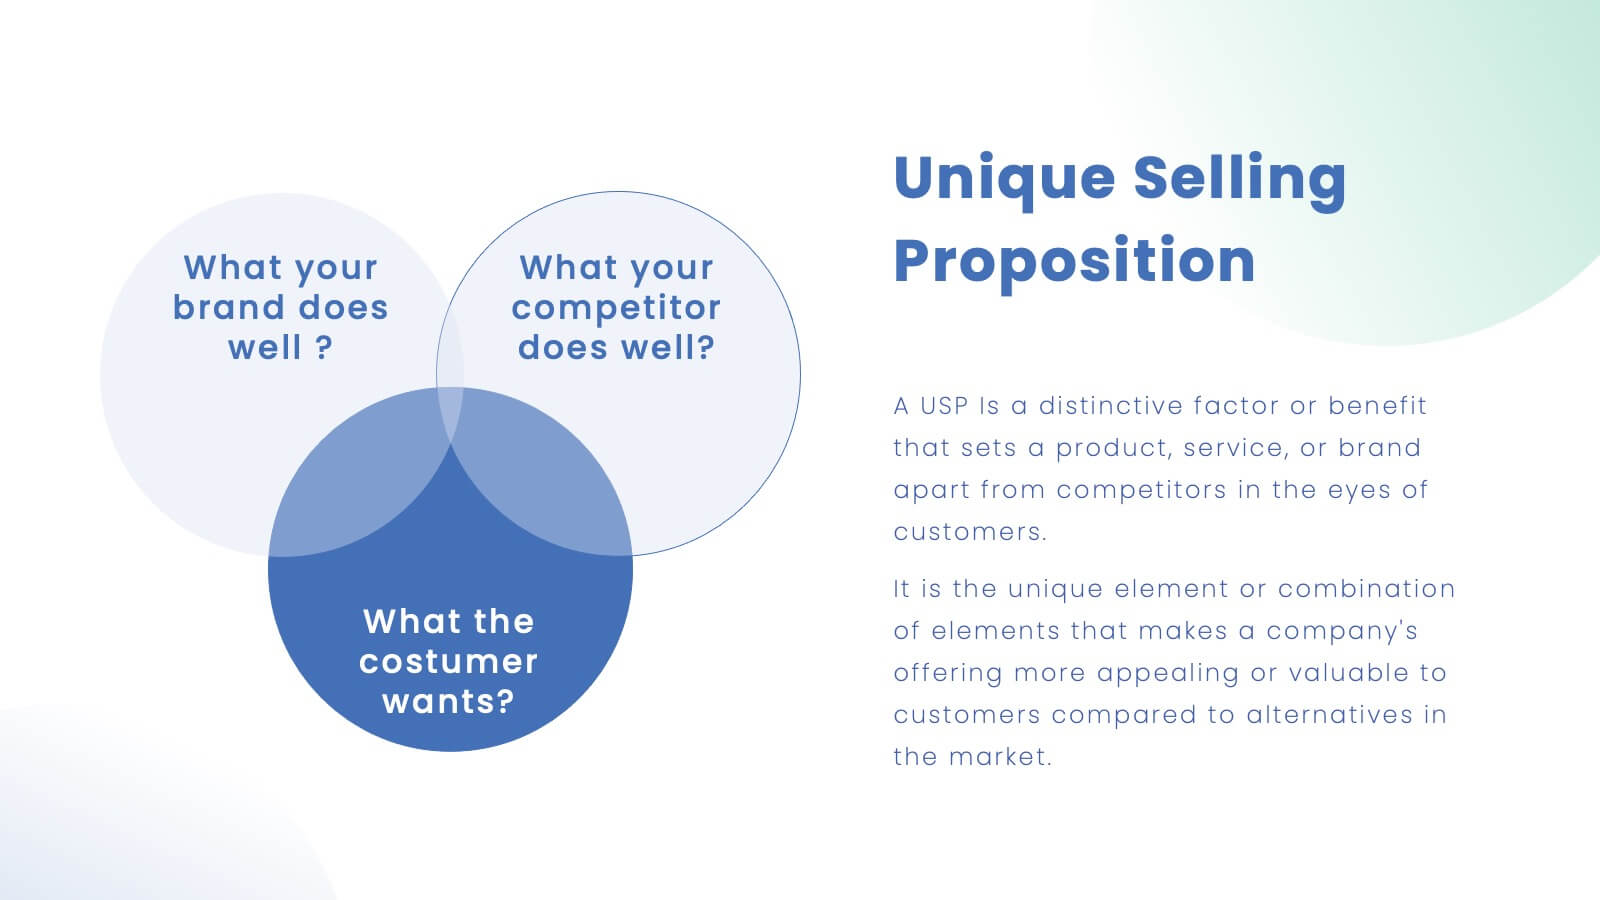
Hyperluma Startup Business Plan Presentation
Launch your vision with this startup business plan template, crafted to communicate your mission, market potential, and growth strategy with clarity and impact. Covering customer needs, unique value propositions, and financial projections, it’s ideal for entrepreneurs and founders. This template is compatible with PowerPoint, Keynote, and Google Slides, ready to fuel your startup’s journey.


23 slides
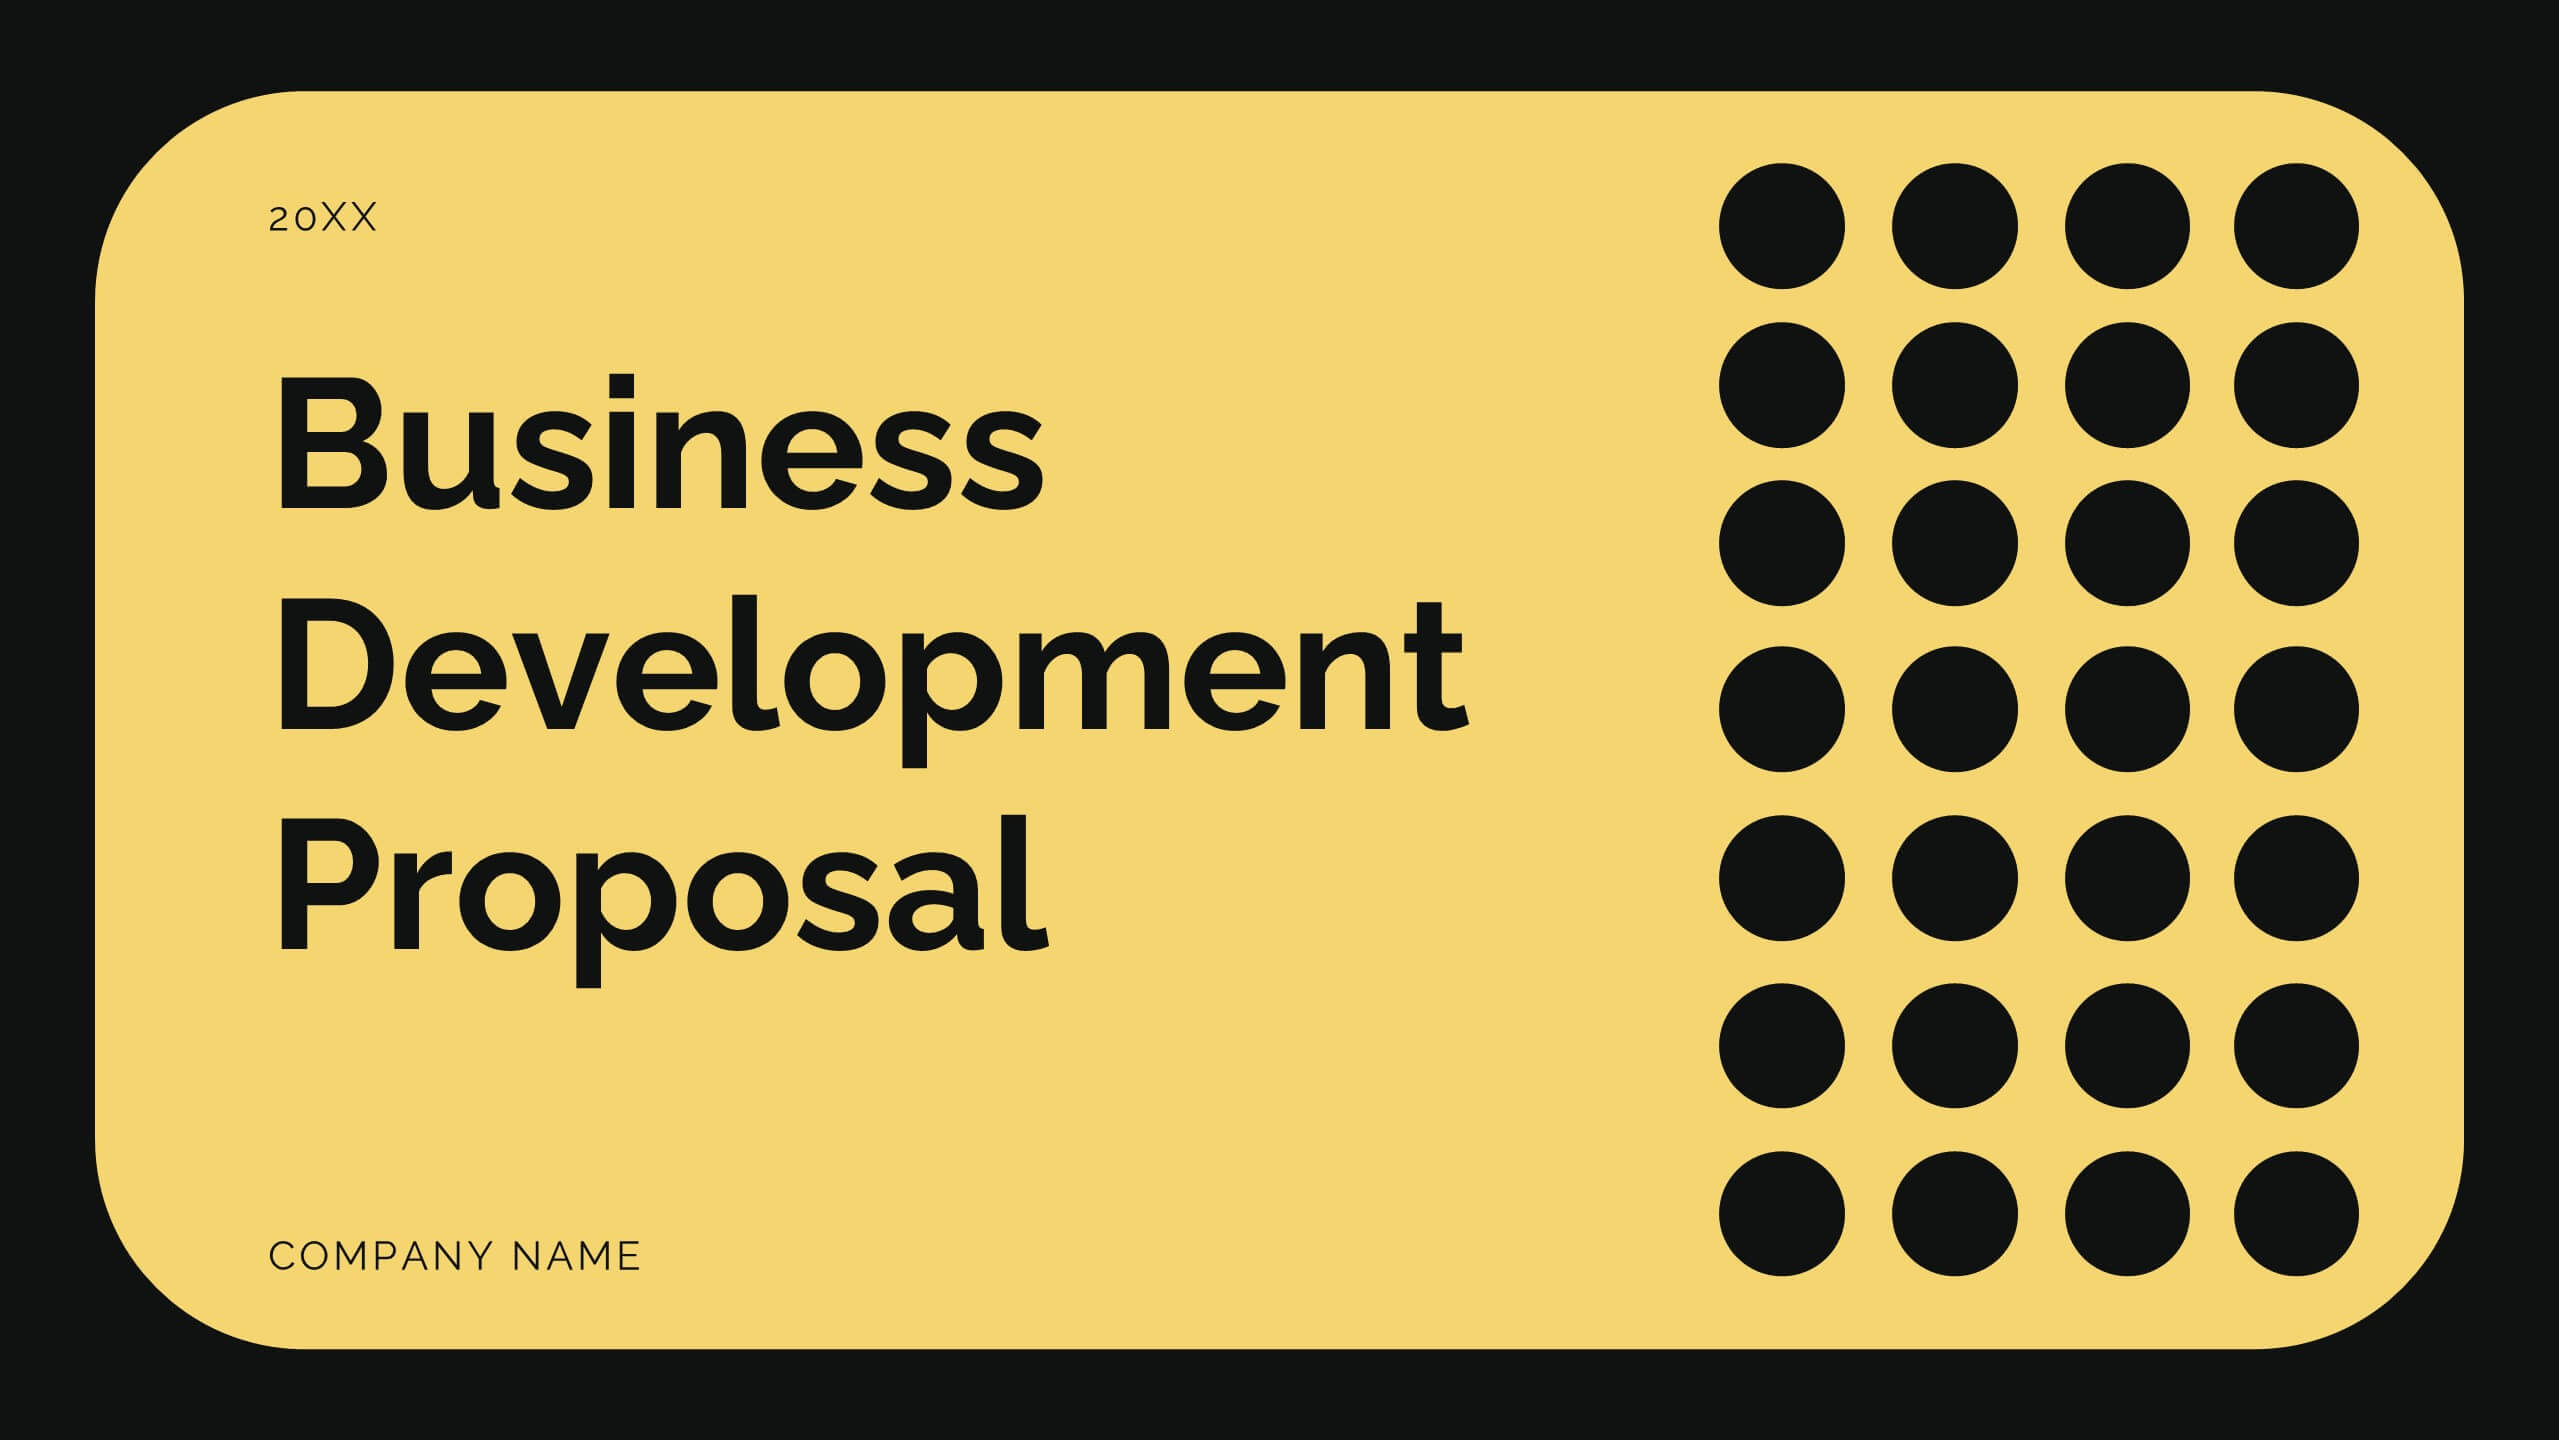
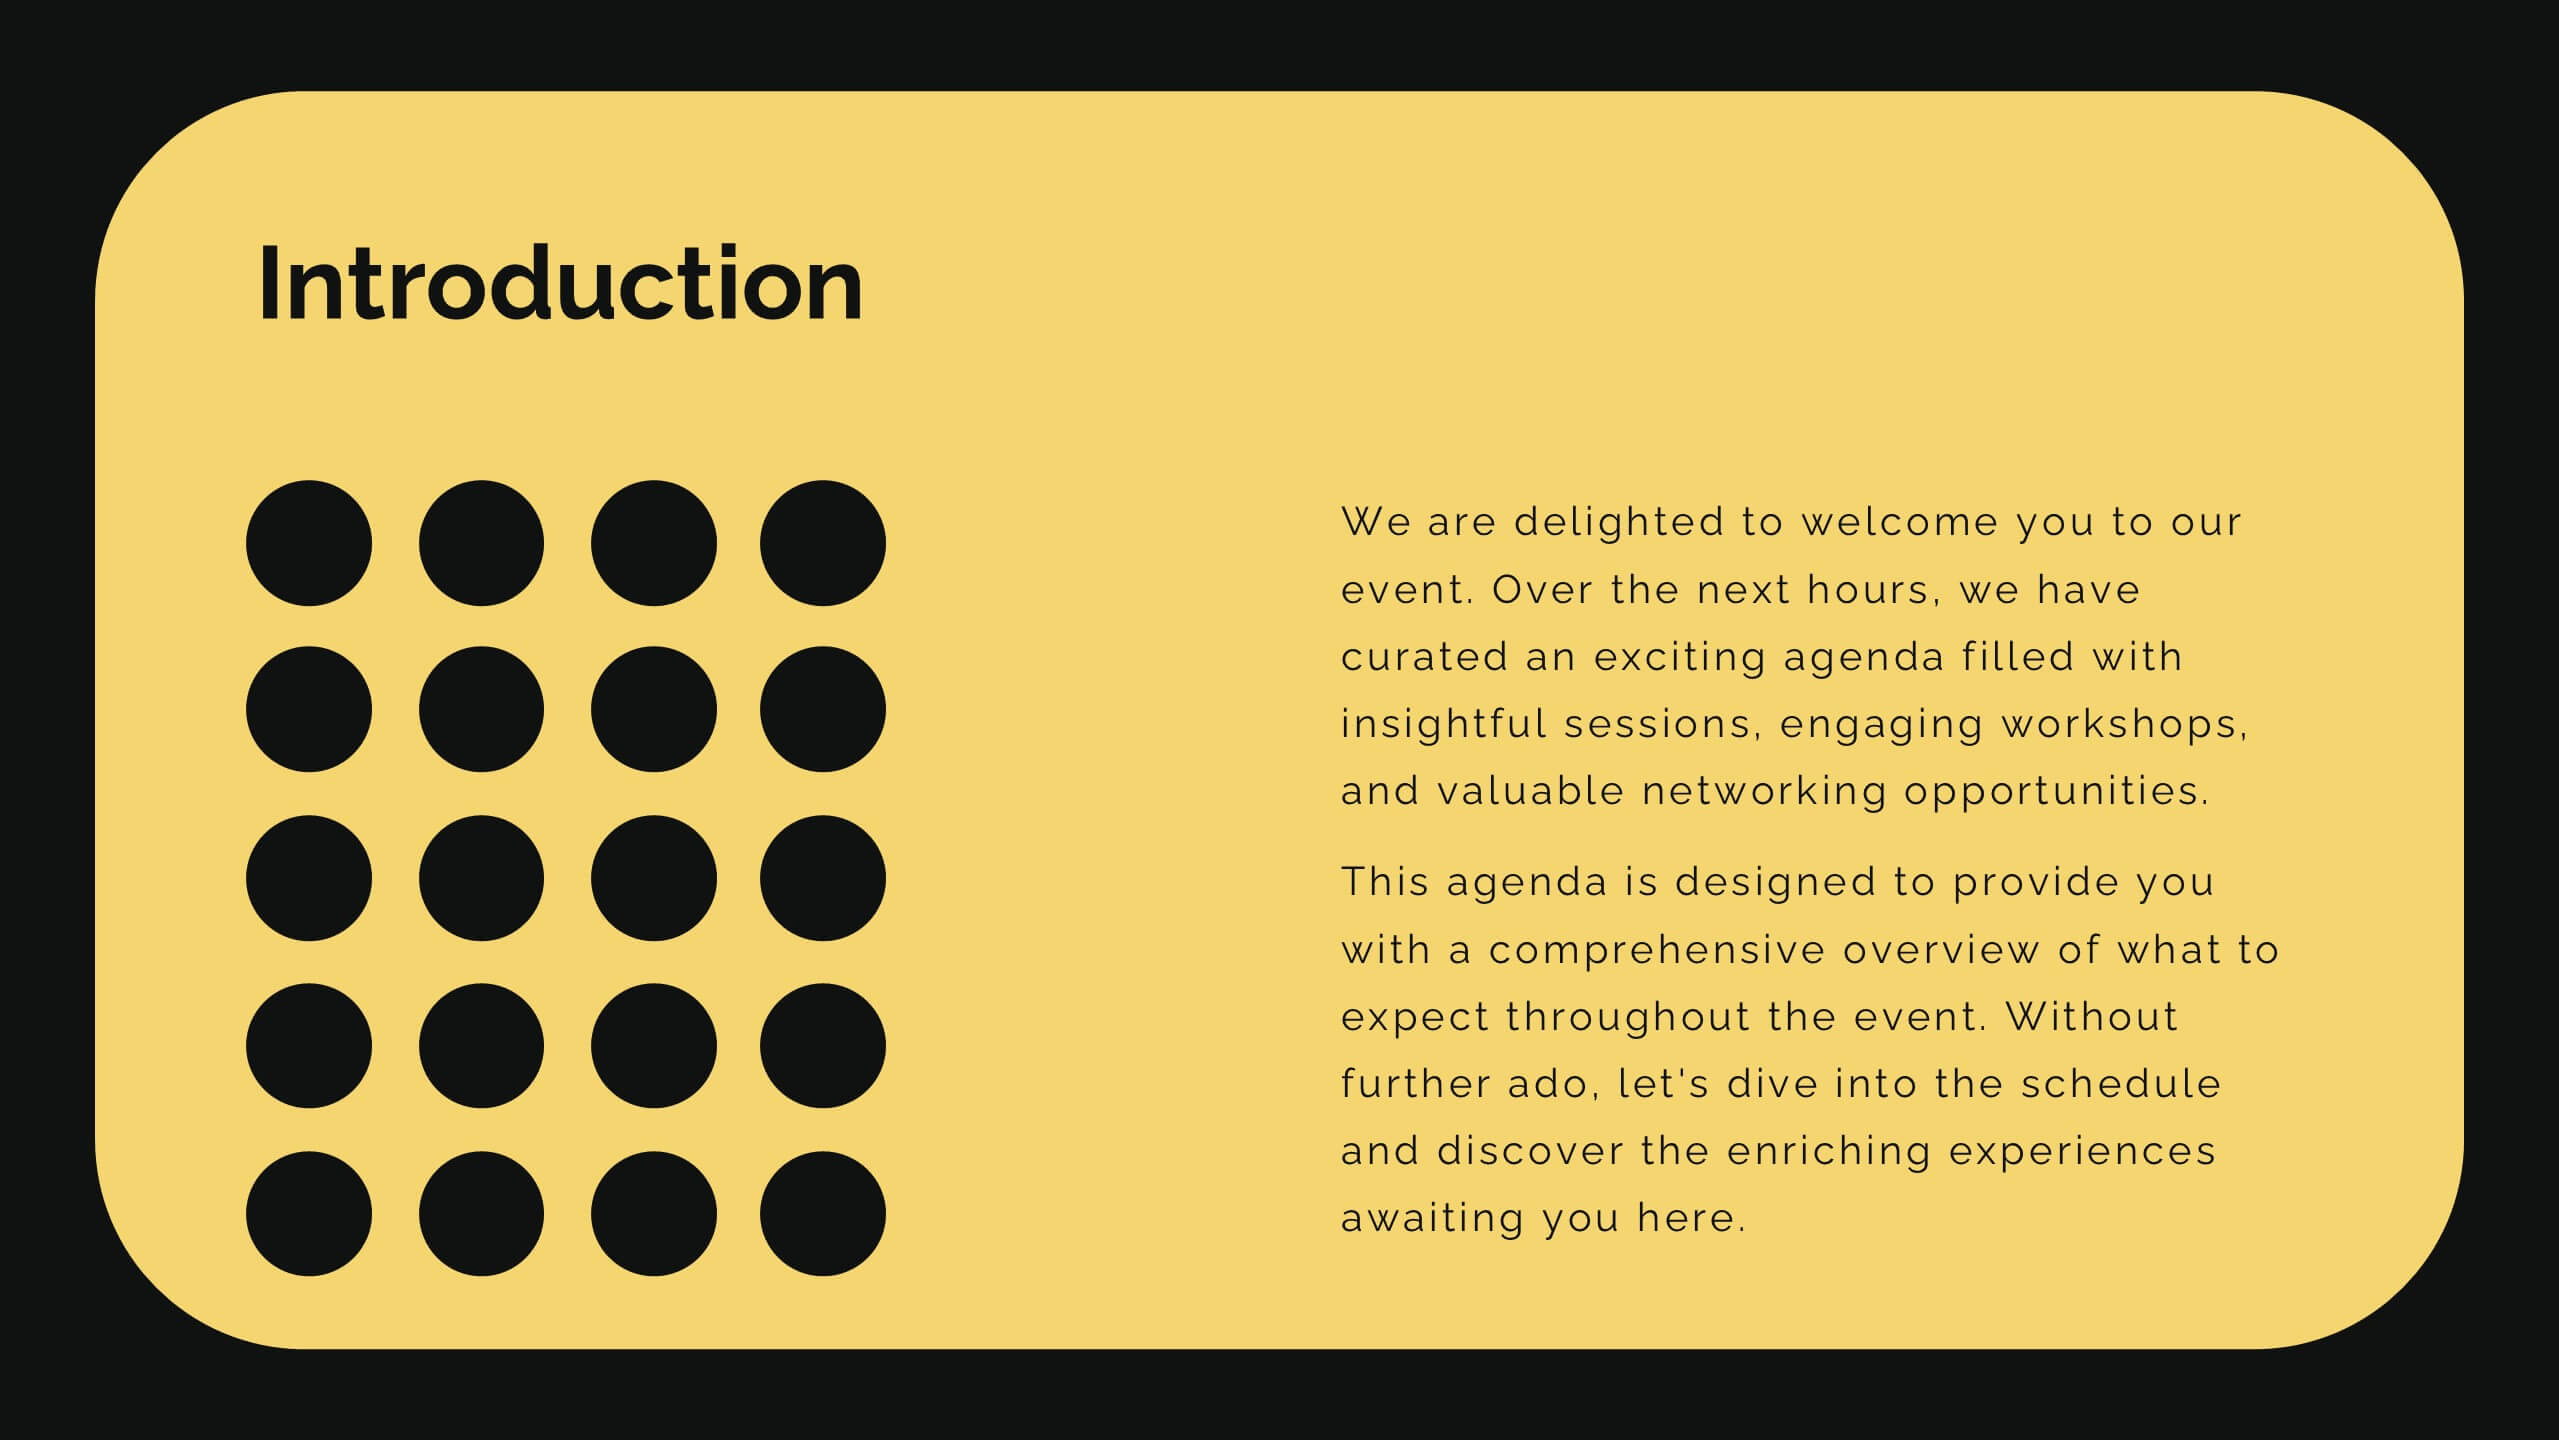
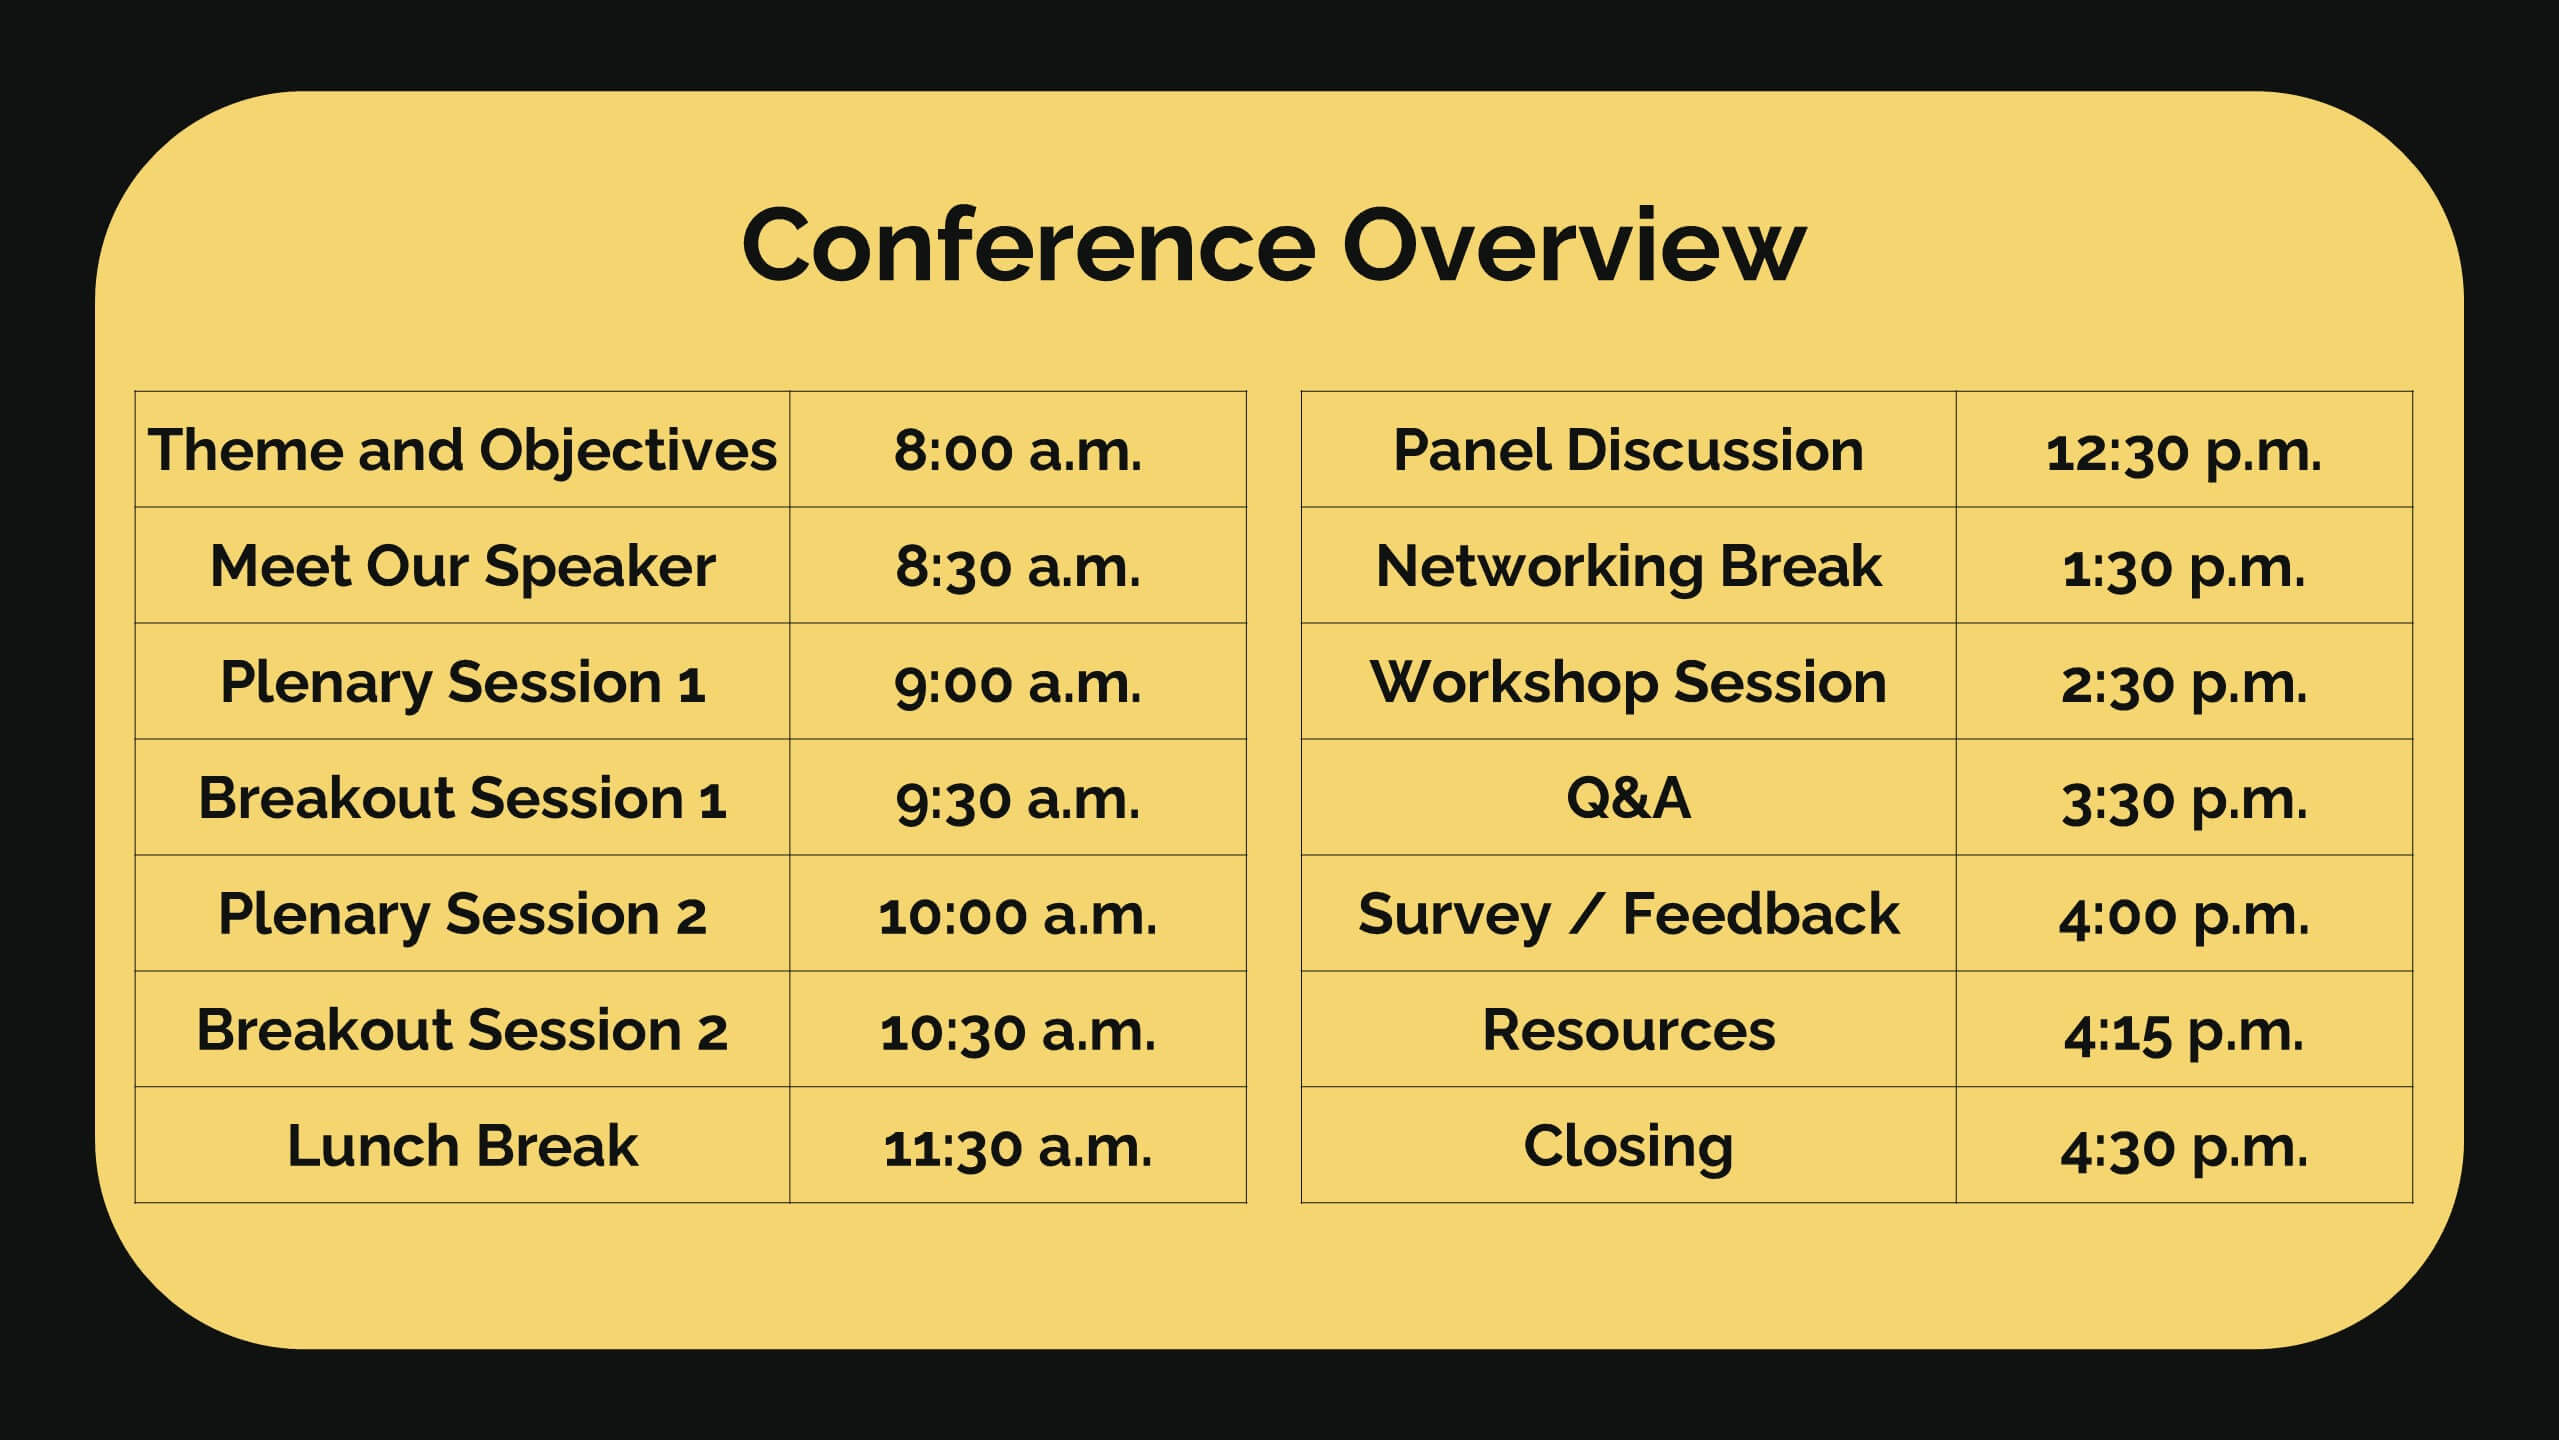
Diamond Business Development Proposal Presentation
Unlock the potential of your business proposals with this bold and engaging presentation template! Perfect for business development pitches, conferences, and workshops, it includes sections for speaker introductions, panel discussions, and session breakdowns. With its clean and professional design, this template ensures clarity and impact. Fully customizable and compatible with PowerPoint, Keynote, and Google Slides.


26 slides
Boost Presentation Template
Our Boost Crossfit Gym Presentation is a great template for getting your target audience motivated. With it, you can create an attractive and informative presentation that contains the most relevant information about your business. This template has an appealing design that will help you convey your message in a professional and interesting way. Our template comes with a ton of customizable sections, which will help you achieve all your presentation goals. You can easily customize this template to match your brand, add some unique header slides and get your own unique style going!


5 slides
Insurance Policy Structure Presentation
Add a touch of creativity to your financial reports with this clean and modern presentation design. Perfect for explaining coverage breakdowns, risk management strategies, or policy frameworks, it simplifies complex ideas through visuals. Fully editable and compatible with PowerPoint, Keynote, and Google Slides for a seamless presentation experience.


28 slides
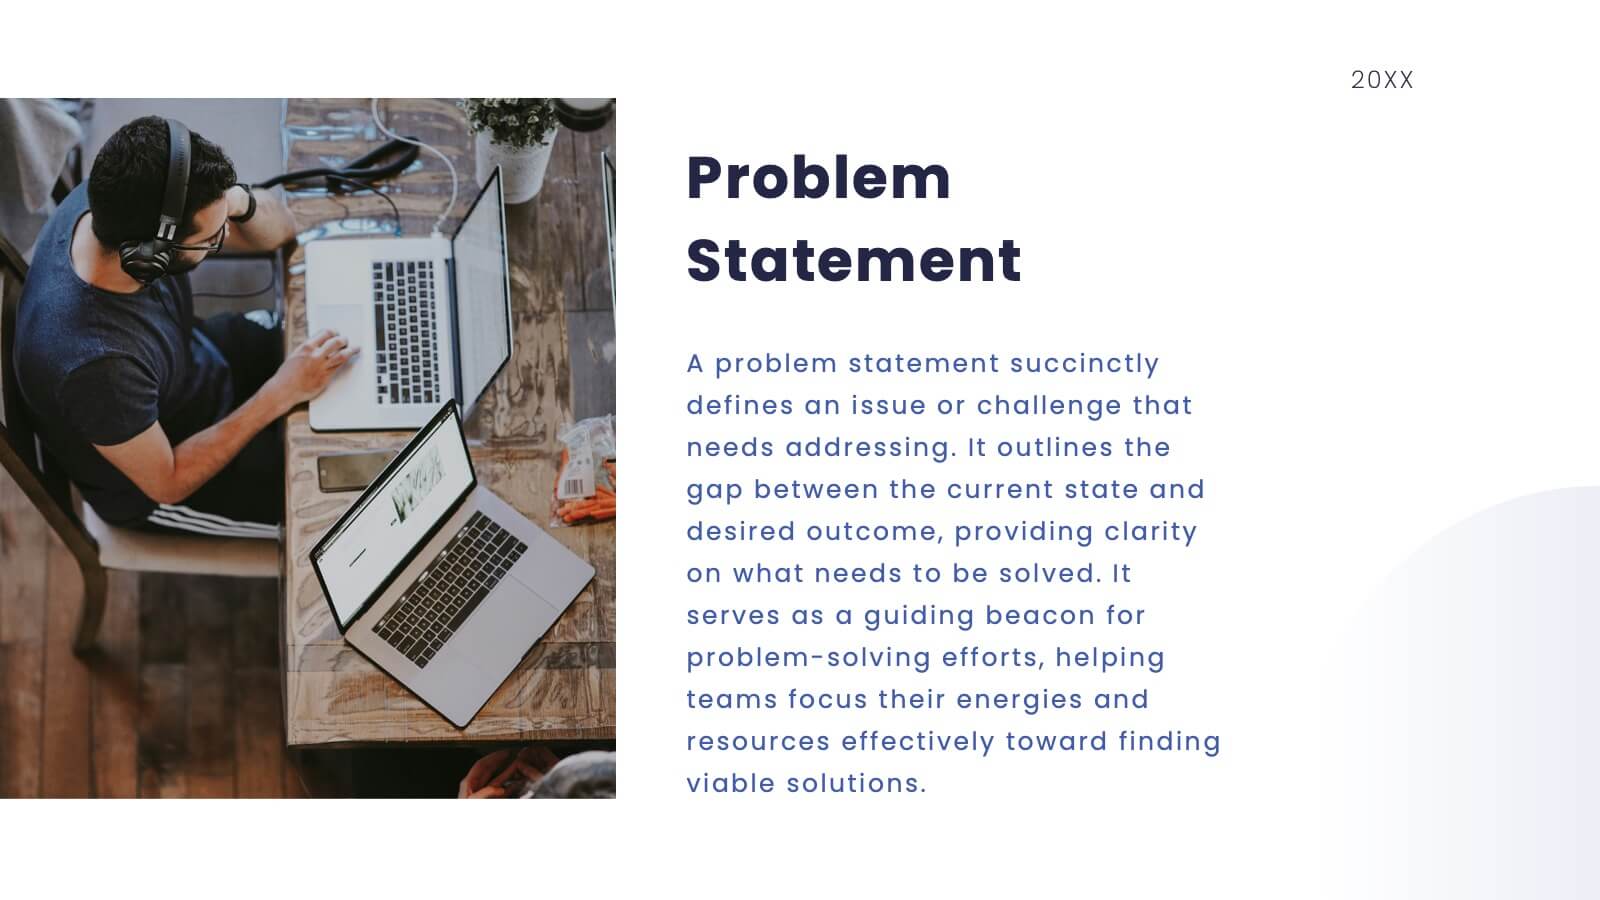
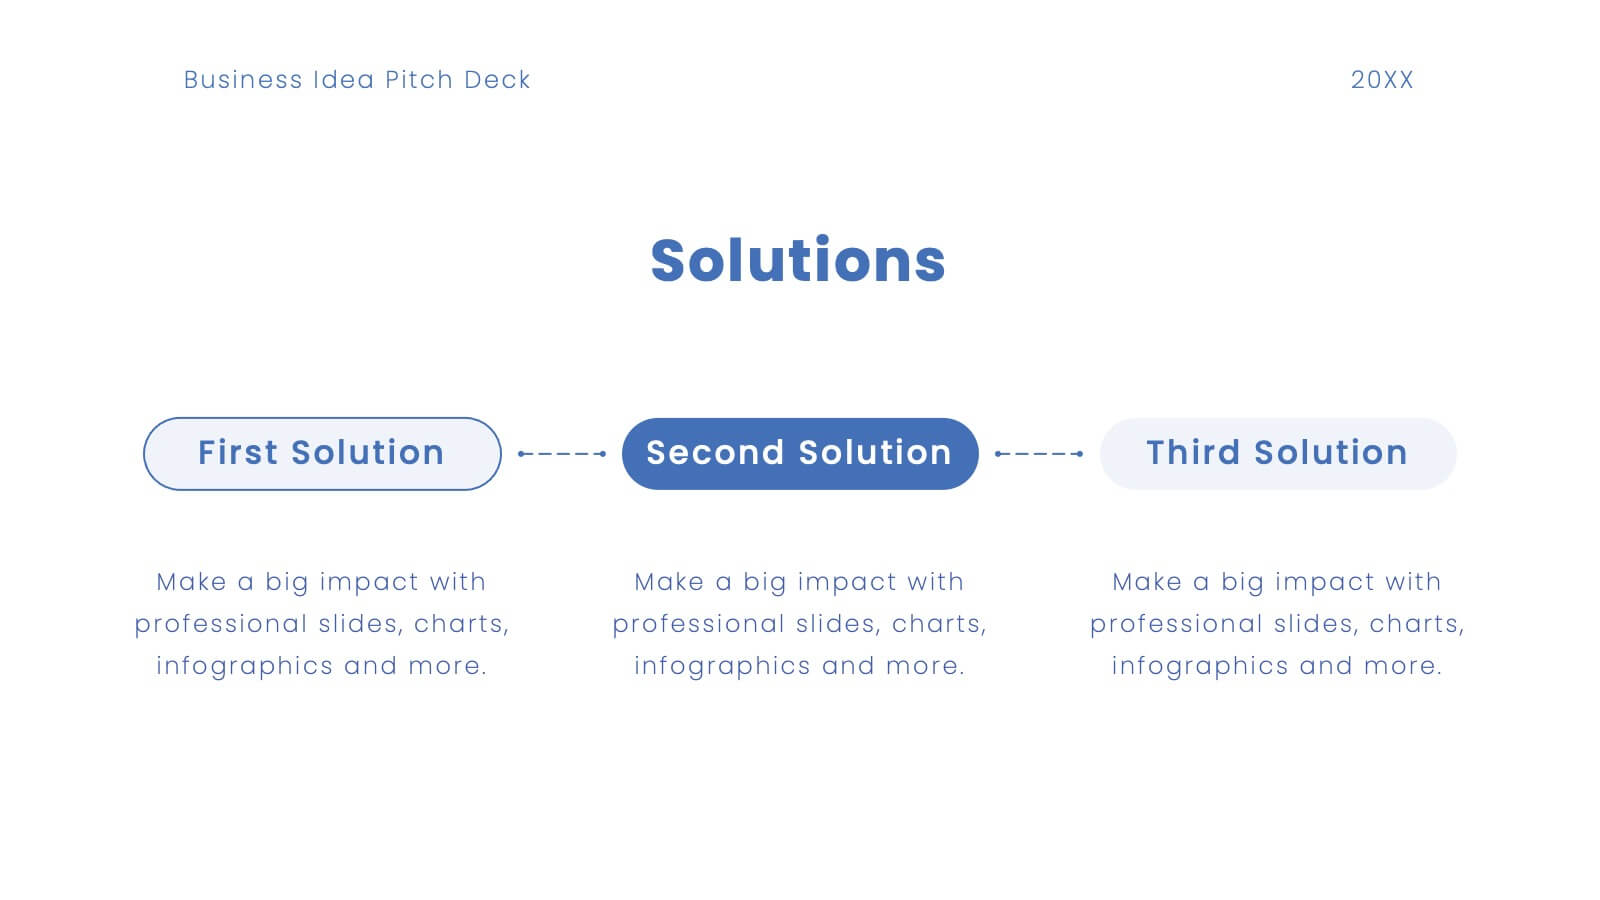
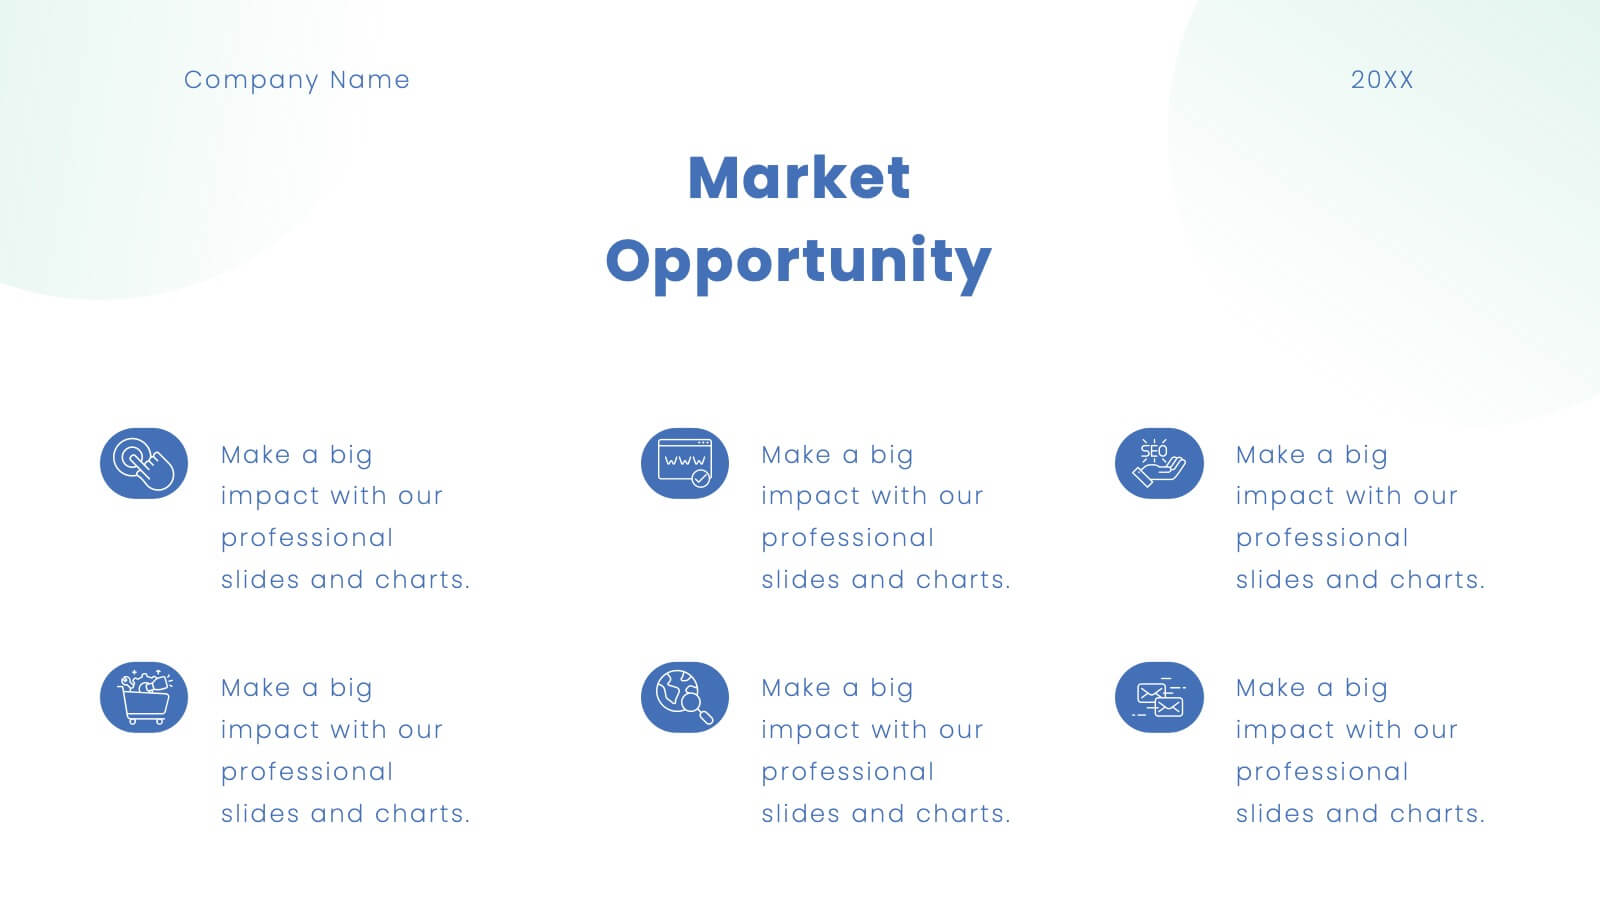
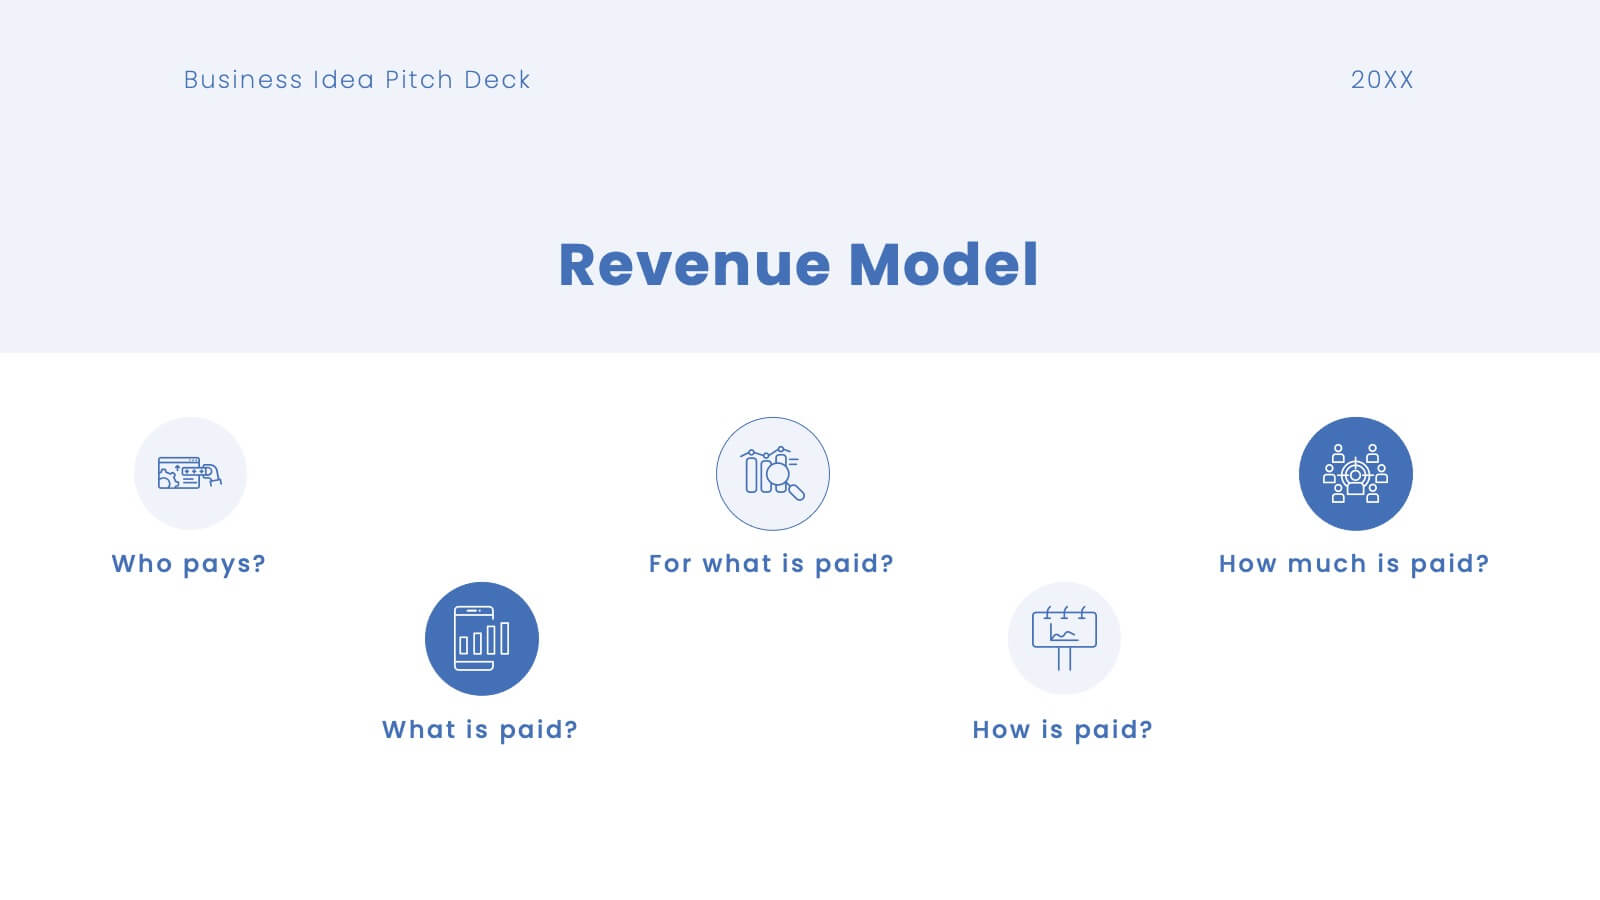
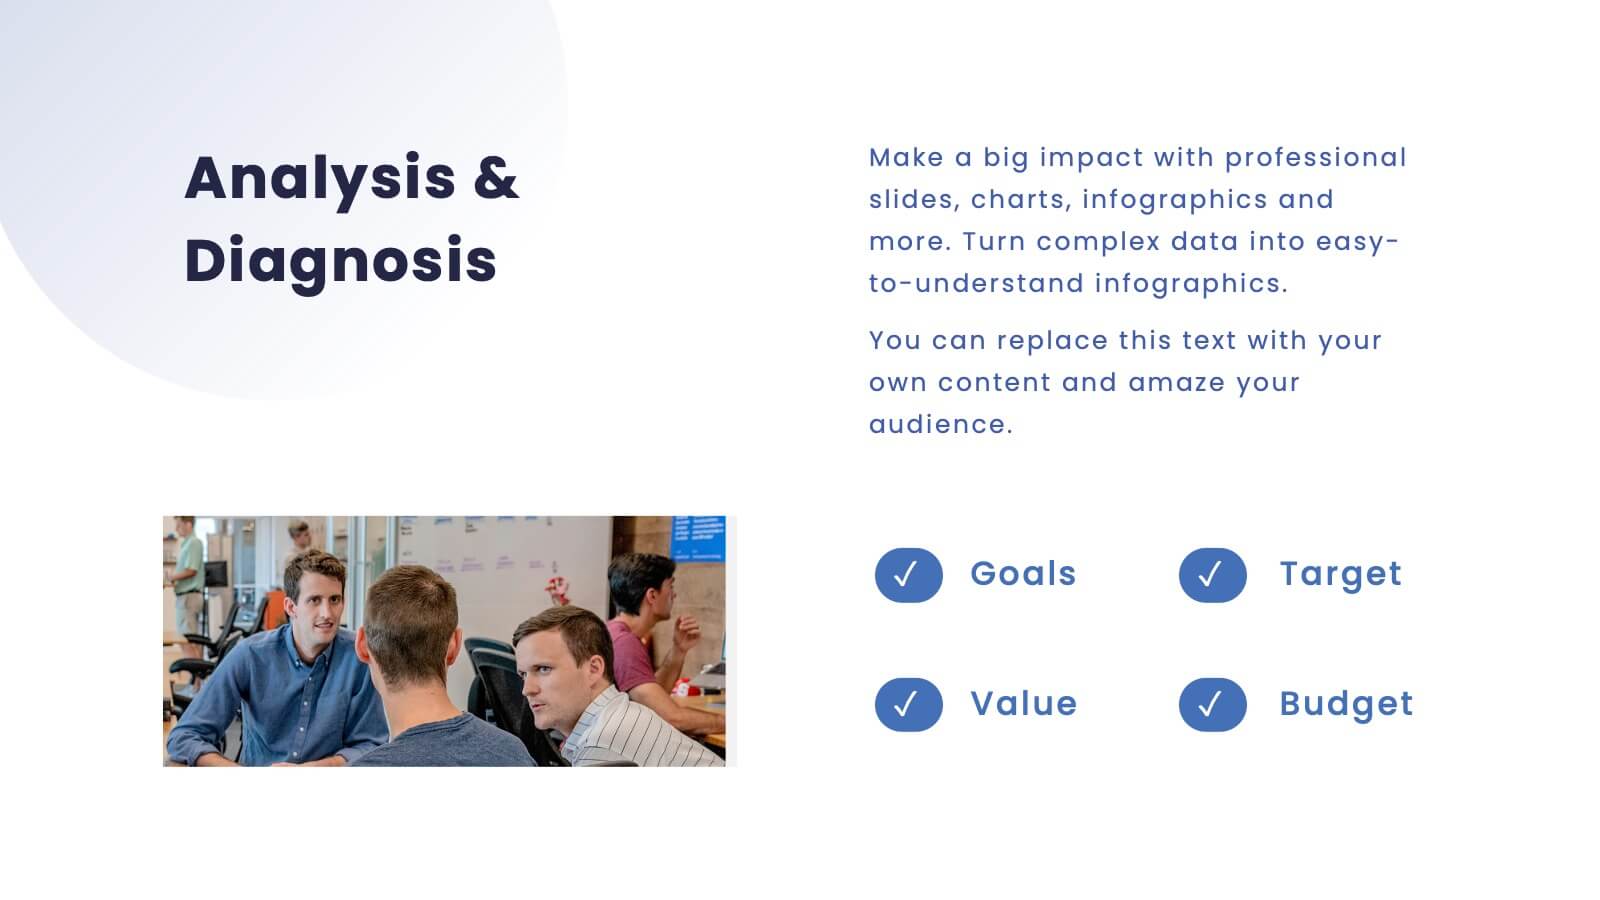
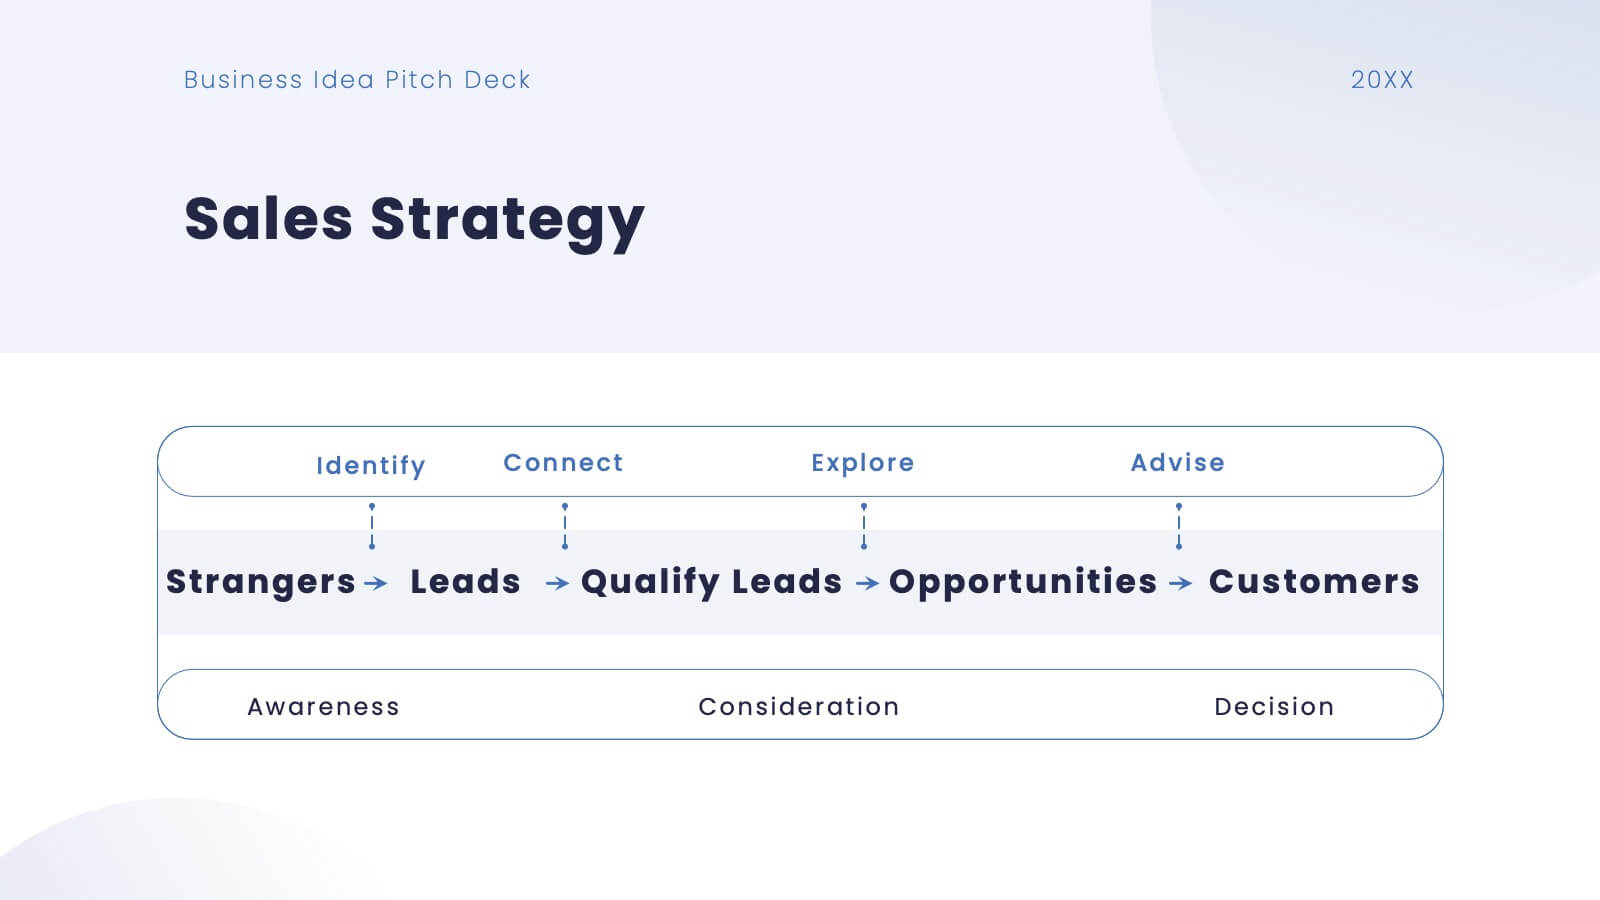
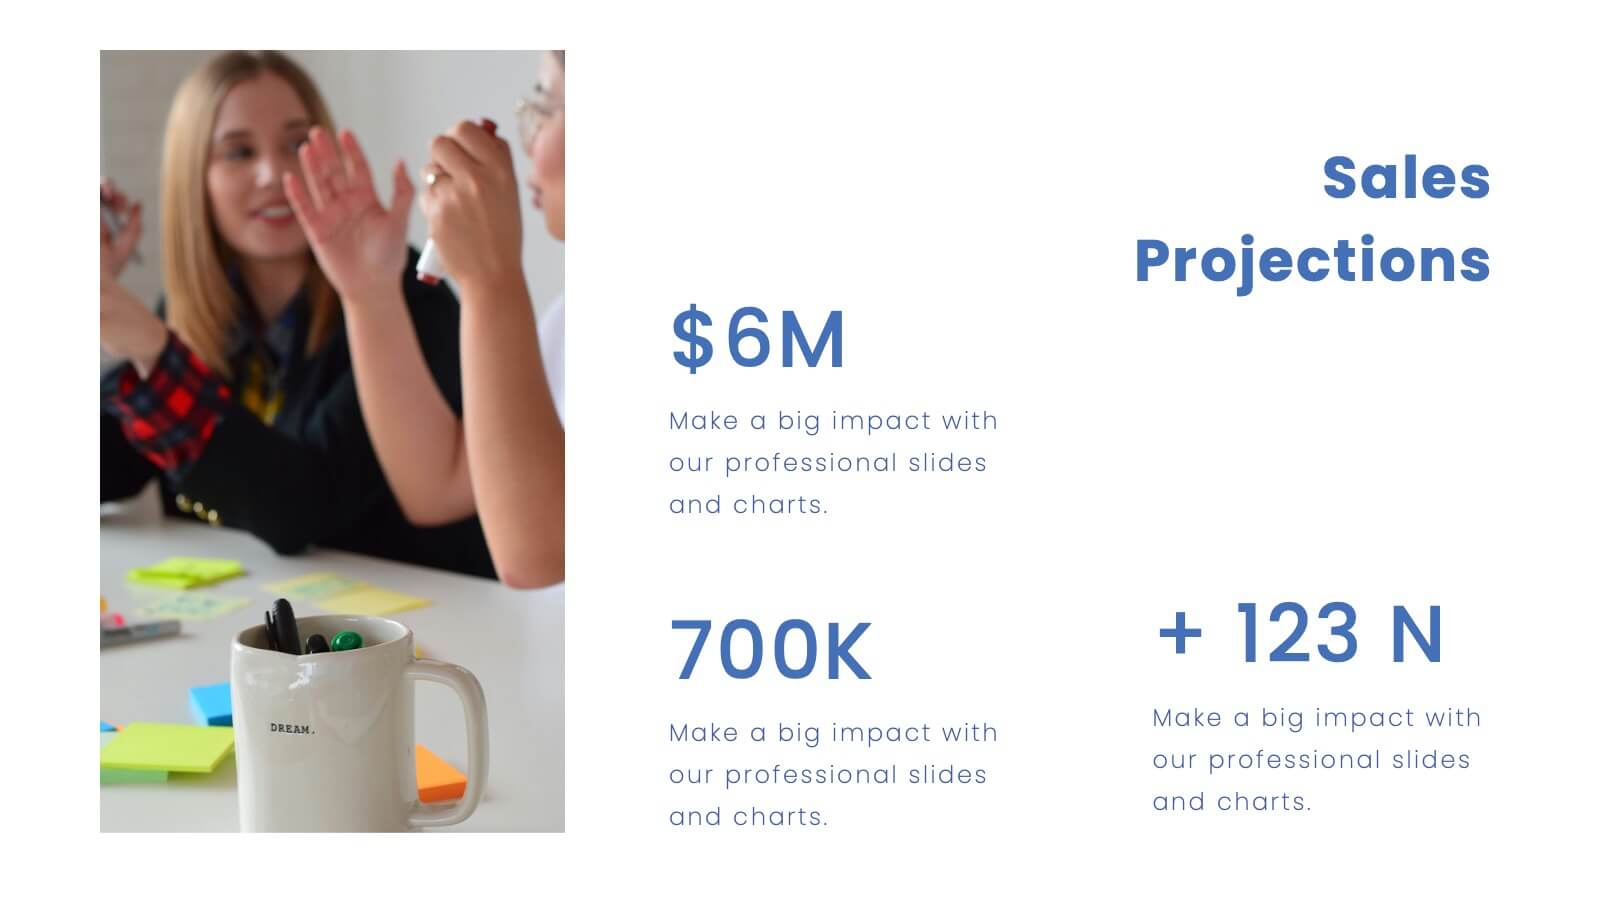
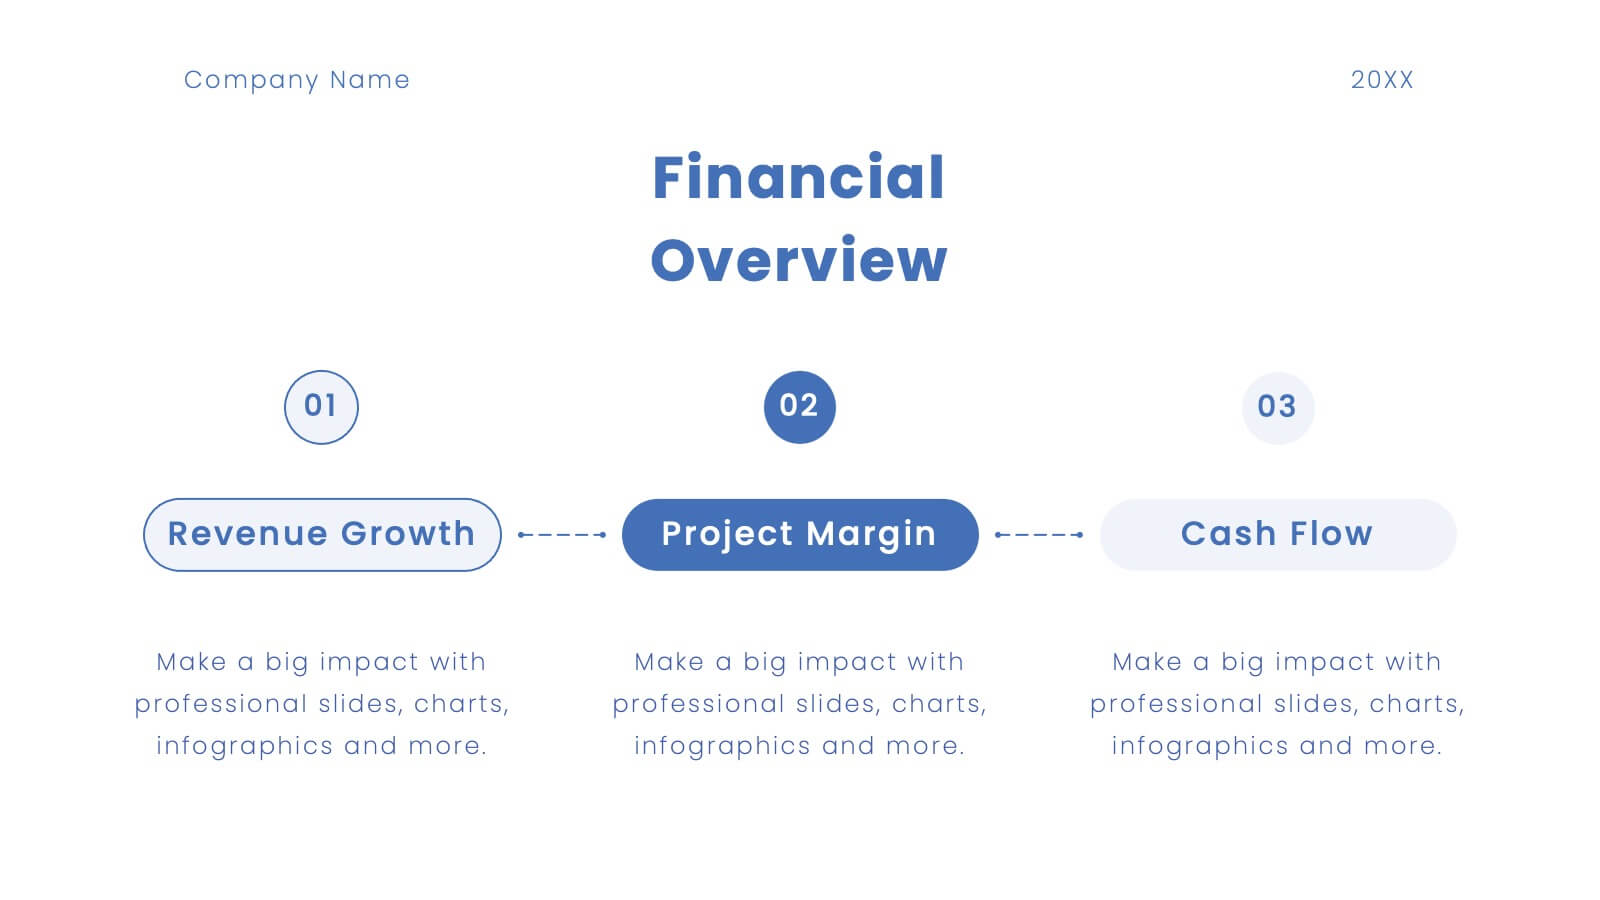
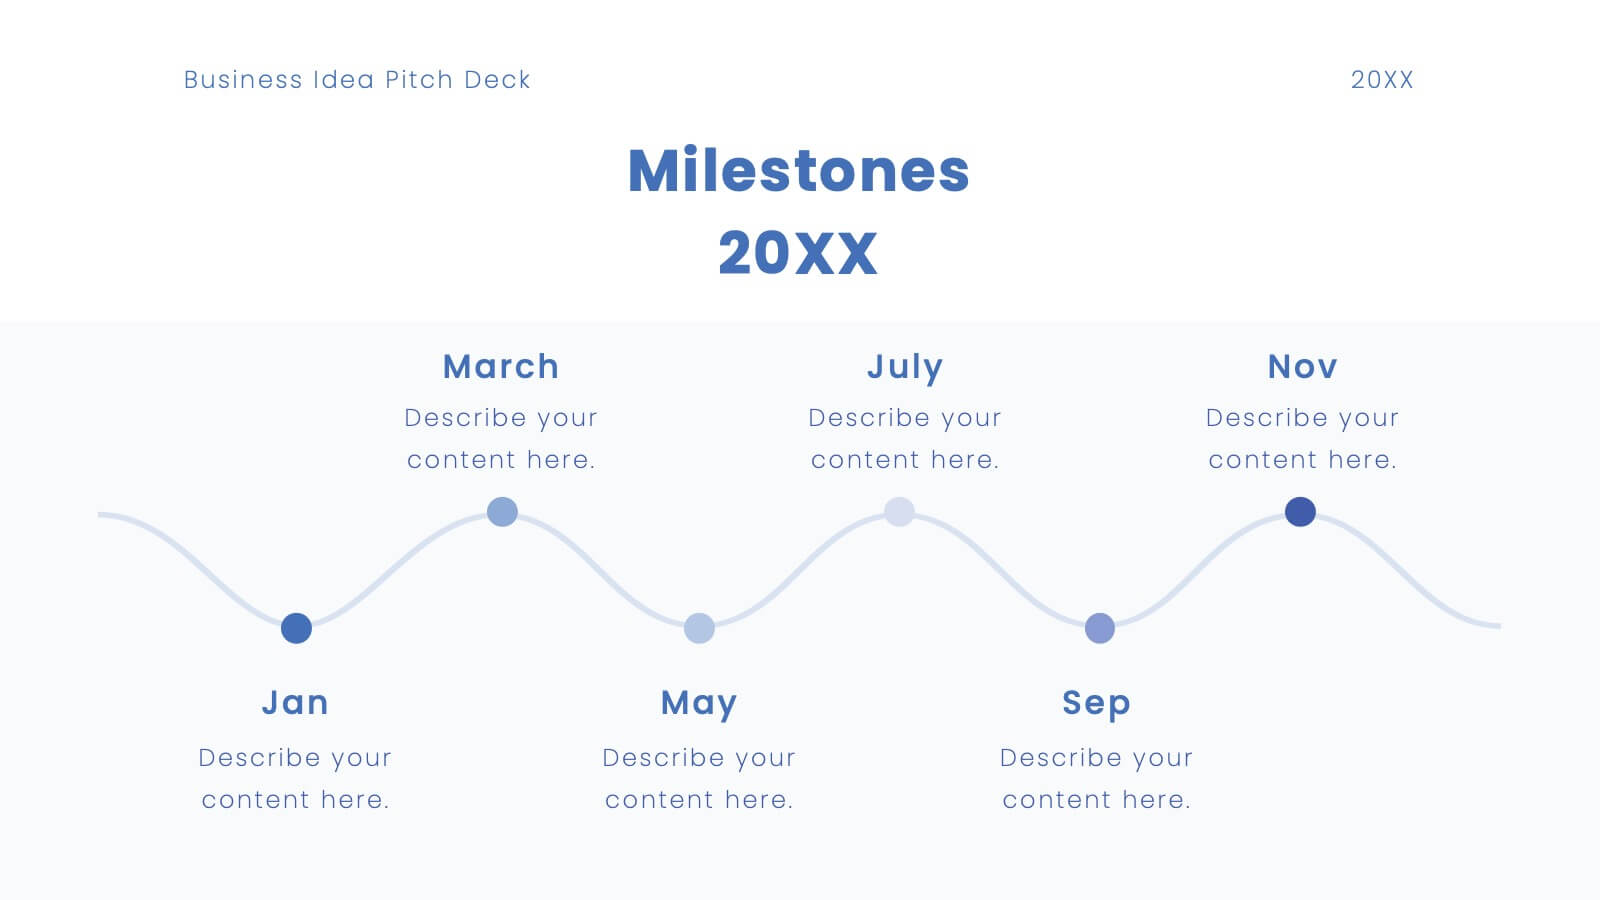
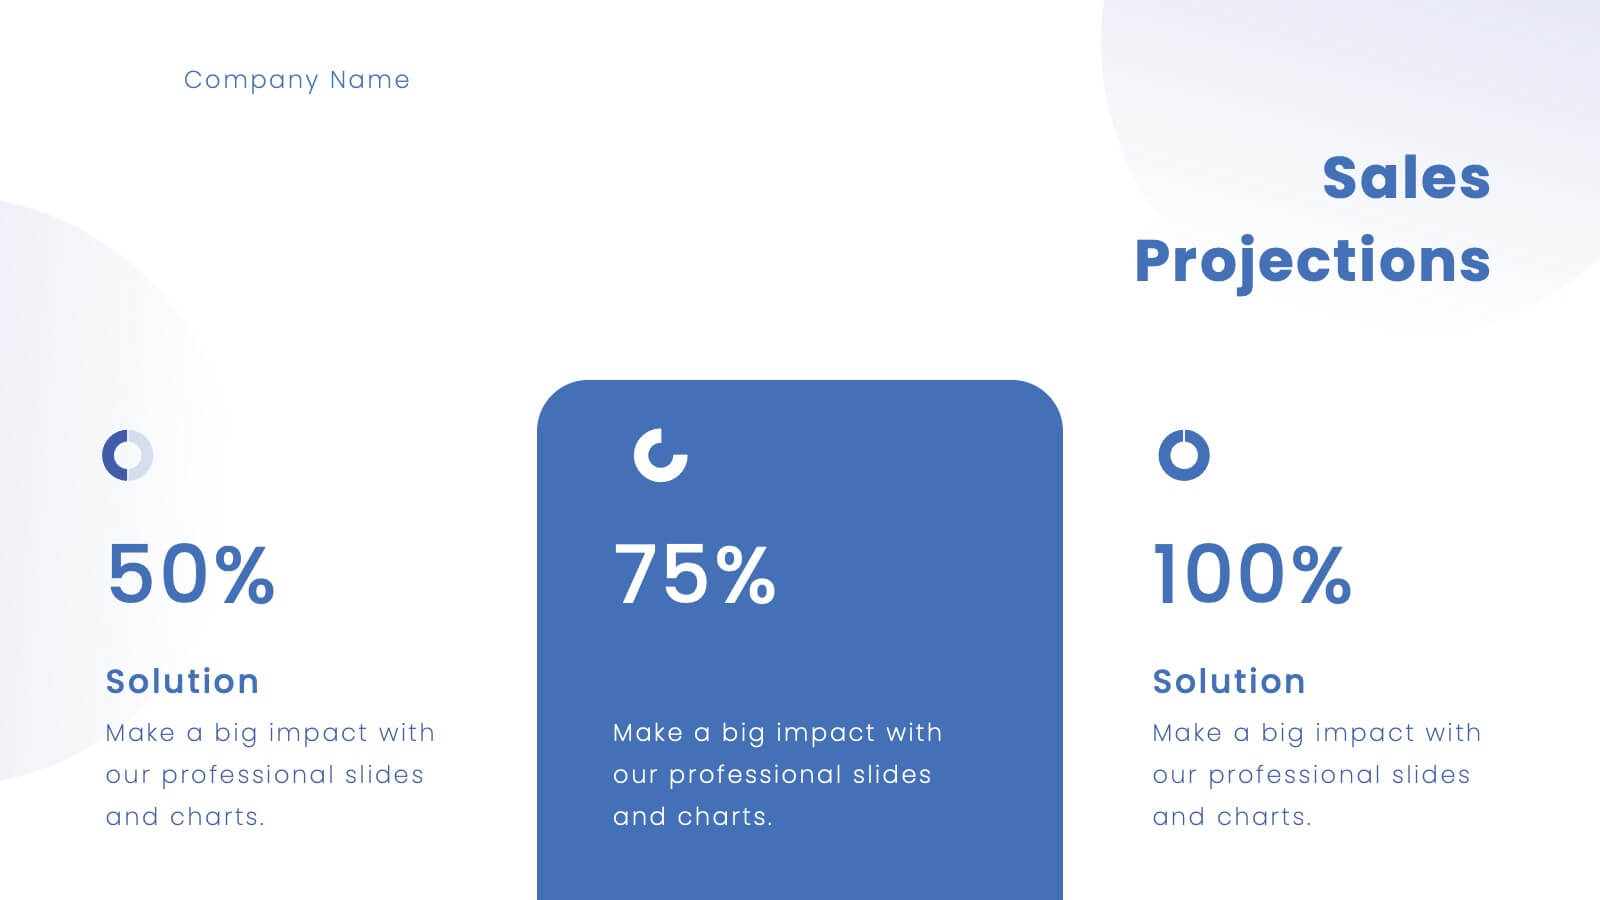
Platinum Business Idea Pitch Deck Presentation
Present your business idea with this sleek and professional pitch deck template! It includes everything from market opportunities to financial projections and sales strategies, providing a comprehensive structure for your pitch. Fully customizable and compatible with PowerPoint, Keynote, and Google Slides, this template is ideal for impressing investors and stakeholders.


5 slides
Progress and Performance Yearly Review Presentation
Highlight key milestones along your business journey with this winding roadmap-style slide. Designed for annual reviews, it features five flag markers for progress tracking, goals, or achievements. Ideal for reports or team updates. Fully customizable in PowerPoint, Keynote, and Google Slides for seamless adaptation to your yearly metrics.


5 slides
Project Management Plan Presentation
Bring structure and clarity to every phase of your workflow with this clean, arrow-based layout designed to outline tasks, milestones, and key deliverables. This presentation makes planning feel organized, engaging, and easy to follow for any audience. Fully editable and ready to use in PowerPoint, Keynote, and Google Slides.


2 slides
Office Interview Scenes Illustrations
Elevate your Interview experience with our office interview scenes illustrations pack! This is a burst of high-energy and lightheartedness that infuses the often nerve-wracking interview process with a touch of excitement and fun. These illustrations seamlessly fit into PowerPoint, Google Slides, and Keynote. Add a splash of color and playfulness to the serious nature of interviews, creating an environment where both interviewers and candidates can feel at ease!


12 slides
Business Networking Strategy
Showcase your connection-building roadmap with this hexagonal Business Networking Strategy template. Ideal for illustrating partnerships, key contacts, or collaboration phases, this layout helps structure complex relationships with clarity. Fully customizable in PowerPoint, Keynote, and Google Slides to match your branding and networking objectives.


10 slides
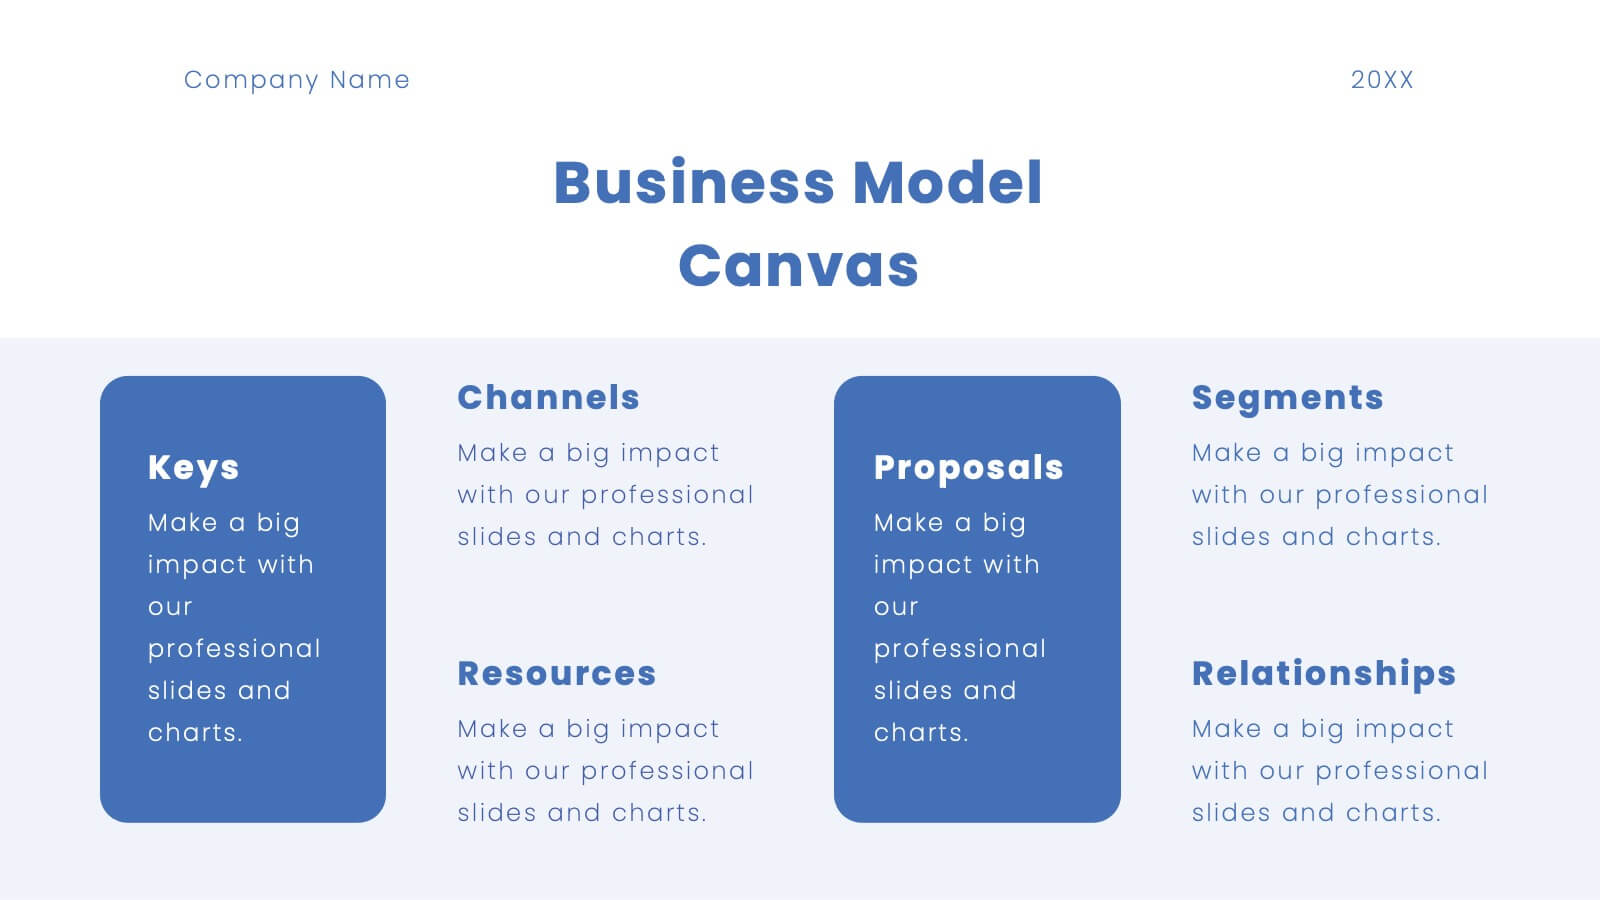
Business Model Hexagon Infographic
Break down your strategy into clear, modular components with the Business Model Hexagon Infographic Presentation. This visually engaging layout features five interlinked hexagons, each labeled and icon-marked for easy segmentation of your business pillars—such as value propositions, customer channels, key partners, and revenue streams. The vertical stack ensures a logical flow while keeping your message structured and professional. Fully editable in PowerPoint, Keynote, and Google Slides, allowing you to tailor icons, text, and colors to match your business theme.


4 slides
Fixed and Variable Cost Balance Presentation
Visualize cost distribution using a balanced scale metaphor. This presentation helps compare fixed and variable costs with editable sections for data input. Ideal for financial planning, budgeting, or cost control analysis. Fully customizable in PowerPoint, Keynote, and Google Slides to match any brand or business presentation style.


4 slides
Health and Safety Measures Presentation
Bring awareness and clarity to your audience with this bold, safety-inspired presentation layout. Designed to help communicate workplace protocols, risk prevention, and emergency measures effectively, it uses clean visuals and strong icons to capture attention. Fully editable and compatible with PowerPoint, Keynote, and Google Slides for seamless customization.