


Features
- 6 Unique slides
- Fully editable and easy to edit in Microsoft Powerpoint, Keynote and Google Slides
- 16:9 widescreen layout
- Clean and professional designs
- Export to JPG, PDF or send by email


Do you have any questions?
Recommend


2 slides
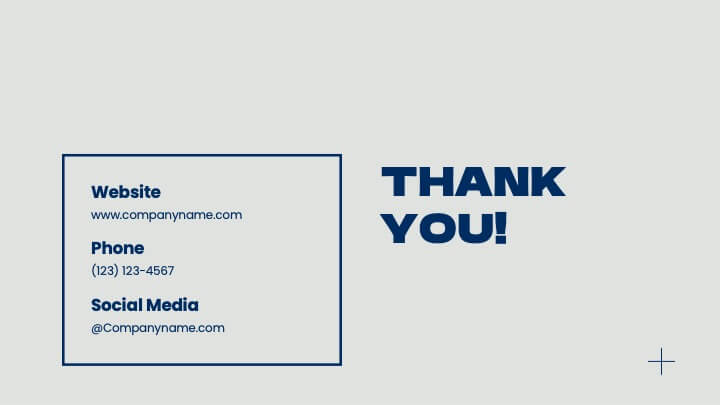
Creative Gratitude Slide
Wrap up your presentation with impact using this clean, modern “Thank You” slide. Featuring space for a photo, contact details, and playful design elements, it's perfect for leaving a lasting impression. Ideal for business proposals, pitch decks, and educational slide decks. Fully editable in PowerPoint, Keynote, and Google Slides.


23 slides
Imaginix Digital Strategy Presentation
Plan and execute your business strategy with this sleek and modern template. Covering key areas such as SWOT analysis, competitive landscape, performance metrics, and implementation plans, it’s perfect for professionals aiming to optimize digital initiatives. Fully customizable and compatible with PowerPoint, Keynote, and Google Slides.


8 slides
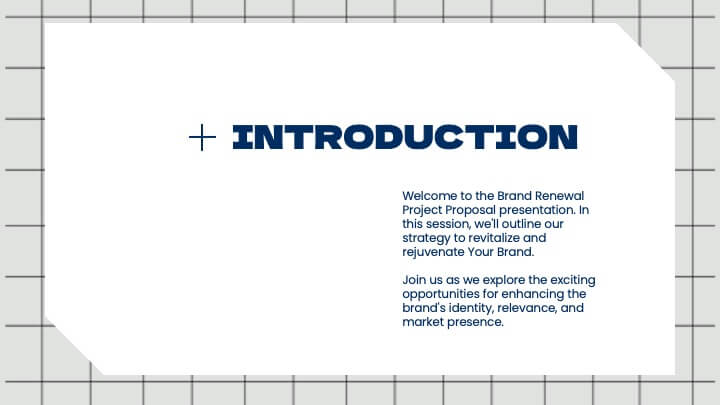
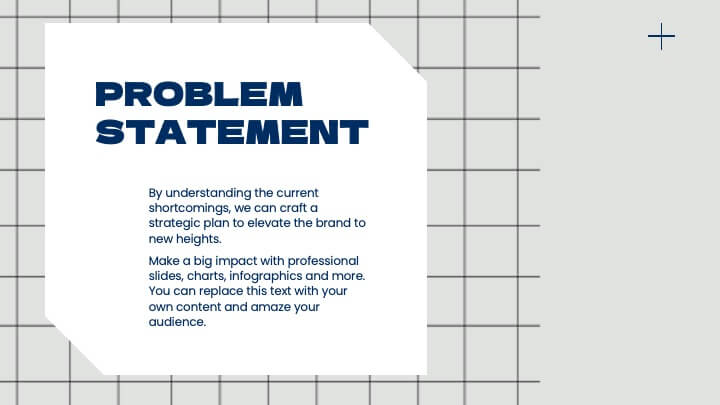
Business Challenge and Issue Definition Presentation
Break down complex problems with clarity using this Business Challenge and Issue Definition presentation. Designed to highlight key issues step by step, this layout helps your audience follow your reasoning with ease. Ideal for internal reviews or strategy alignment, it’s fully editable in Canva, PowerPoint, and Google Slides.
22 slides
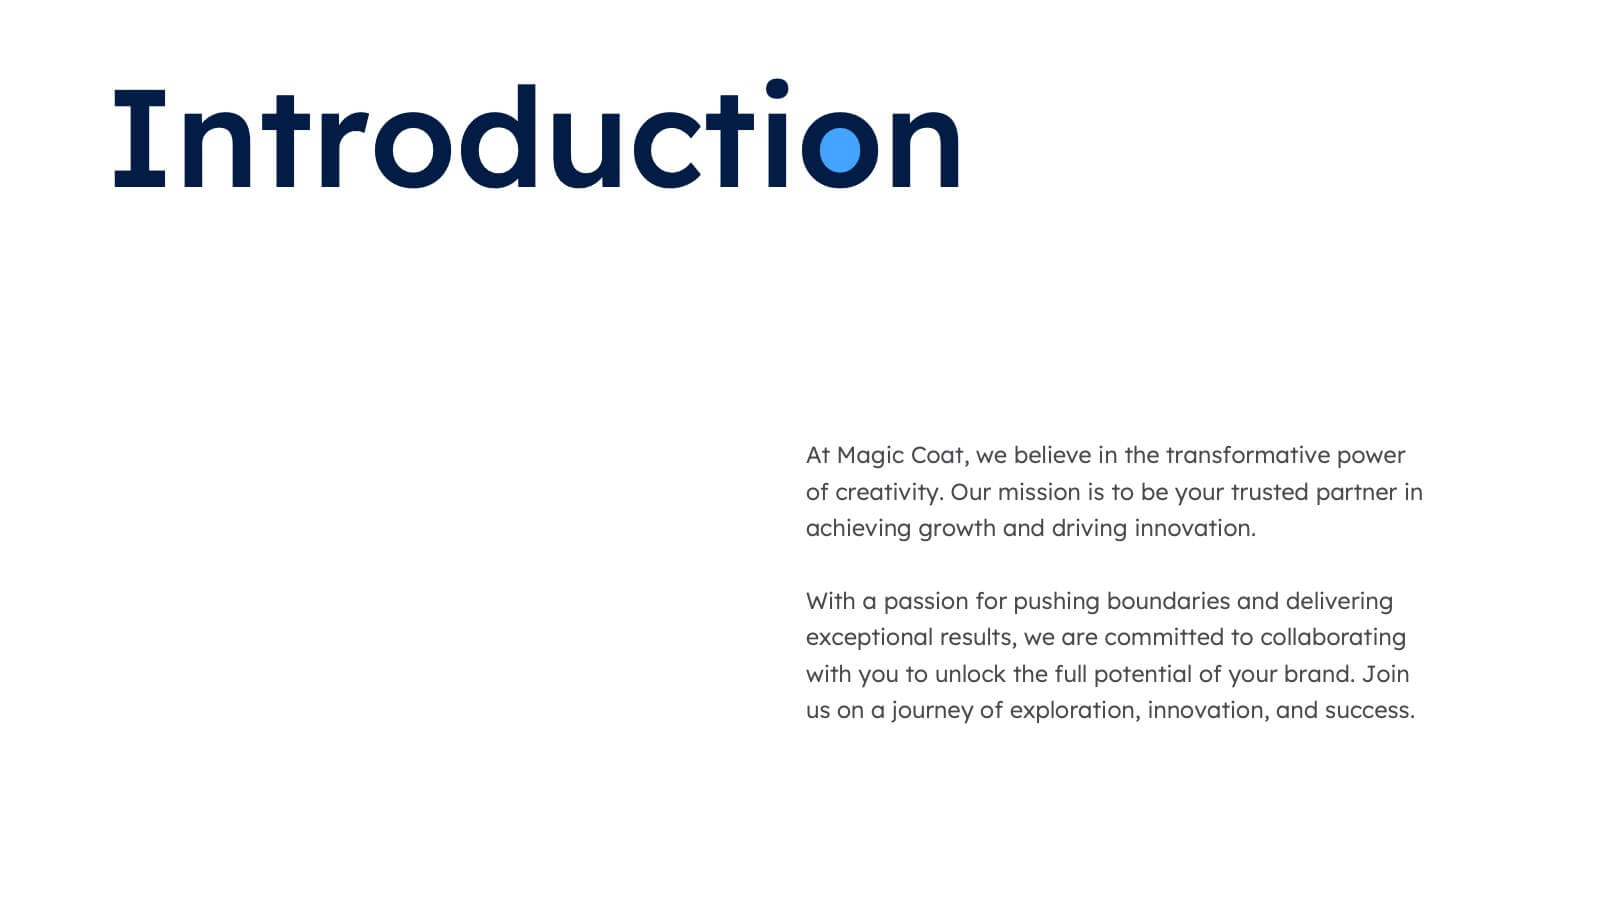
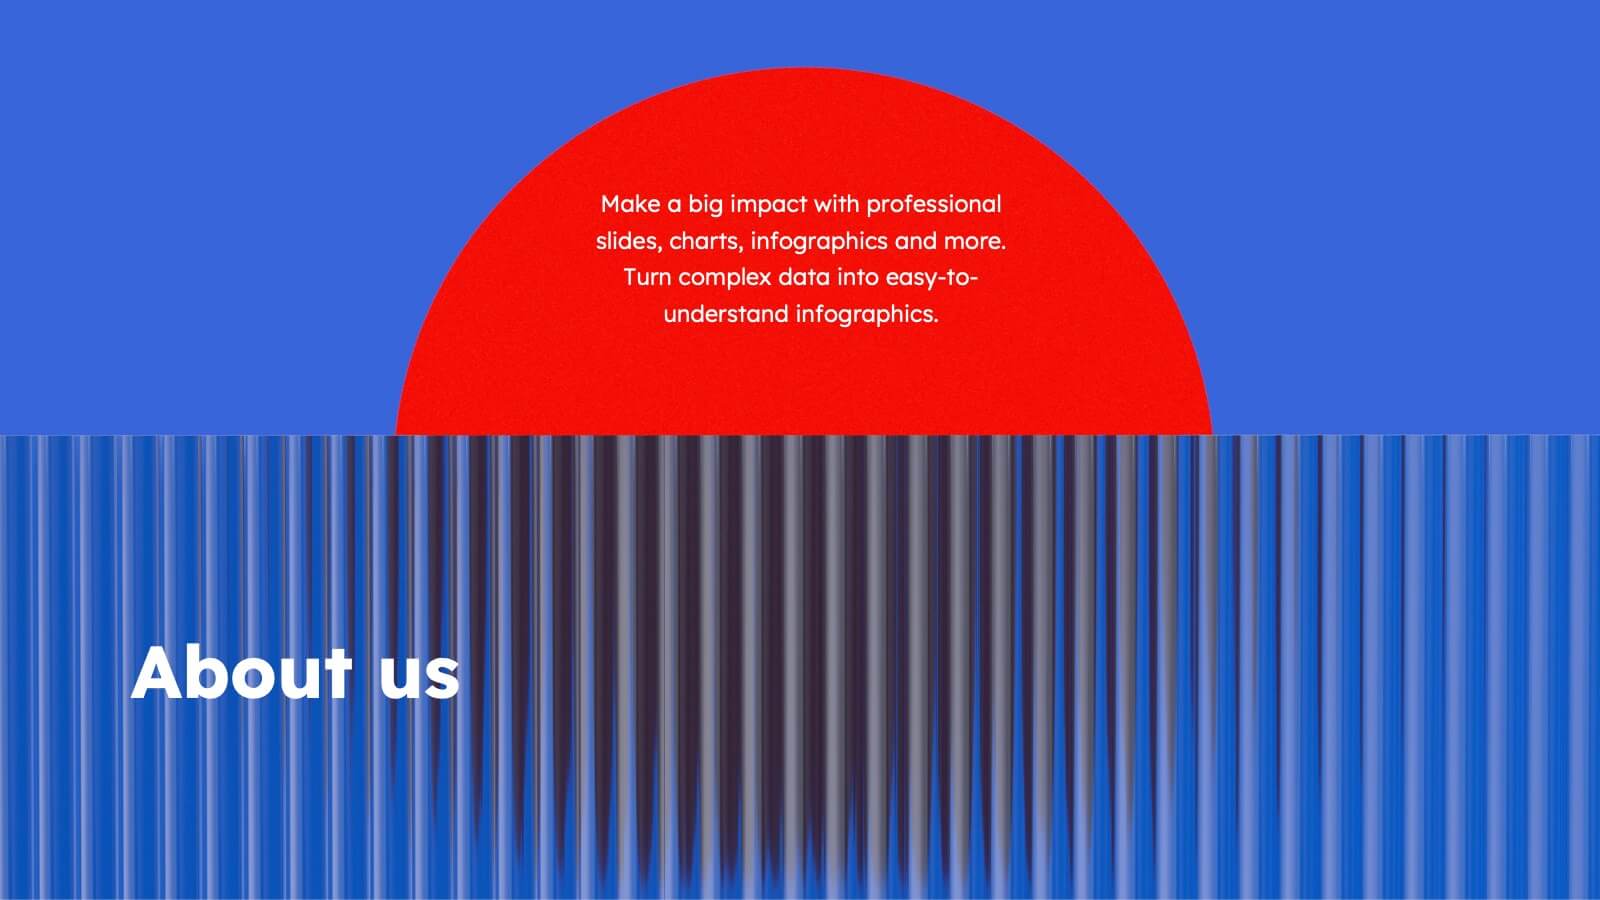
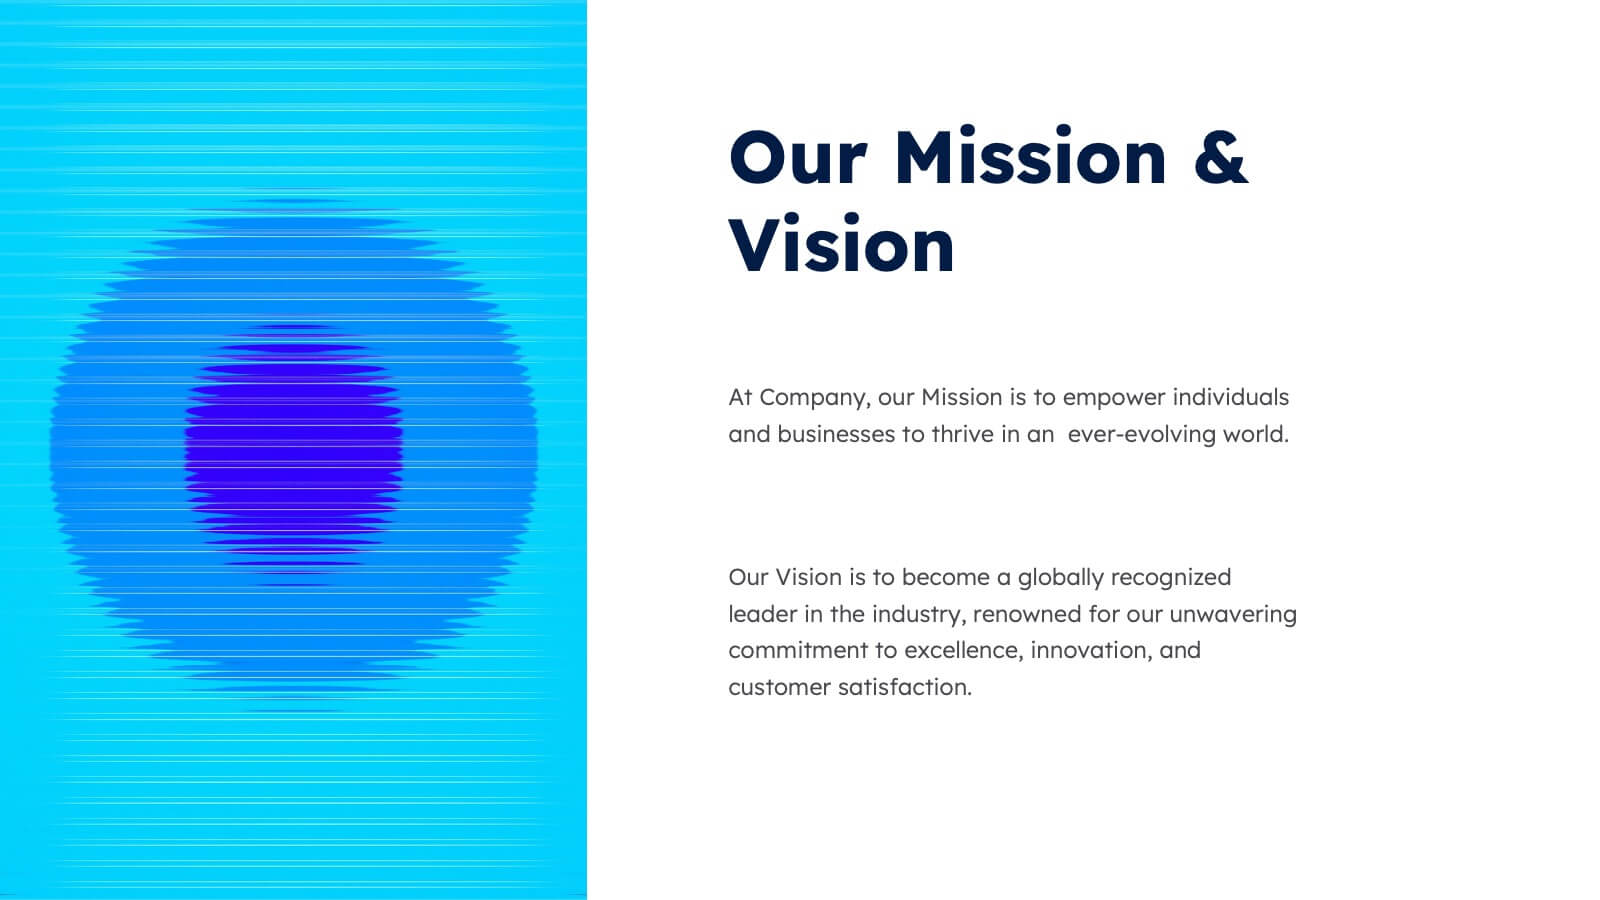
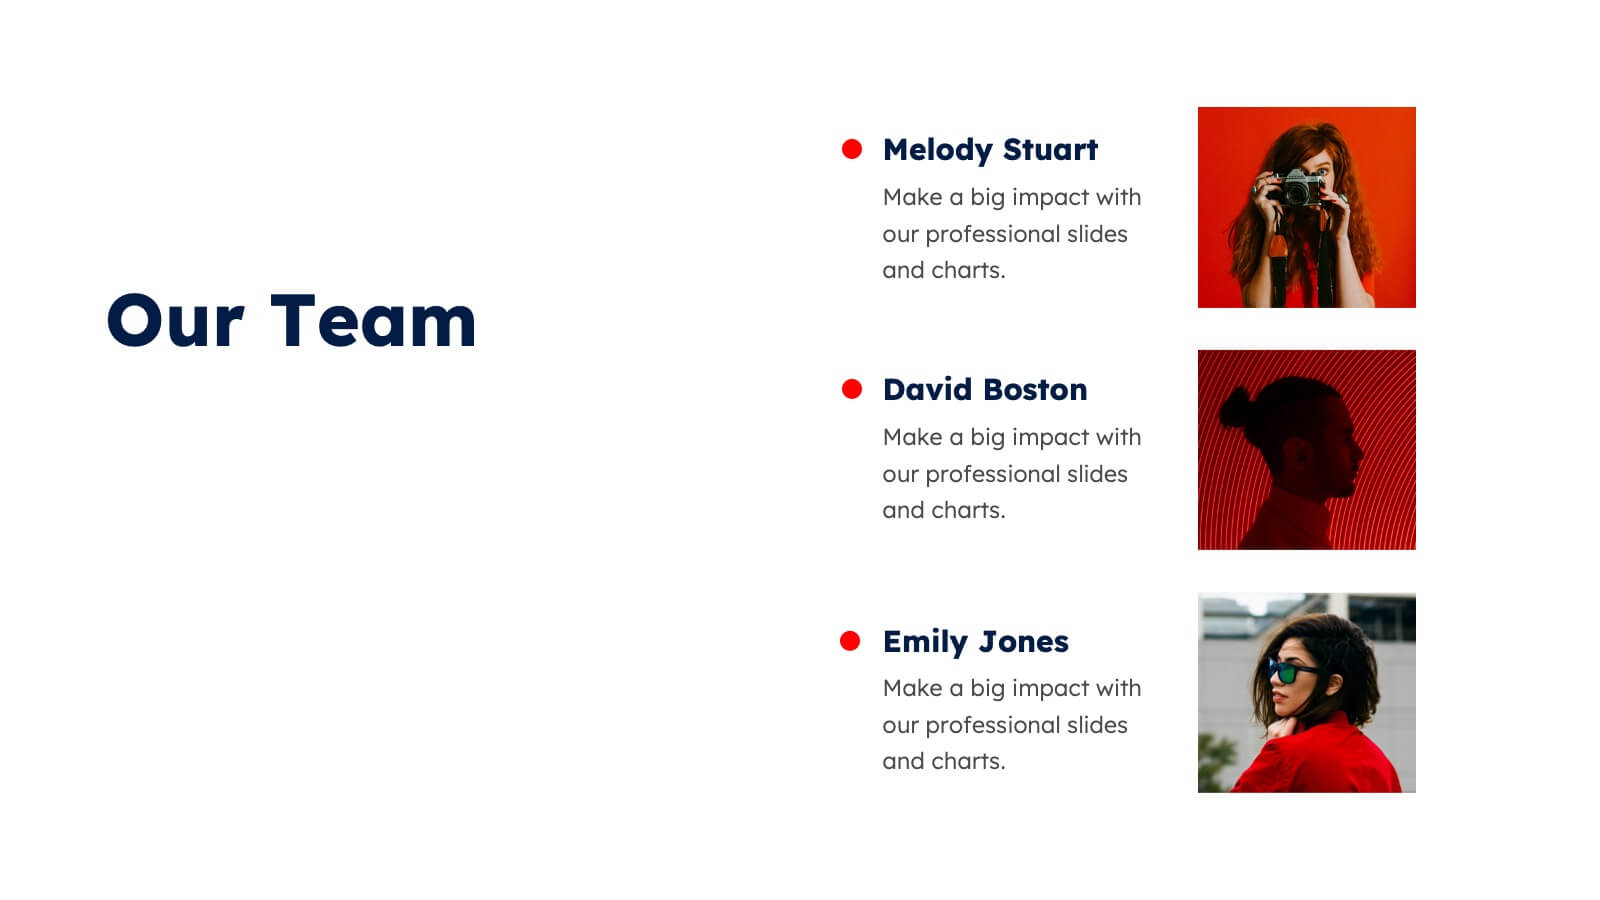
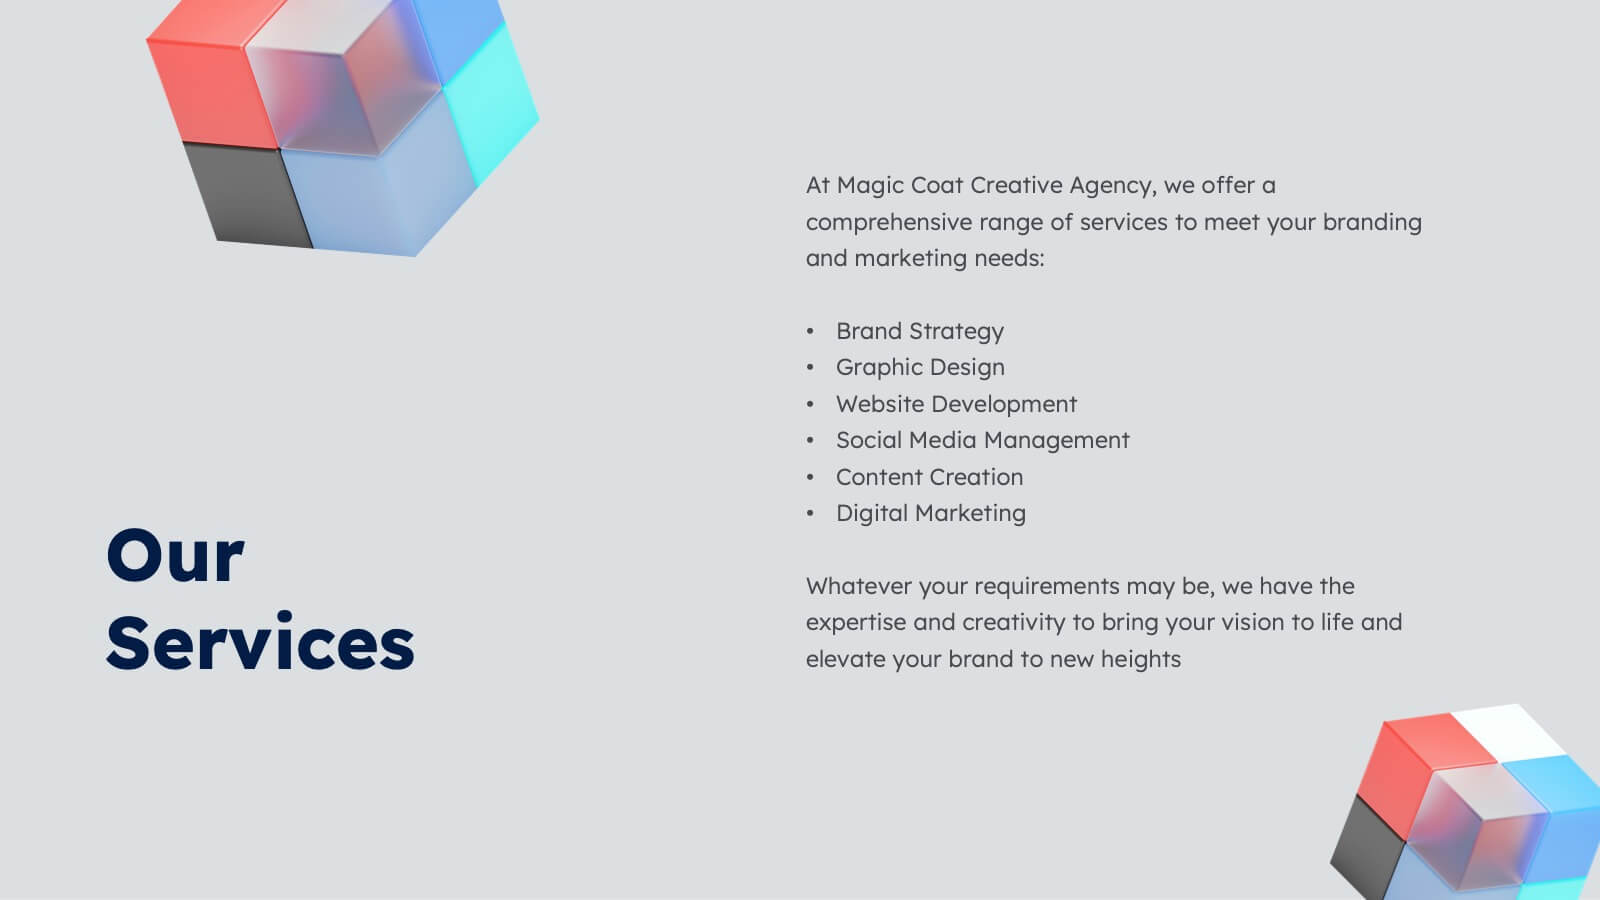
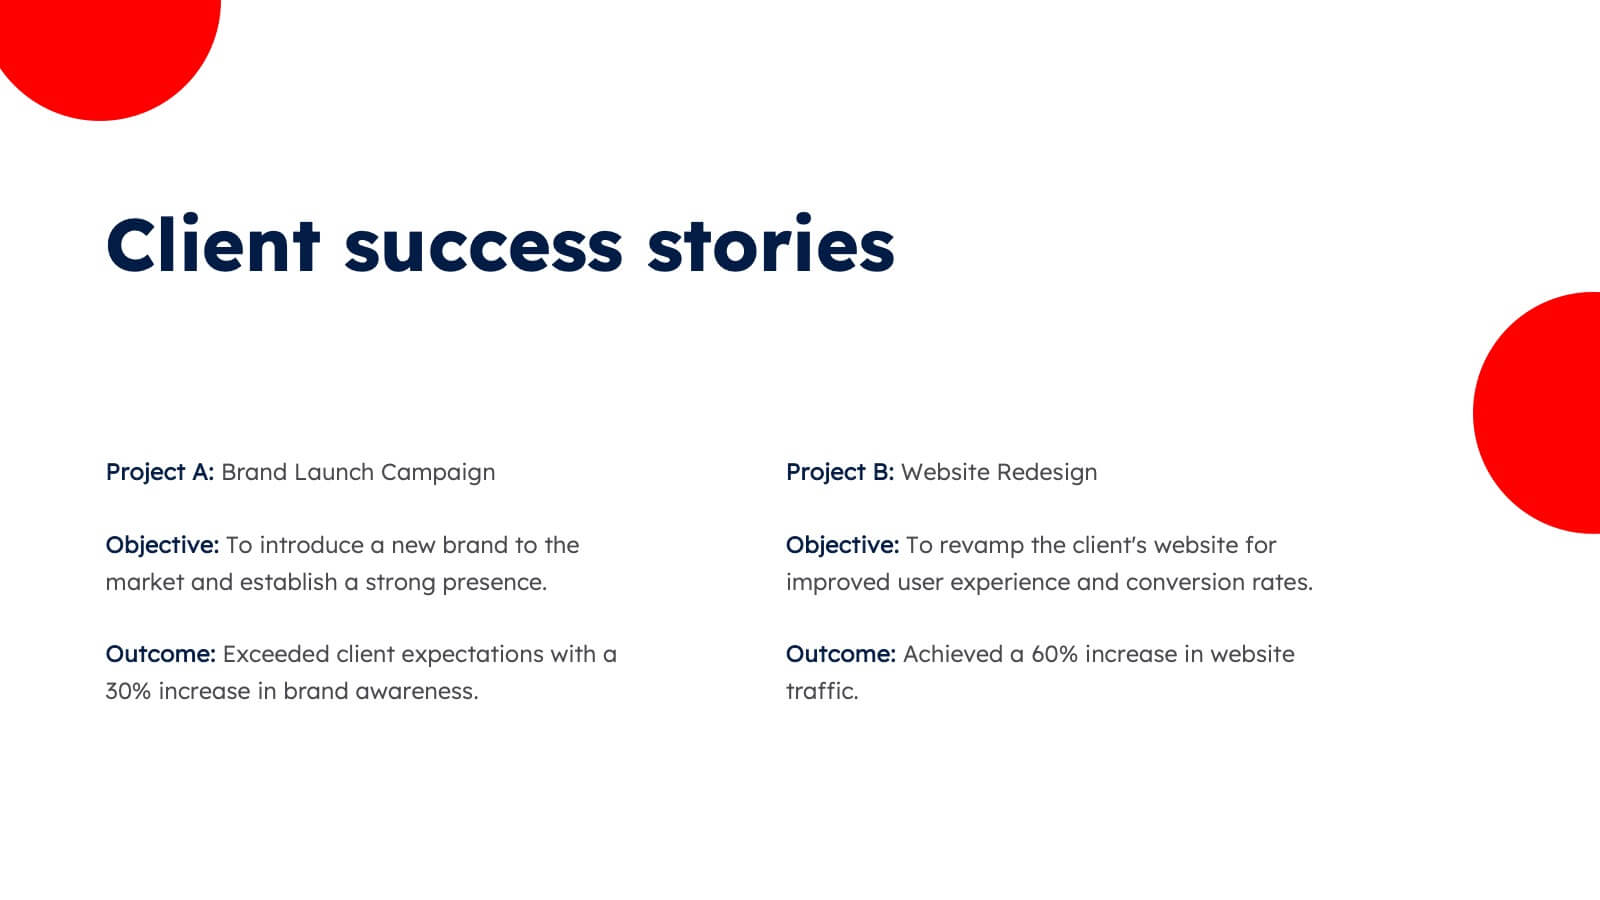
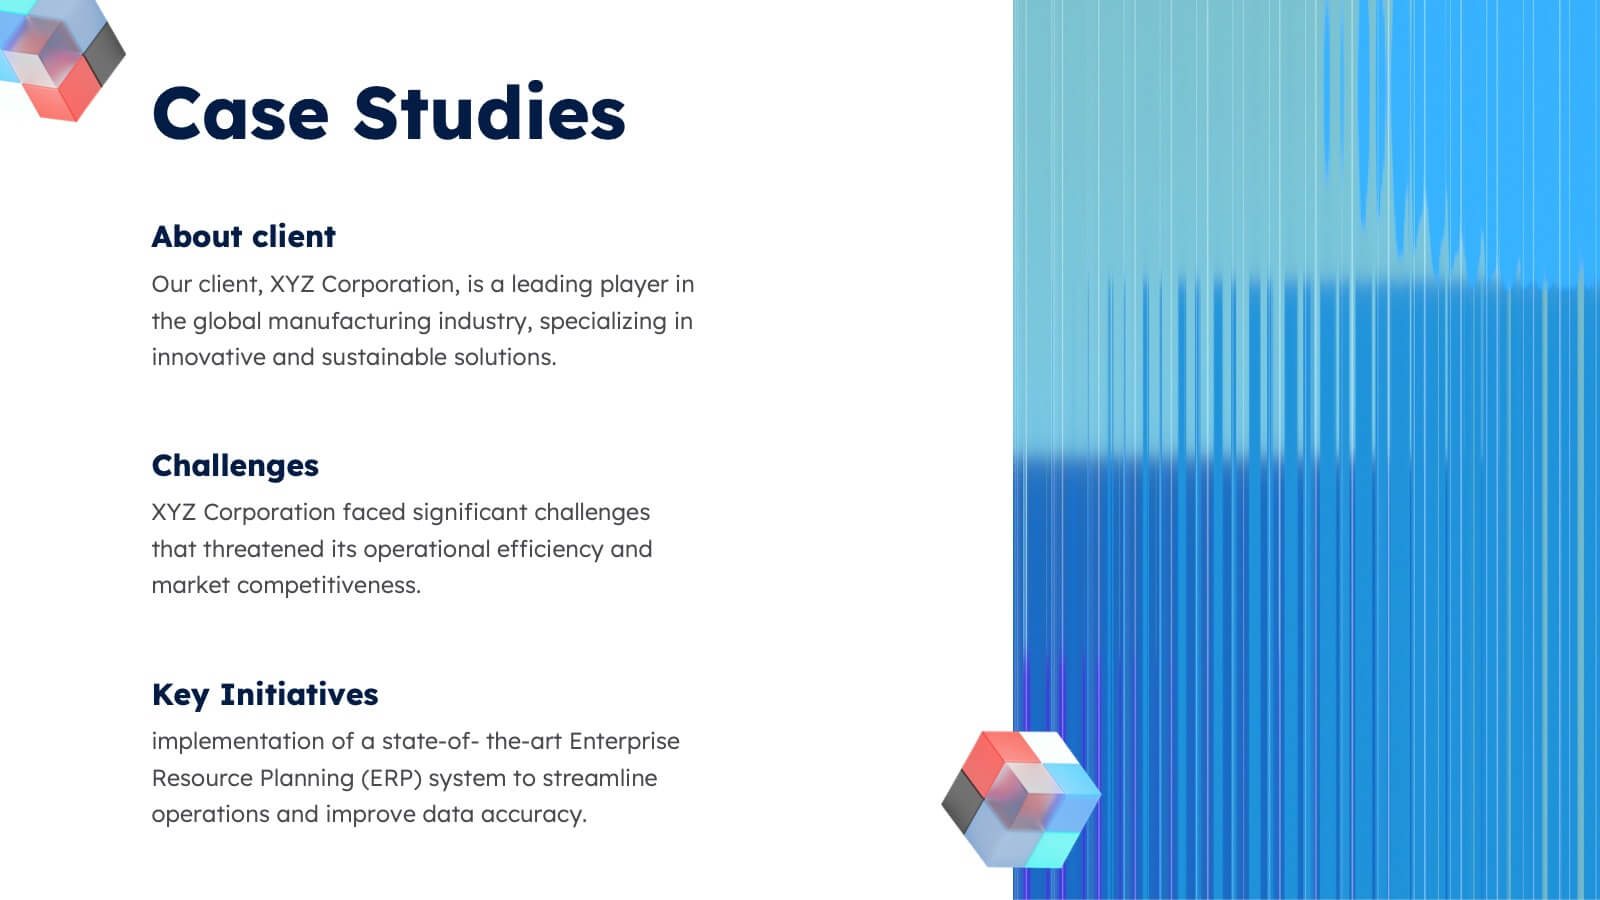
Aura Agency Portfolio Presentation
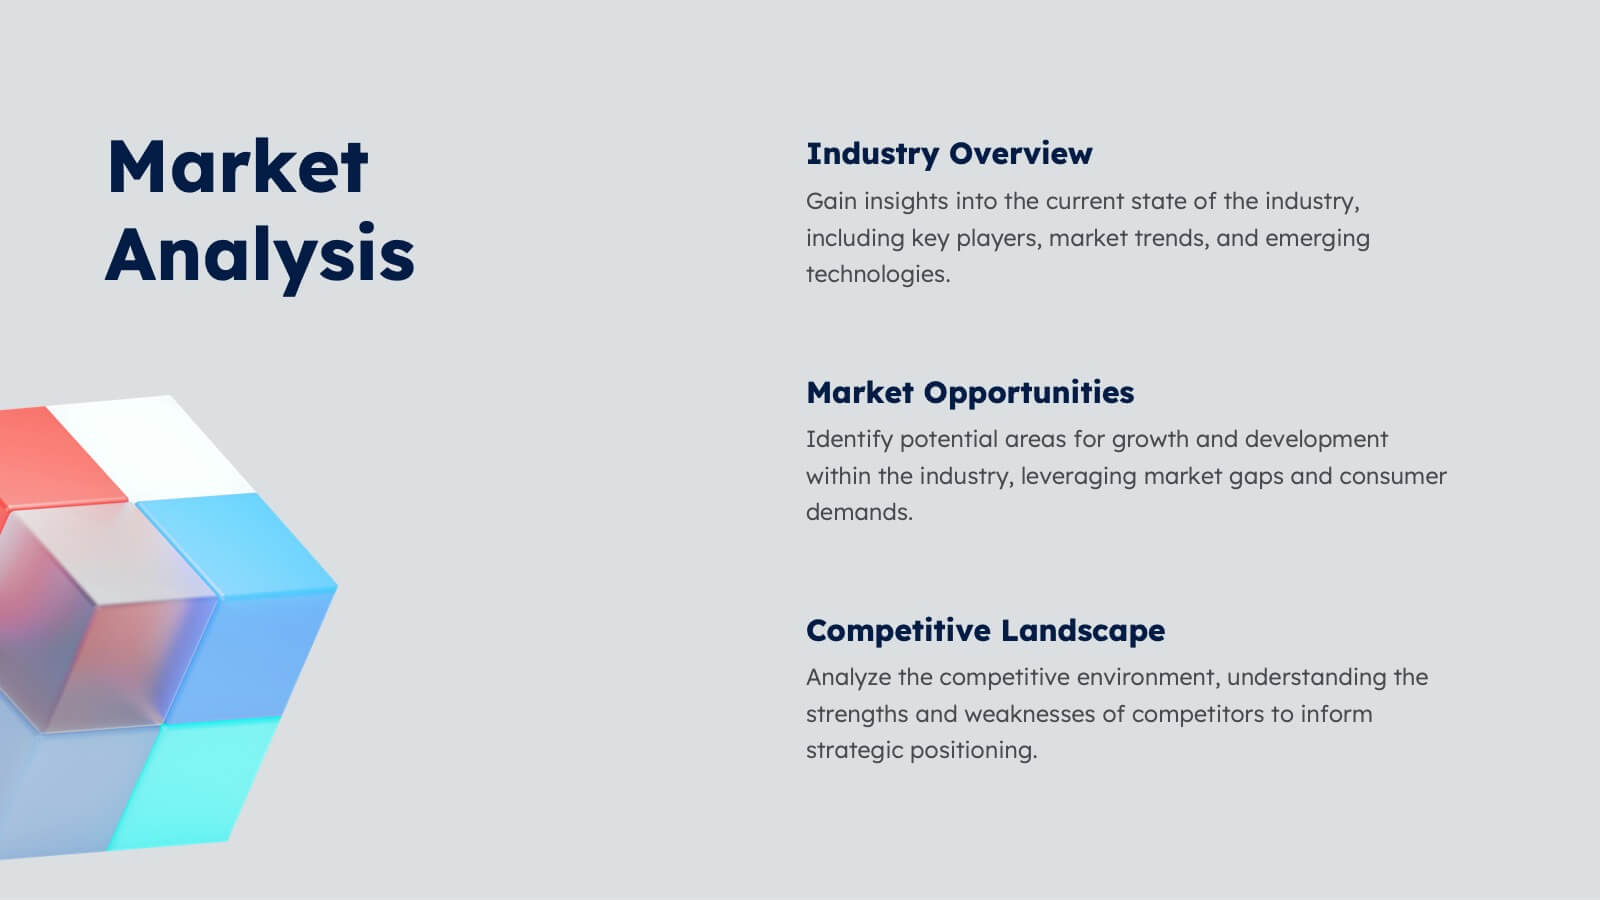
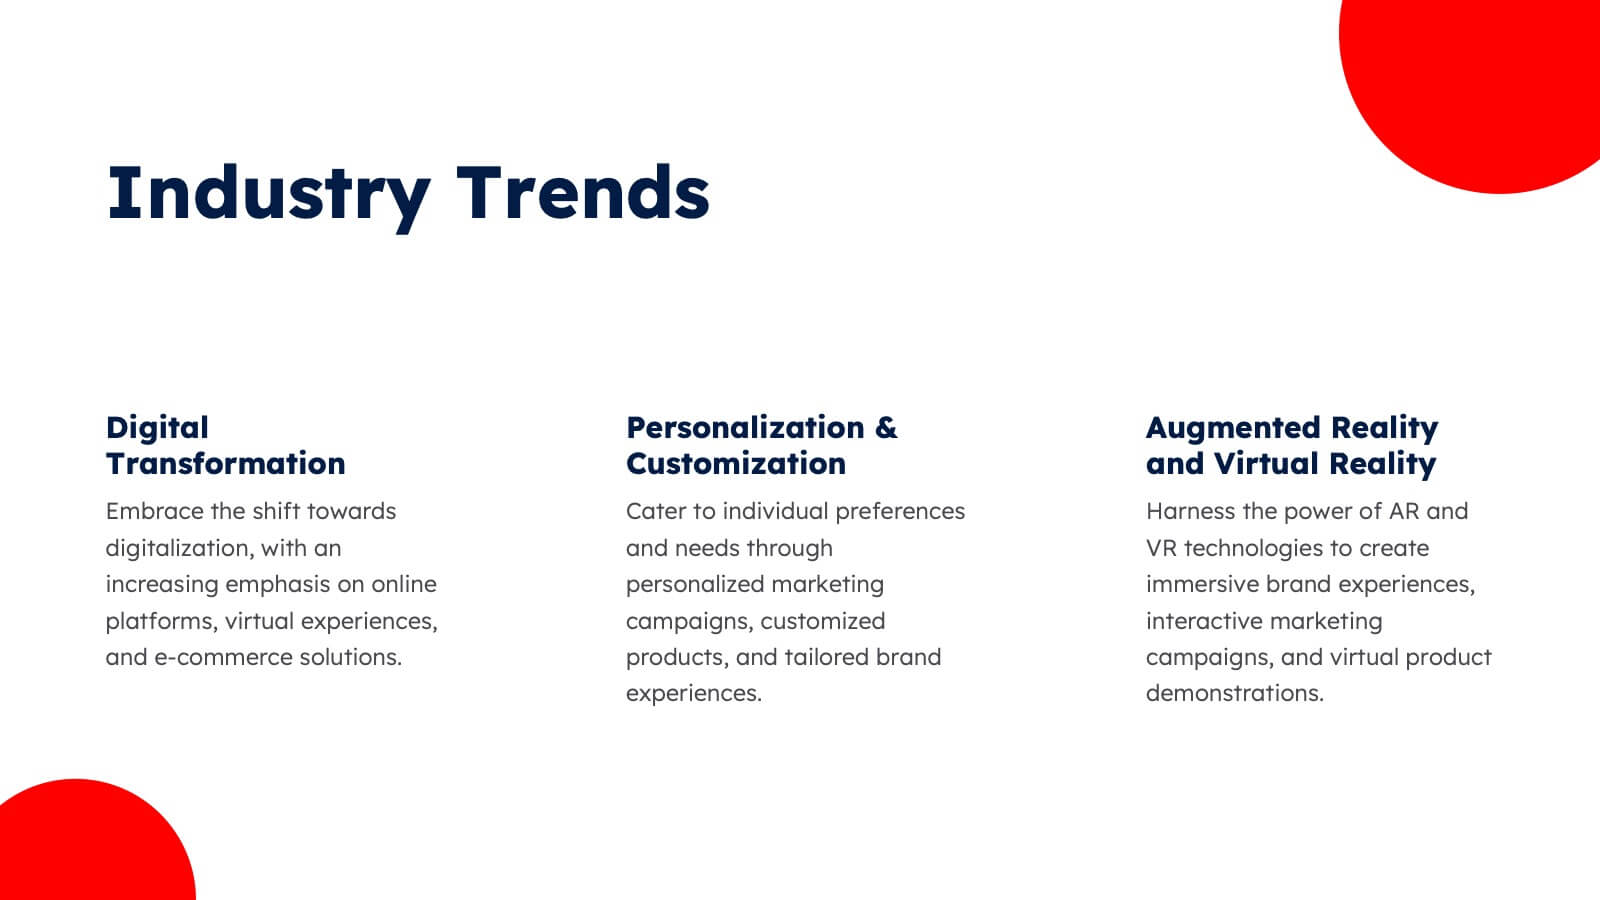
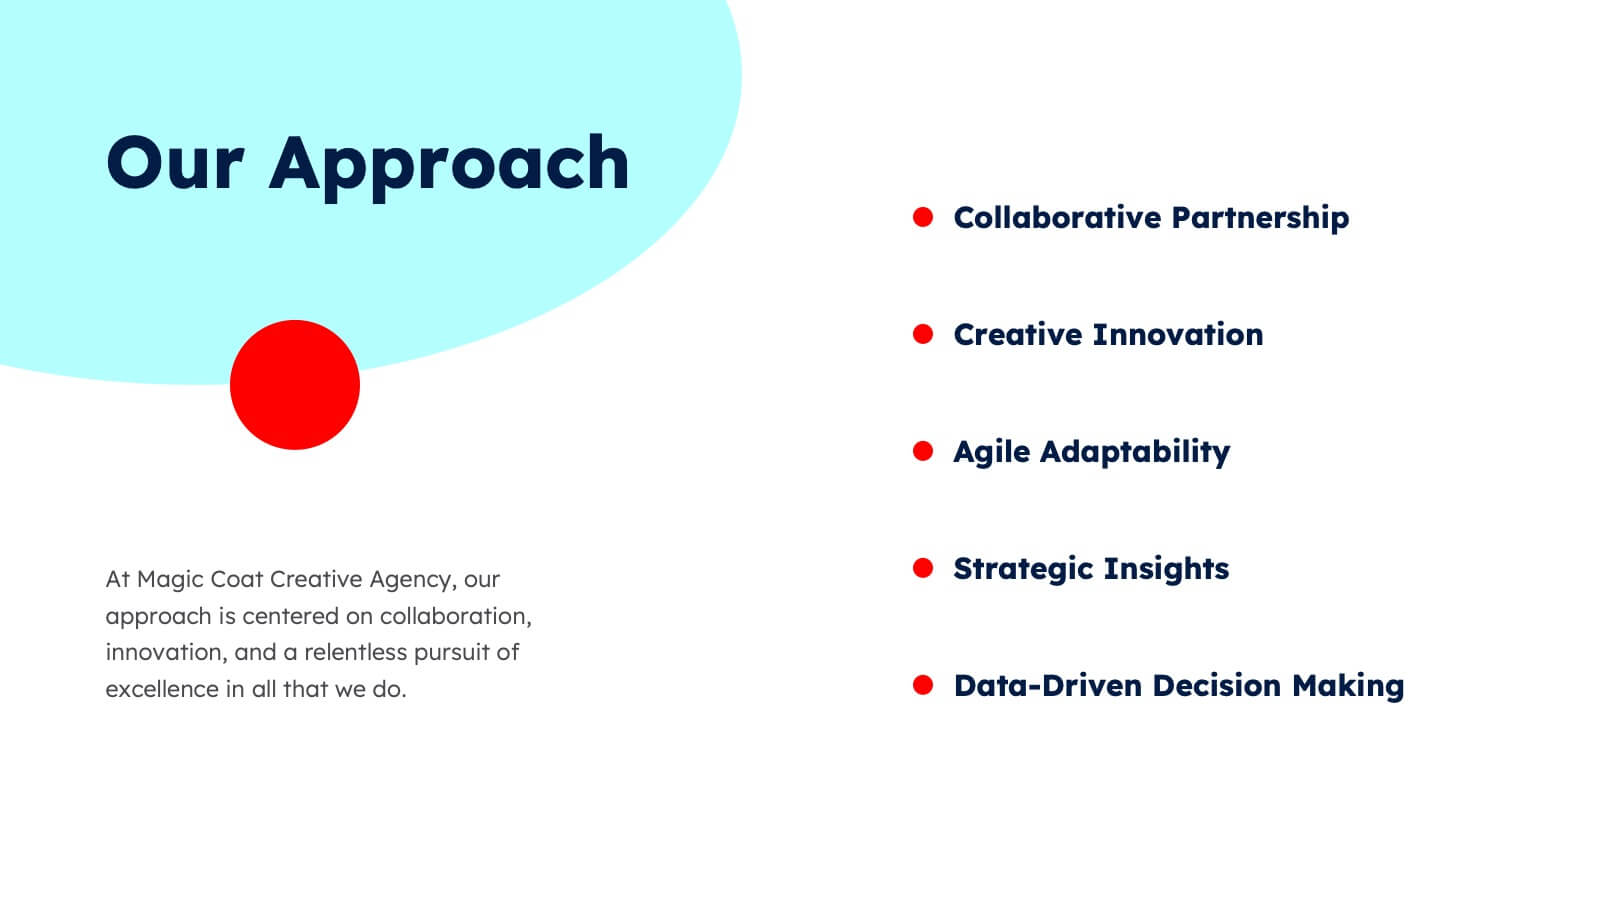
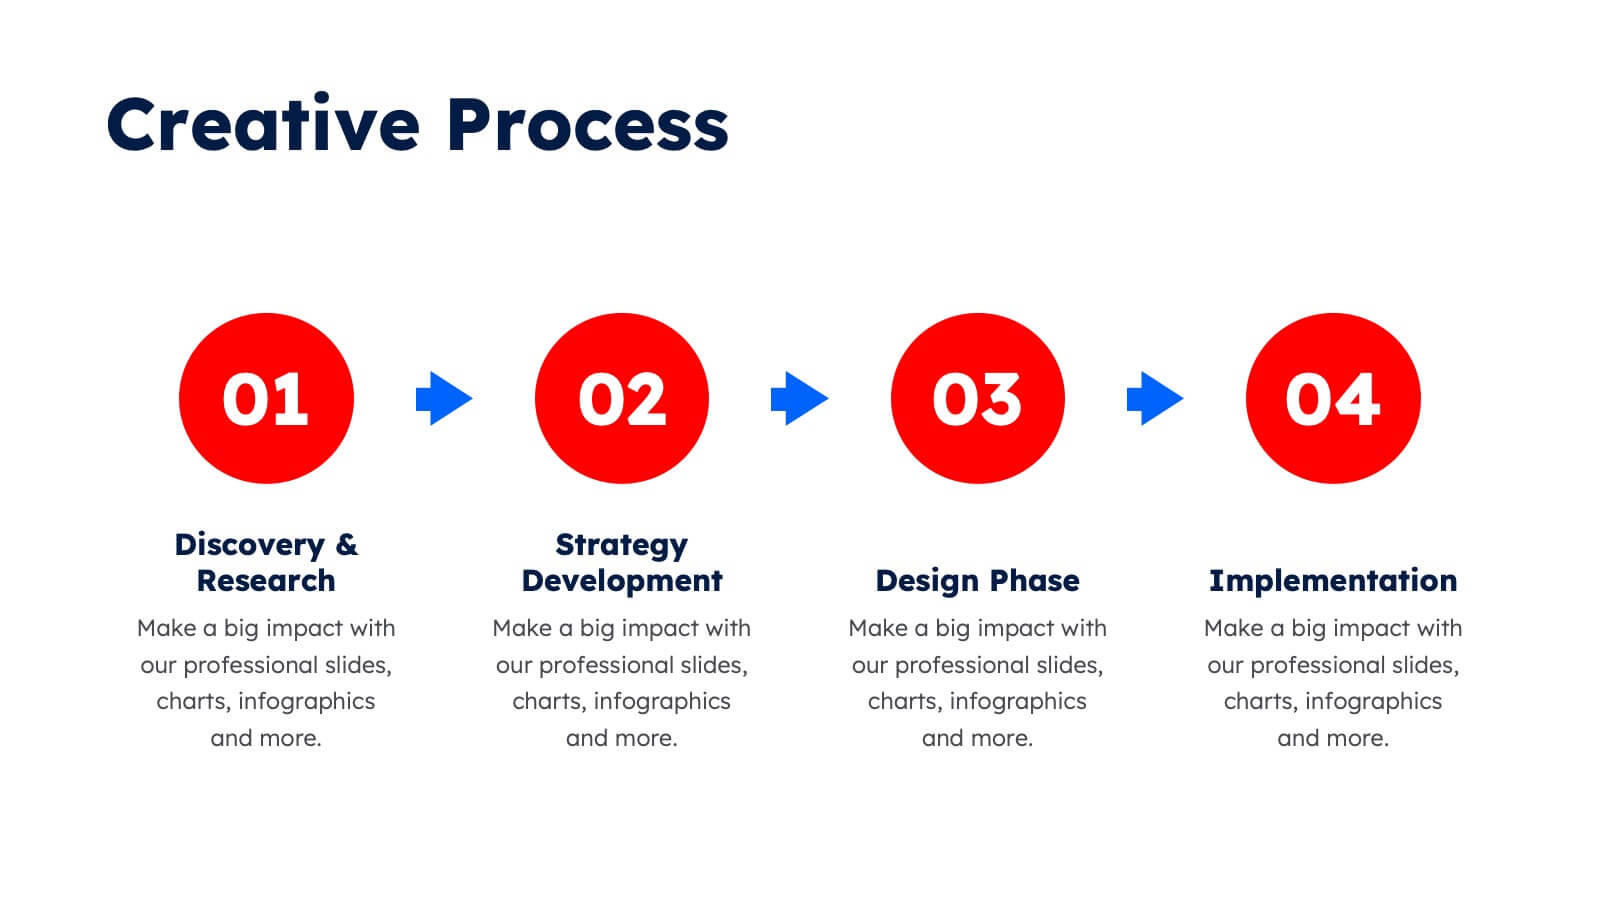
Showcase your agency's brilliance with this vibrant portfolio presentation template! Ideal for highlighting your mission, vision, case studies, and market analysis, it brings your achievements to life with colorful, engaging slides. Impress clients and partners with a well-structured, visually appealing narrative. Compatible with PowerPoint, Keynote, and Google Slides for easy use on any platform.


6 slides
Eco-Conscious Business Practice Overview Presentation
Communicate your sustainability initiatives with the Eco-Conscious Business Practice Overview Presentation. This modern infographic template features a 5-part petal leaf layout to display eco-friendly actions, green goals, or corporate values. Ideal for environmental reports, ESG updates, or internal awareness decks. Fully editable in Canva, PowerPoint, Keynote, and Google Slides.


4 slides
Personal Finance and Money Management Presentation
Effectively present Personal Finance and Money Management insights with this clean and professional slide template. Designed with a minimalist stopwatch infographic, this template helps visualize key financial principles like budgeting, saving, and investing. Fully customizable with editable text, colors, and icons, it’s perfect for business reports, financial workshops, or personal finance presentations. Compatible with PowerPoint, Keynote, and Google Slides for seamless editing.


5 slides
Information Technology Uses Infographics
Navigate the digital era with our information technology uses infographics, a synthesis of design and functionality. Presented in the trustworthy shades of blue and the vibrant hues of green, this template captures the essence of IT applications across spectrums. Whether you're an educator or tech enthusiast, these vertical, creatively designed infographics serve as a conduit to explain the intricacies of contemporary tech use. Compatible with Powerpoint, Keynote, and Google Slides. Complete with expressive icons and customizable image placeholders, this visual aid is crafted for clarity, making complex IT concepts engaging for audiences.


20 slides
Vitrumin Photography Portfolio Presentation
Showcase your creative work with this elegant and modern photography portfolio presentation template. Featuring essential slides such as an introduction, project highlights, creative process, awards, and client testimonials, this template is perfect for presenting your work professionally. Fully customizable and easy to edit, it's compatible with PowerPoint, Keynote, and Google Slides.


10 slides
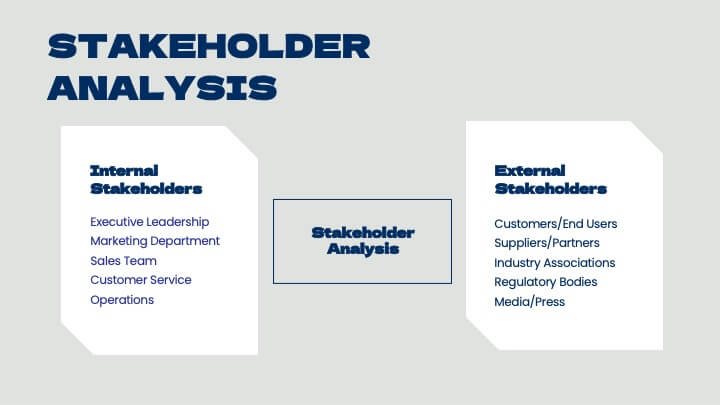
Customer Market Segmentation Strategy Presentation
Define and visualize your audience with the Customer Market Segmentation Strategy Presentation. This slide layout helps you categorize customer types using clean iconography and a central persona model. Ideal for marketing teams, sales strategists, or startup pitches. Customize easily in Canva, PowerPoint, Google Slides, or Keynote.


21 slides
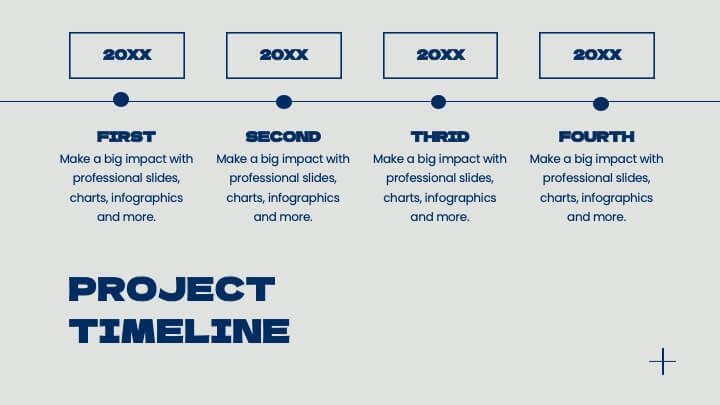
Minoan Project Timeline Presentation
Step back in time with this beautifully crafted Minoan-inspired presentation, perfect for outlining your project timeline! With an elegant design and clear structure, this template helps you showcase key milestones, deadlines, and deliverables in a visually stunning way. Keep your project on track. Compatible with PowerPoint, Keynote, and Google Slides.


20 slides
Uplift Content Marketing Pitch Deck Presentation
This content marketing presentation is designed to elevate your strategies to the next level! It covers everything from industry insights to the latest consumer behavior trends and SEO strategies. It helps streamline influencer marketing, data-driven approaches, and even includes sustainability in marketing. Perfect for PowerPoint, Keynote, and Google Slides presentations!


5 slides
IT Service Operations Strategy Presentation
Streamline your IT presentations with the IT Service Operations Strategy Presentation template. This structured layout is designed to showcase key service operation metrics, strategies, and performance indicators in a visually engaging format. Ideal for IT teams, service managers, and business analysts, this slide helps simplify complex IT processes with clear data points and percentages. Fully customizable in PowerPoint, Keynote, and Google Slides for effortless adaptation to your needs.


7 slides
Company Profile Infographic
This collection of company profile templates is designed to meet the diverse needs of various businesses, providing an efficient and polished method for presenting a company's identity, accomplishments, and offerings. Each template is meticulously crafted to cater to different professional contexts, making them suitable for annual reports, investment summaries, or internal briefings. Structured for clarity, these templates enable businesses to effectively communicate essential details such as company history, objectives, and the breadth of services or products offered. They are also equipped to showcase crucial statistics like employee numbers, significant achievements, and organizational hierarchy, enhancing the overall presentation. The design blends modern aesthetics with functionality, incorporating a professional color palette and clean layout that holds viewer interest and enhances readability. Customization is straightforward, allowing for easy adjustments in colors, fonts, and design elements to align with specific brand identities. Ideal for corporations looking to convey their market stance and engage potential clients, investors, or prospective employees, these templates serve as a vital tool in creating impactful and informative company profiles.


6 slides
Six Sigma DMAIC Method Presentation
Bring clarity and momentum to your improvement plan with this dynamic presentation, designed to visually guide teams through each stage of a structured problem-solving process. It helps you present goals, insights, and actions with confidence while keeping the workflow clear and engaging. Fully compatible with PowerPoint, Keynote, and Google Slides.


6 slides
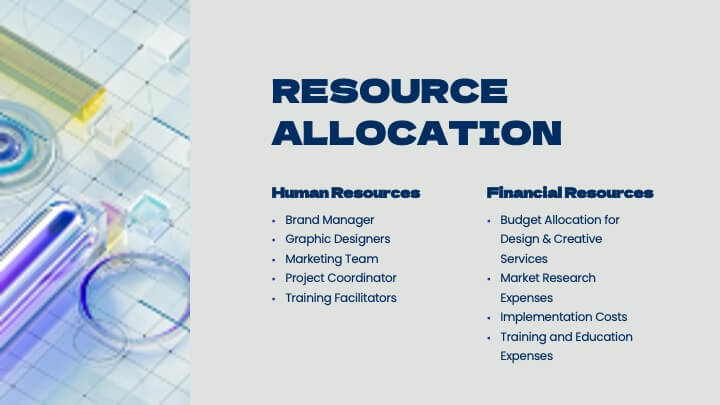
Visual Resource Allocation Gantt
Easily map out team workload over time with the Visual Resource Allocation Gantt Presentation. This slide helps you assign tasks across monthly intervals, track resource distribution, and identify scheduling conflicts. Perfect for project managers, department heads, and HR planners aiming to balance capacity and timelines. Fully editable in PowerPoint, Keynote, and Google Slides.


7 slides
Target Market Segmentation Infographic Presentation
A Target Market refers to a specific group of customers or consumers that a company or organization aims to sell its products or services too. This template has a design that can compliment your company's or organization's branding elements to make it a professional looking presentation. This template is perfect for the audience with in-depth knowledge of marketing; the template allows you to include important facts and statistics that will make it easily understandable by all types of audiences. The template comes with different chart slides, nice color combinations and graphs!


24 slides
Kepler Investor Pitch Presentation
Impress potential investors with this thoughtfully crafted investor pitch presentation template. Its sleek design is tailored to captivate attention while delivering a clear and concise narrative about your business. Highlight key sections, including your company overview, problem statement, and innovative solutions, all designed to set you apart from the competition. Dive deep into your market opportunities, target audience, and revenue model, using visually engaging layouts and infographics. Showcase growth projections, financial overviews, and funding requirements with clarity and professionalism. Additionally, present your unique selling proposition, milestones, and risk analysis effectively. With dedicated slides for team introductions and a compelling close, this template is perfect for startups and established businesses alike. Fully customizable and compatible with PowerPoint, Google Slides, and Keynote, it ensures seamless branding and adaptability for any presentation. Engage your audience and secure the investment you need!