


Features
- 6 Unique slides
- Fully editable and easy to edit in Microsoft Powerpoint, Keynote and Google Slides
- 16:9 widescreen layout
- Clean and professional designs
- Export to JPG, PDF or send by email


Do you have any questions?
Recommend


6 slides
Financial Report Summary Presentation
Showcase key financial highlights with the Financial Report Summary slide. Featuring a central moneybag icon surrounded by currency symbols, this layout is ideal for presenting up to five critical financial insights or revenue sources. Each label is paired with editable titles and descriptions to keep your content clear and relevant. Fully compatible with PowerPoint, Keynote, and Google Slides for effortless customization.


5 slides
Alcohol Effects Infographics
Alcohol can have various effects on the body and mind, depending on the amount consumed, the individual's tolerance, and other factors. These unique vertical Infographics provide information about the physical, psychological, and social effects of alcohol use. They are designed to educate people about the risks of drinking too much and the consequences of alcohol abuse. To help you present your data these include statistics, illustrations, and other visual aids to help your audience understand the impact of alcohol on their health. By providing information about the effects of alcohol, this helps people make informed decisions about alcohol use.


5 slides
Innovation in Digital Technologies Presentation
Highlight key advancements with this Innovation in Digital Technologies Presentation. Designed with four modern icon segments, this slide helps communicate your digital transformation journey clearly. Ideal for showcasing emerging tools, platforms, or strategies. Fully editable in Canva, PowerPoint, or Google Slides for seamless integration into any tech-focused presentation.


26 slides
Soren Presentation Template
Soren is a cool, clean, simple easy to use template. This beautiful template is great for all types of businesses and creative projects. The colors are bold and simple to capture the audience needs. Soren is a multipurpose theme that can be used to capture the attention of your clients in a friendly, unique way. This template is a minimalistic design to attract your customers. The simple text, charts and tables make it easy to customize this template to match your brand. Whether you’re in need of a business presentation, newsletter or even social media posts – Soren is the perfect fit for you.


5 slides
Food Waste in School Infographics
Food Waste in schools is a significant issue that can have economic, environmental, and social impacts. These vertical infographics aim to raise awareness about the magnitude of the problem and provide actionable steps to reduce food waste in schools. These can be used as valuable tools to highlight the issue of food waste in school environments. The visually appealing illustrations, informative content, and color schemes make it effective for raising awareness and promoting sustainable practices in school environments. Compatible with Powerpoint, Keynote, and Google Slides.


20 slides
Legendra Artist Portfolio Presentation
Showcase your creative journey with this dynamic artist portfolio presentation template. Highlight your featured projects, creative process, collaborations, and pricing in a visually engaging format. Perfect for artists, designers, and creative professionals looking to impress potential clients. Fully editable in PowerPoint, Keynote, and Google Slides.


5 slides
Sport Illustrated Infographics
Sport Illustrated Infographics is a bold, colorful, and modern presentation

20 slides
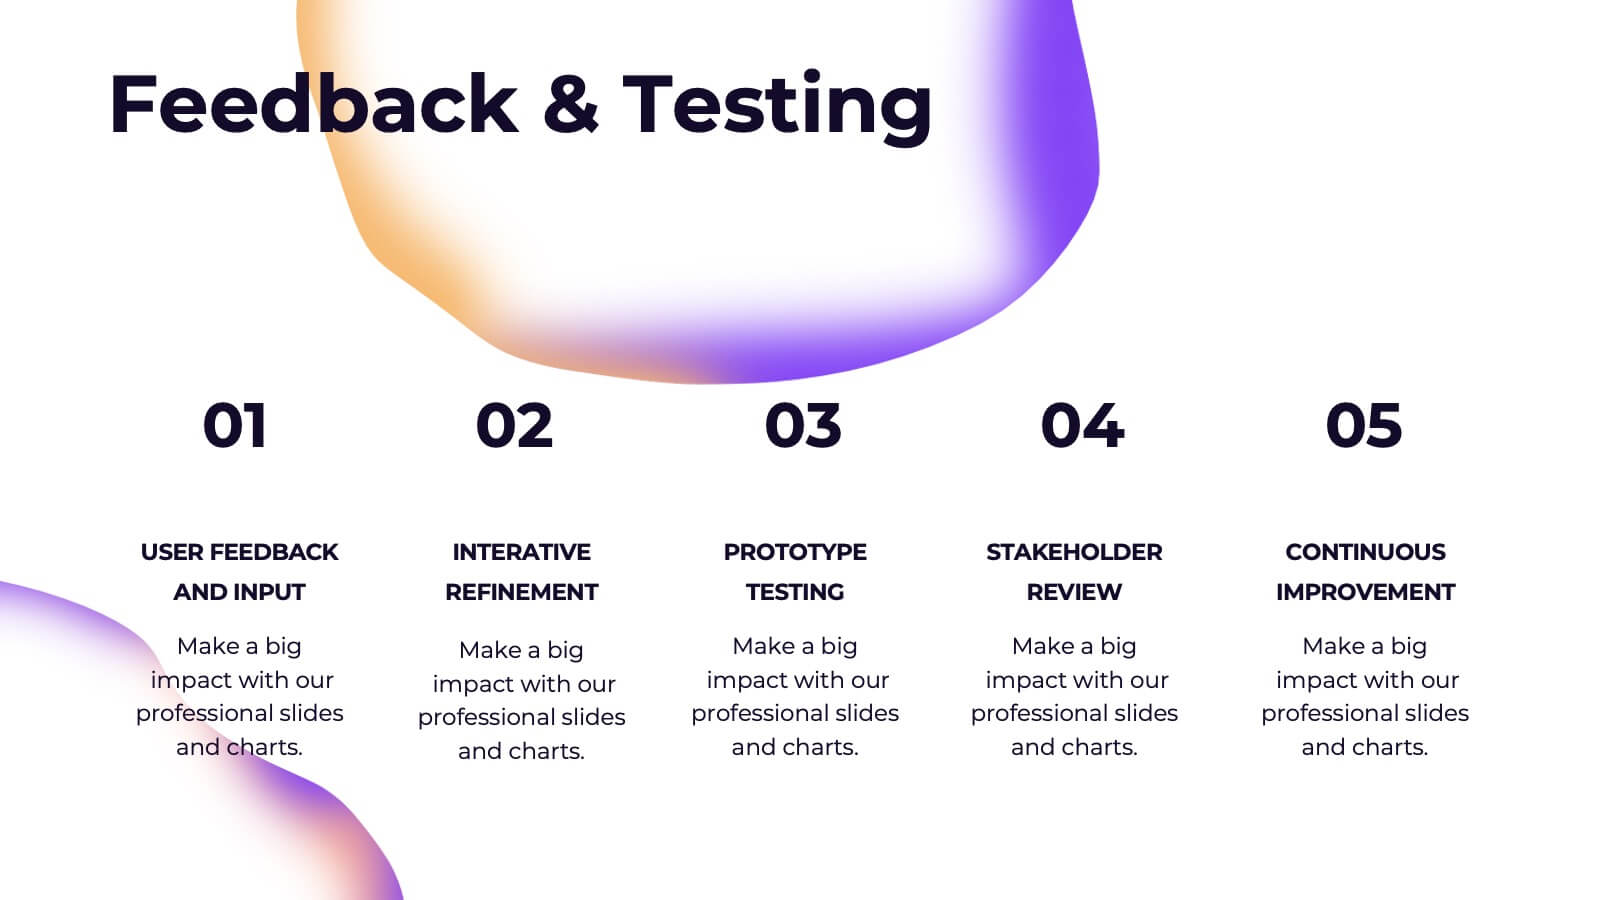
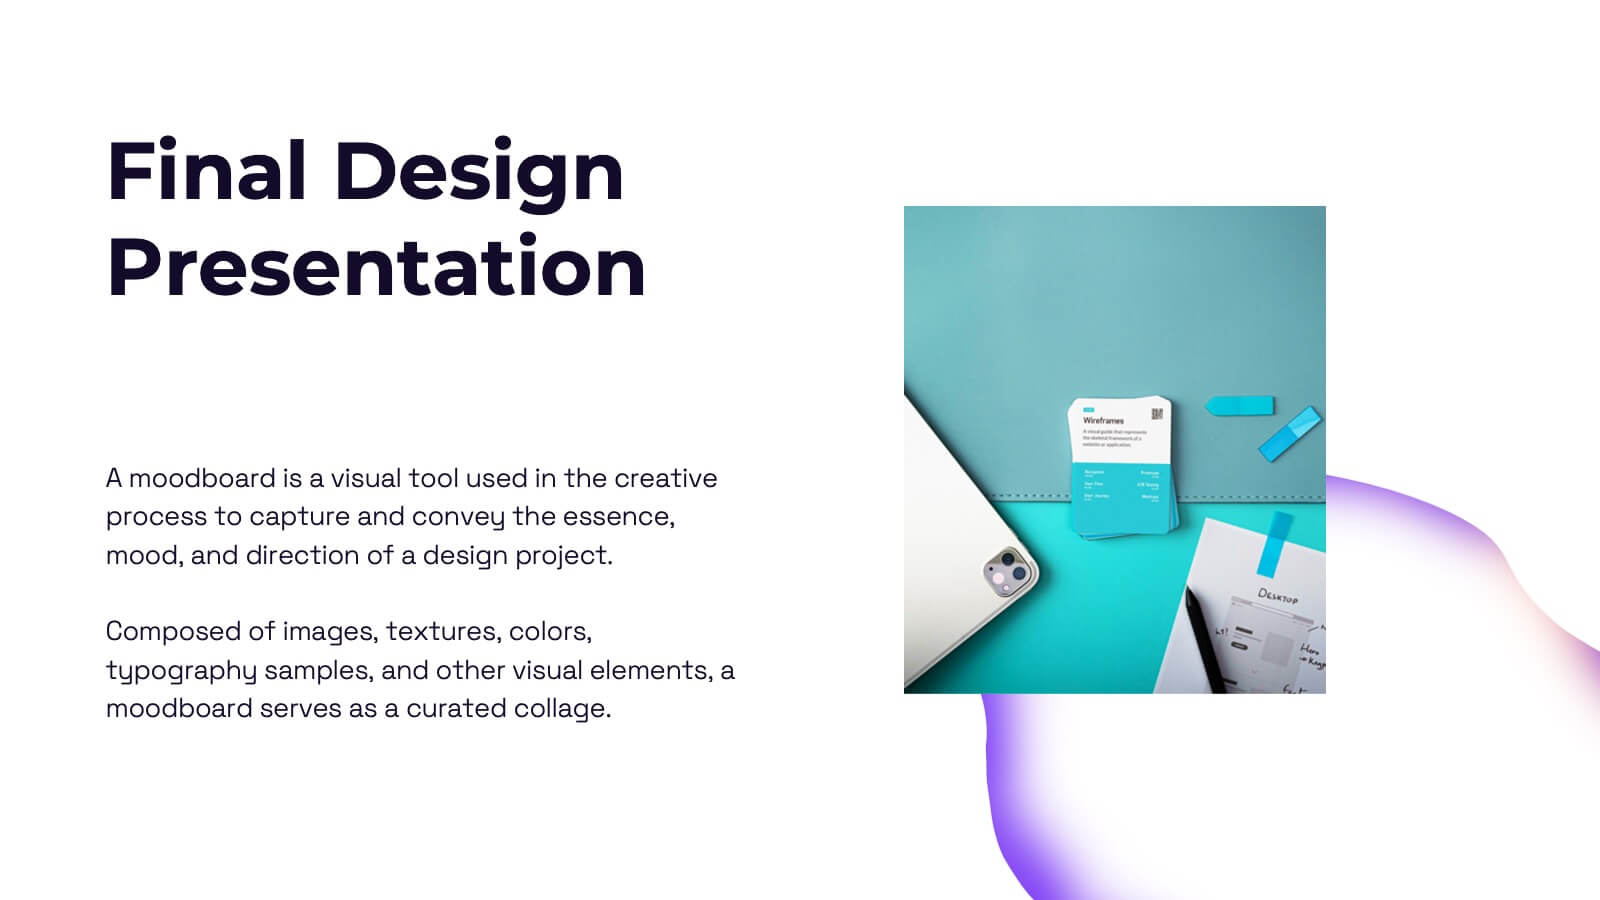
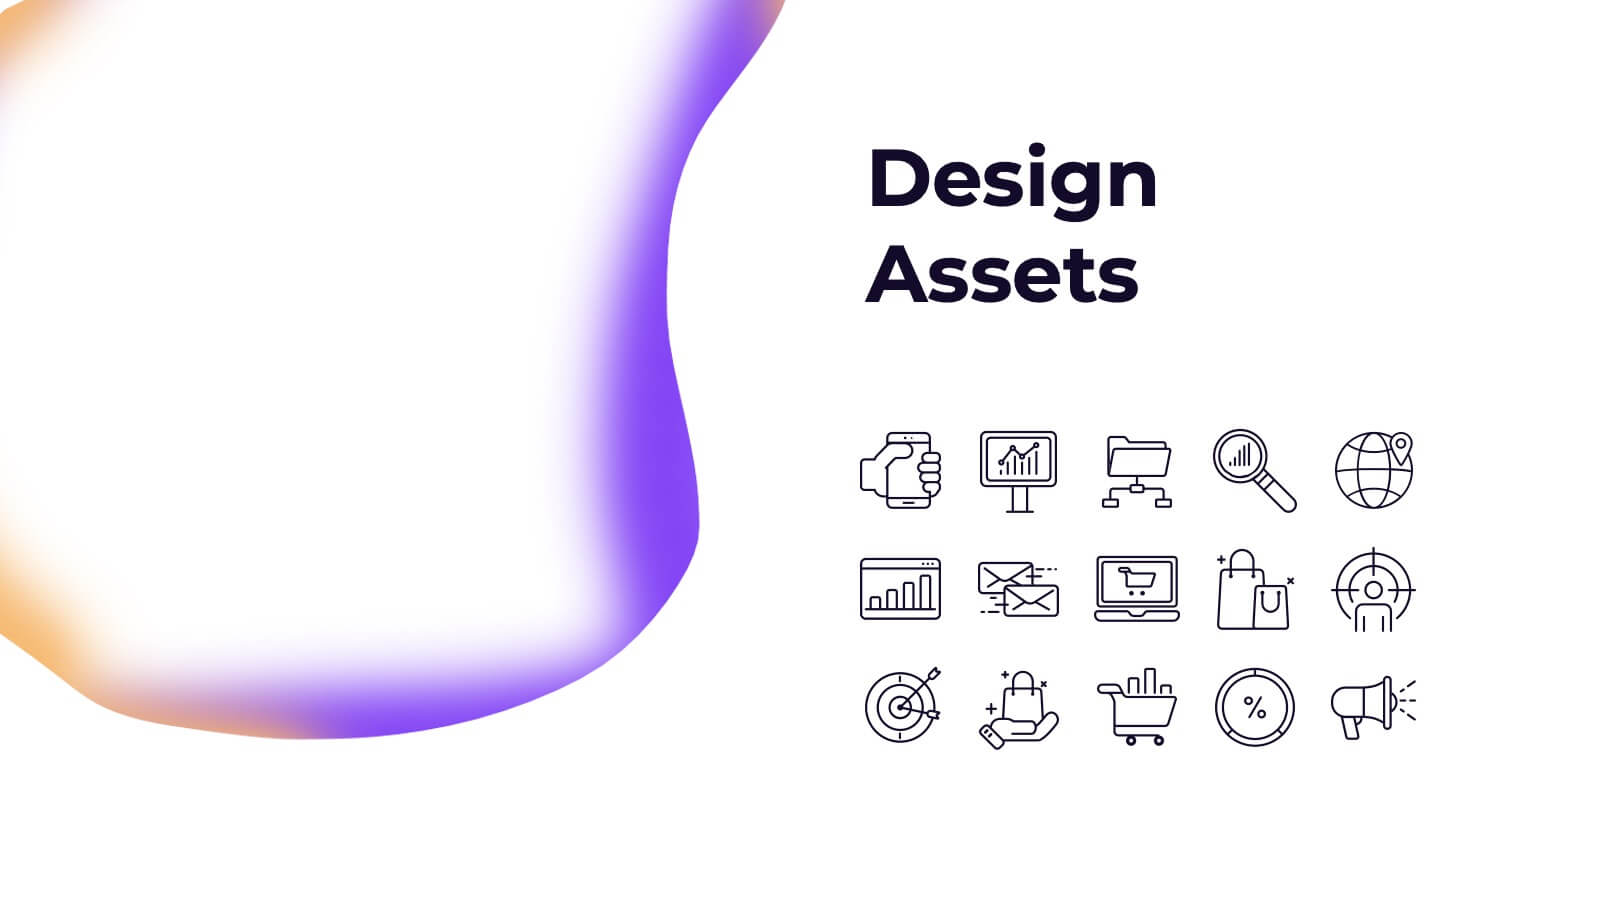
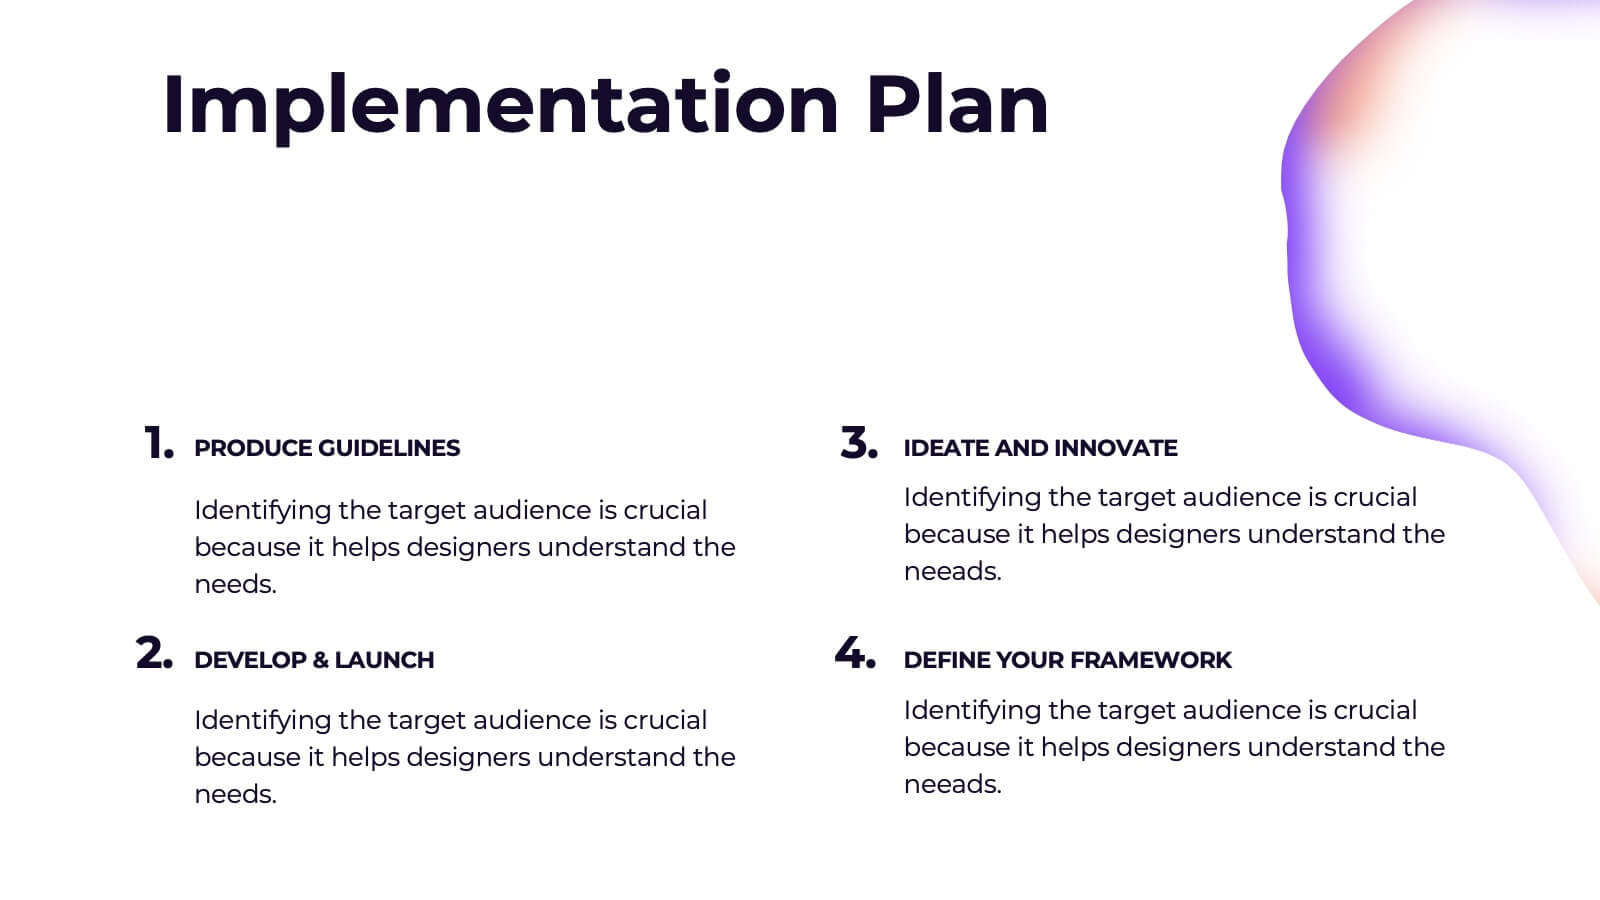
Valkyrie Design Strategy Proposal Presentation
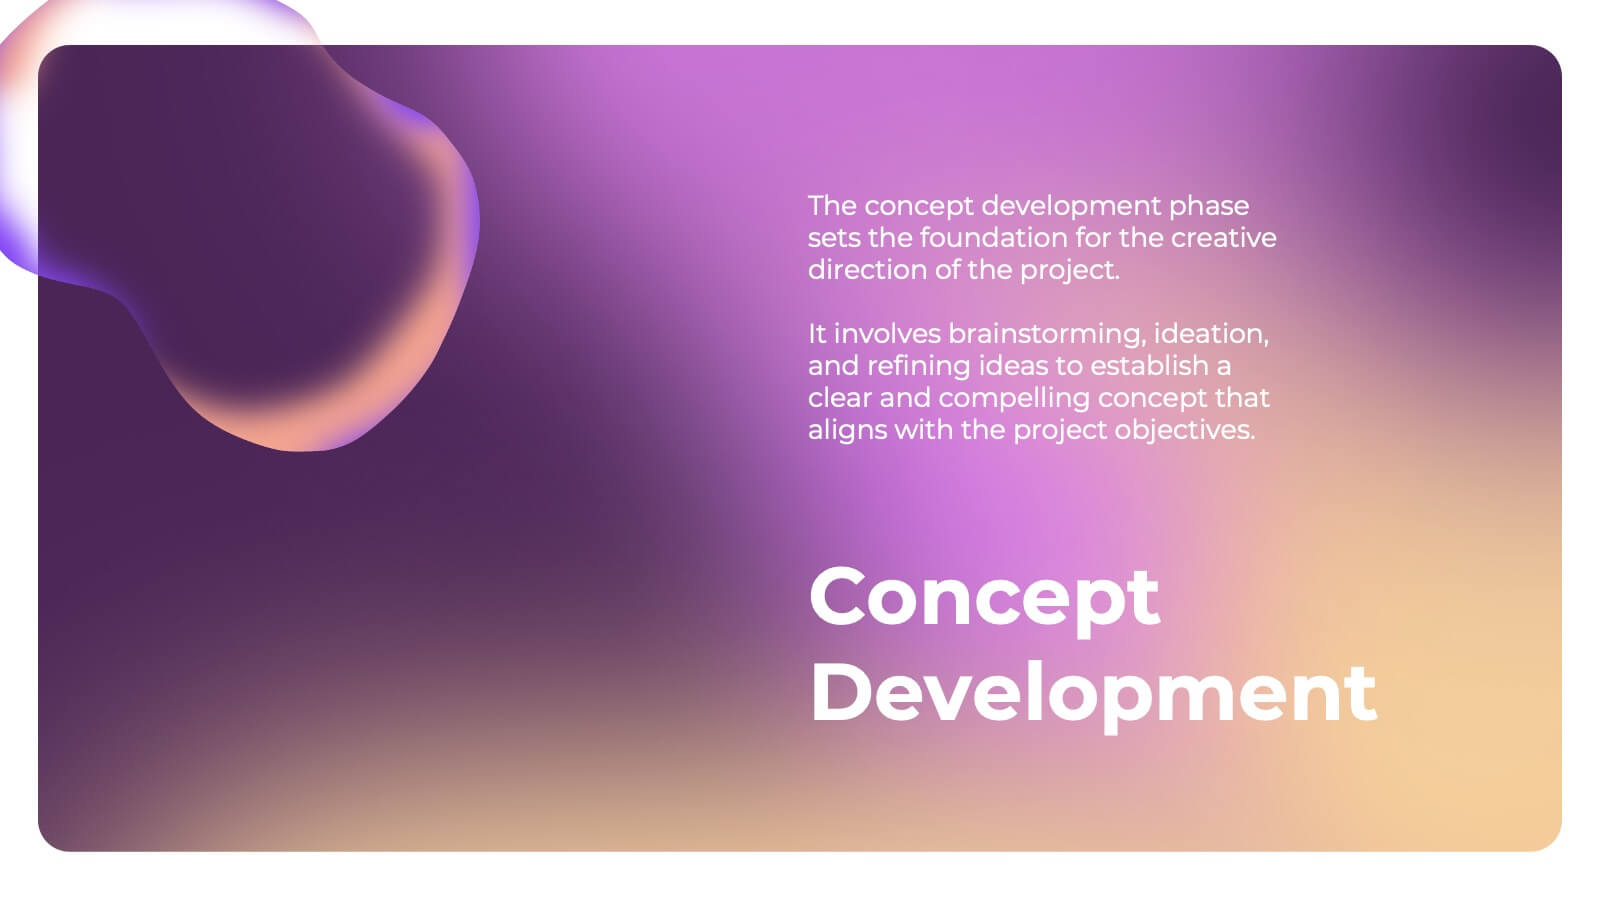
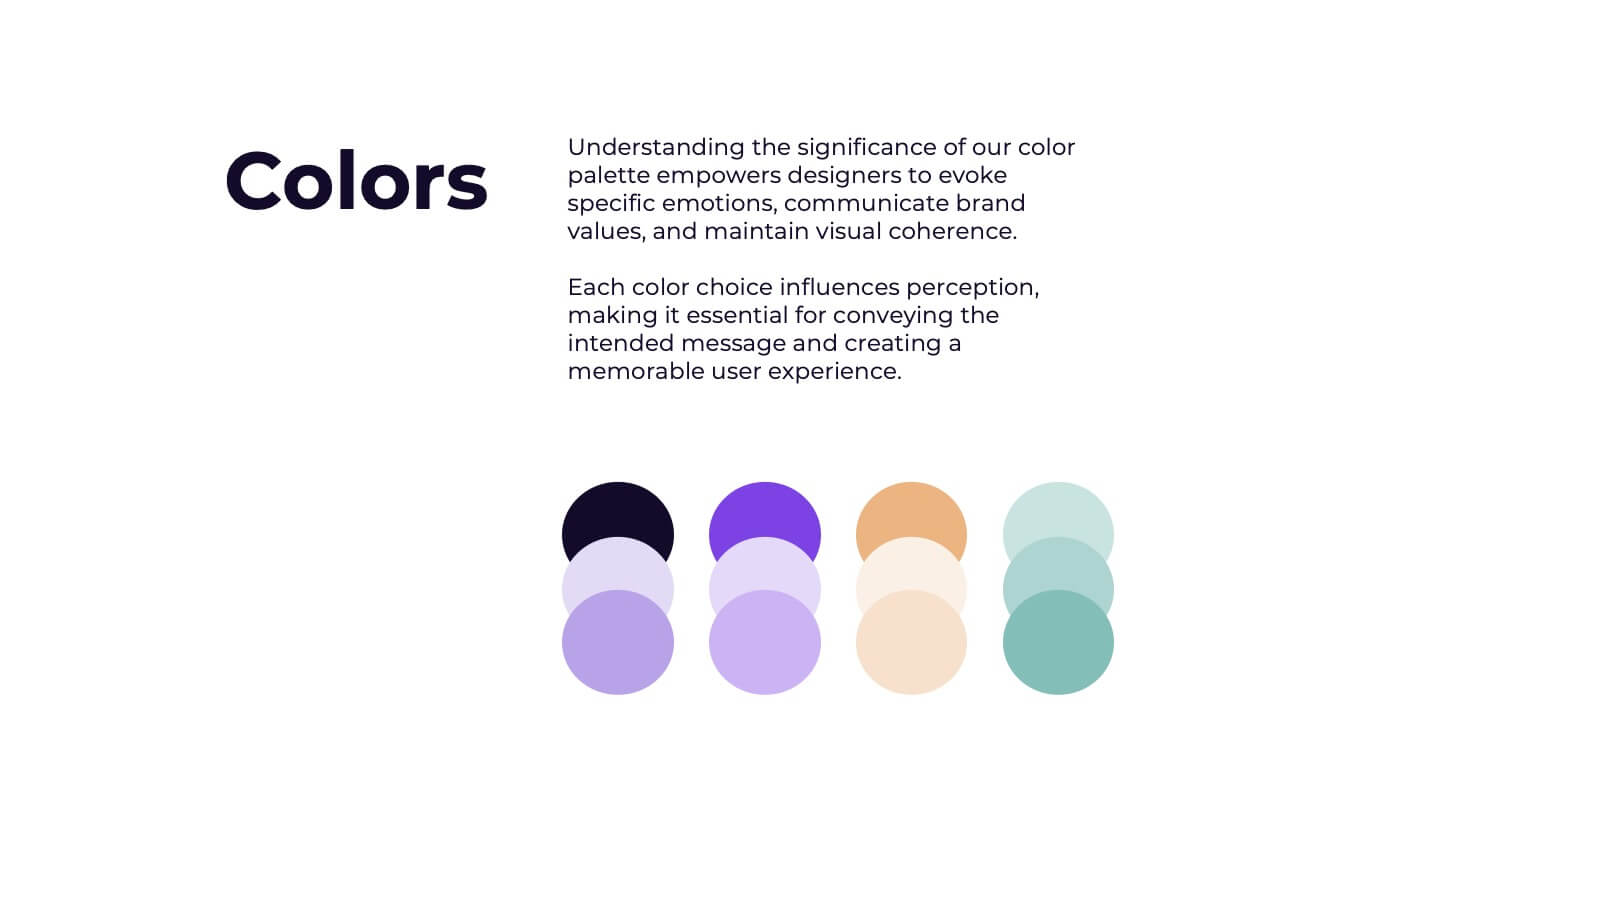
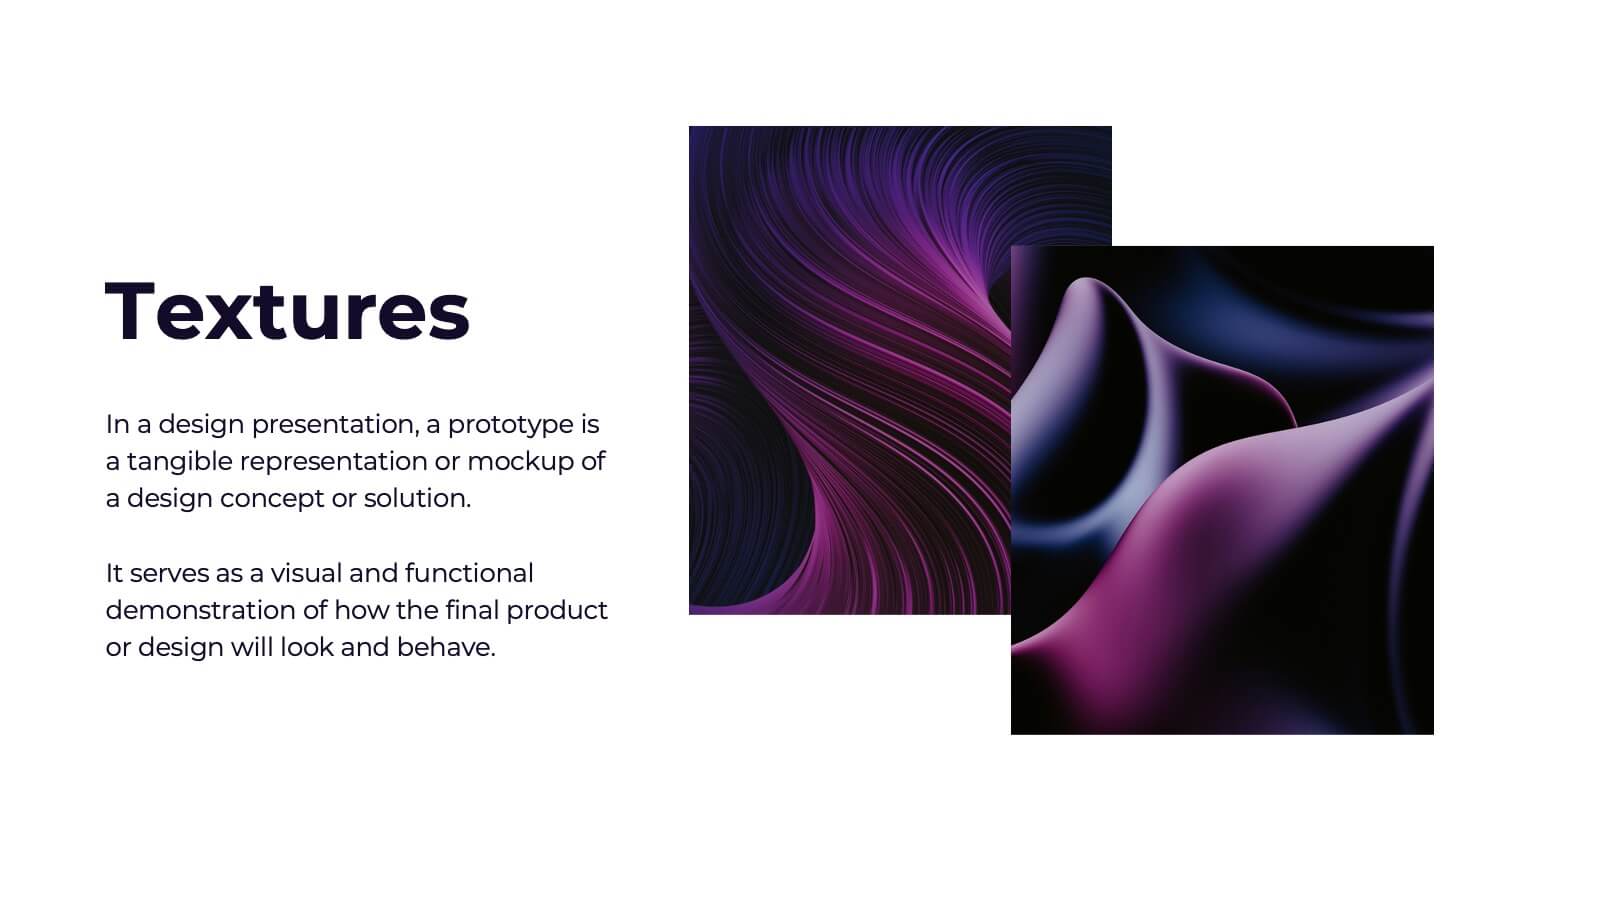
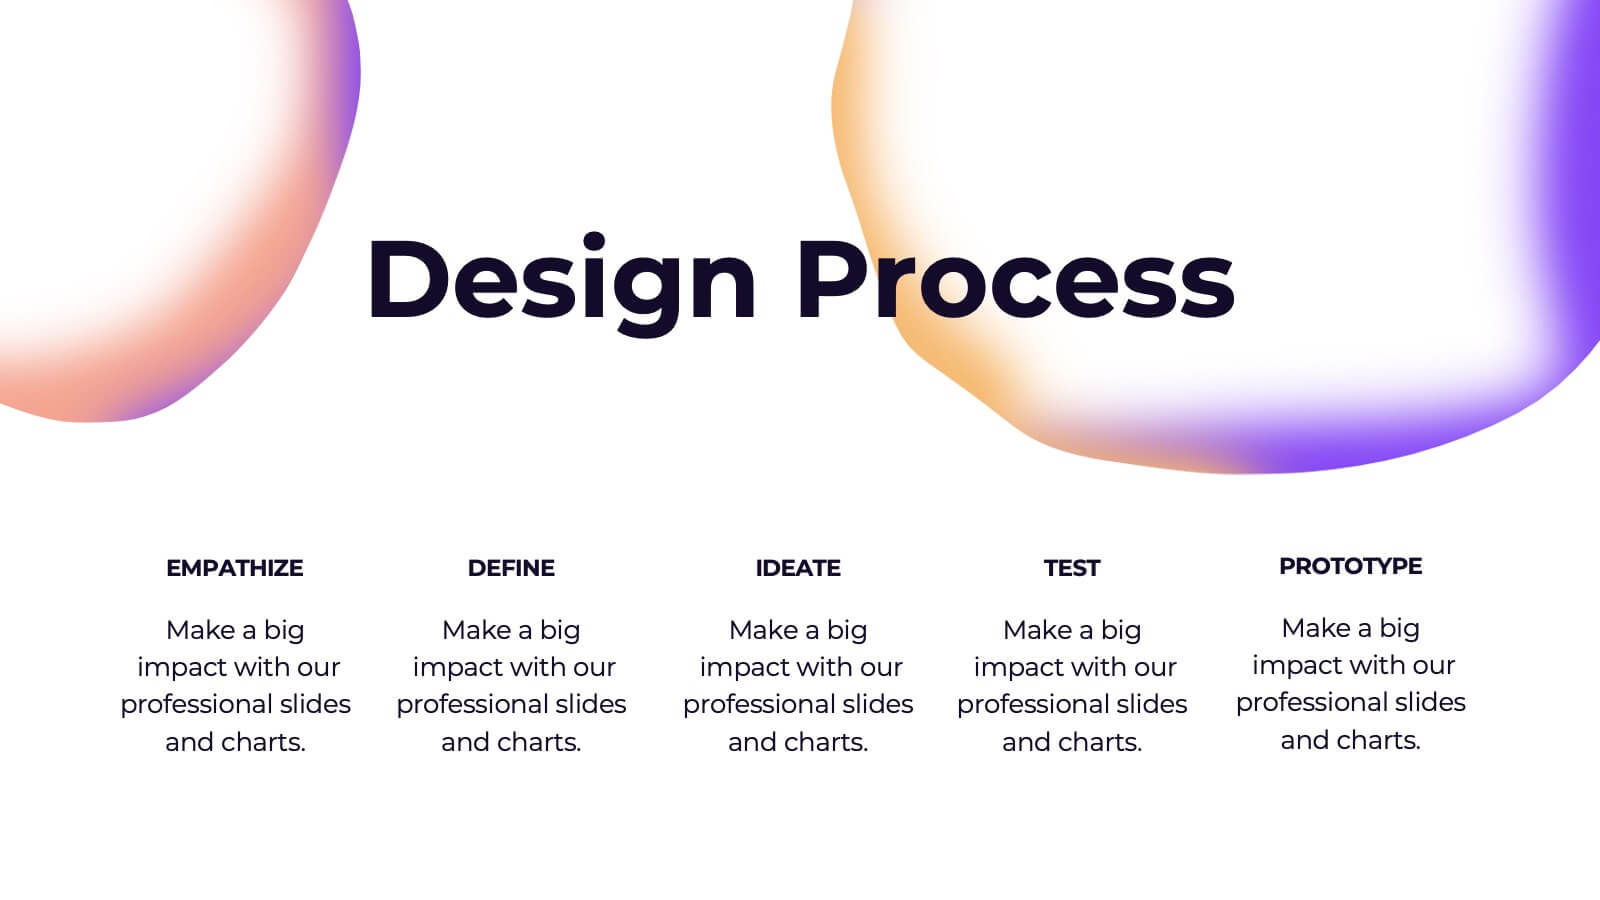
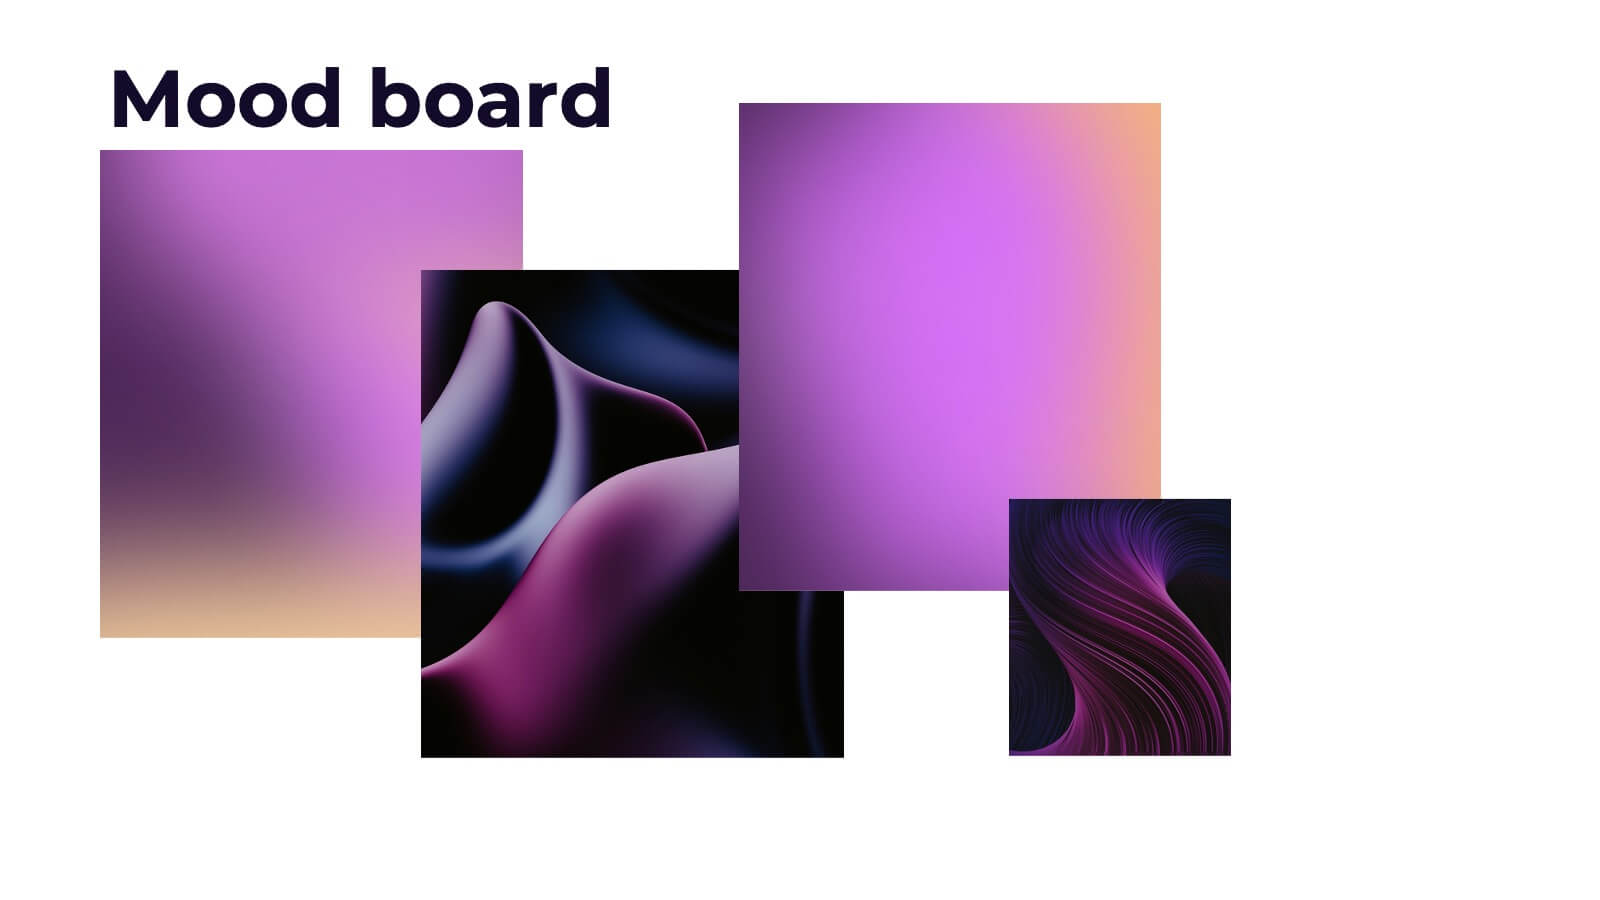
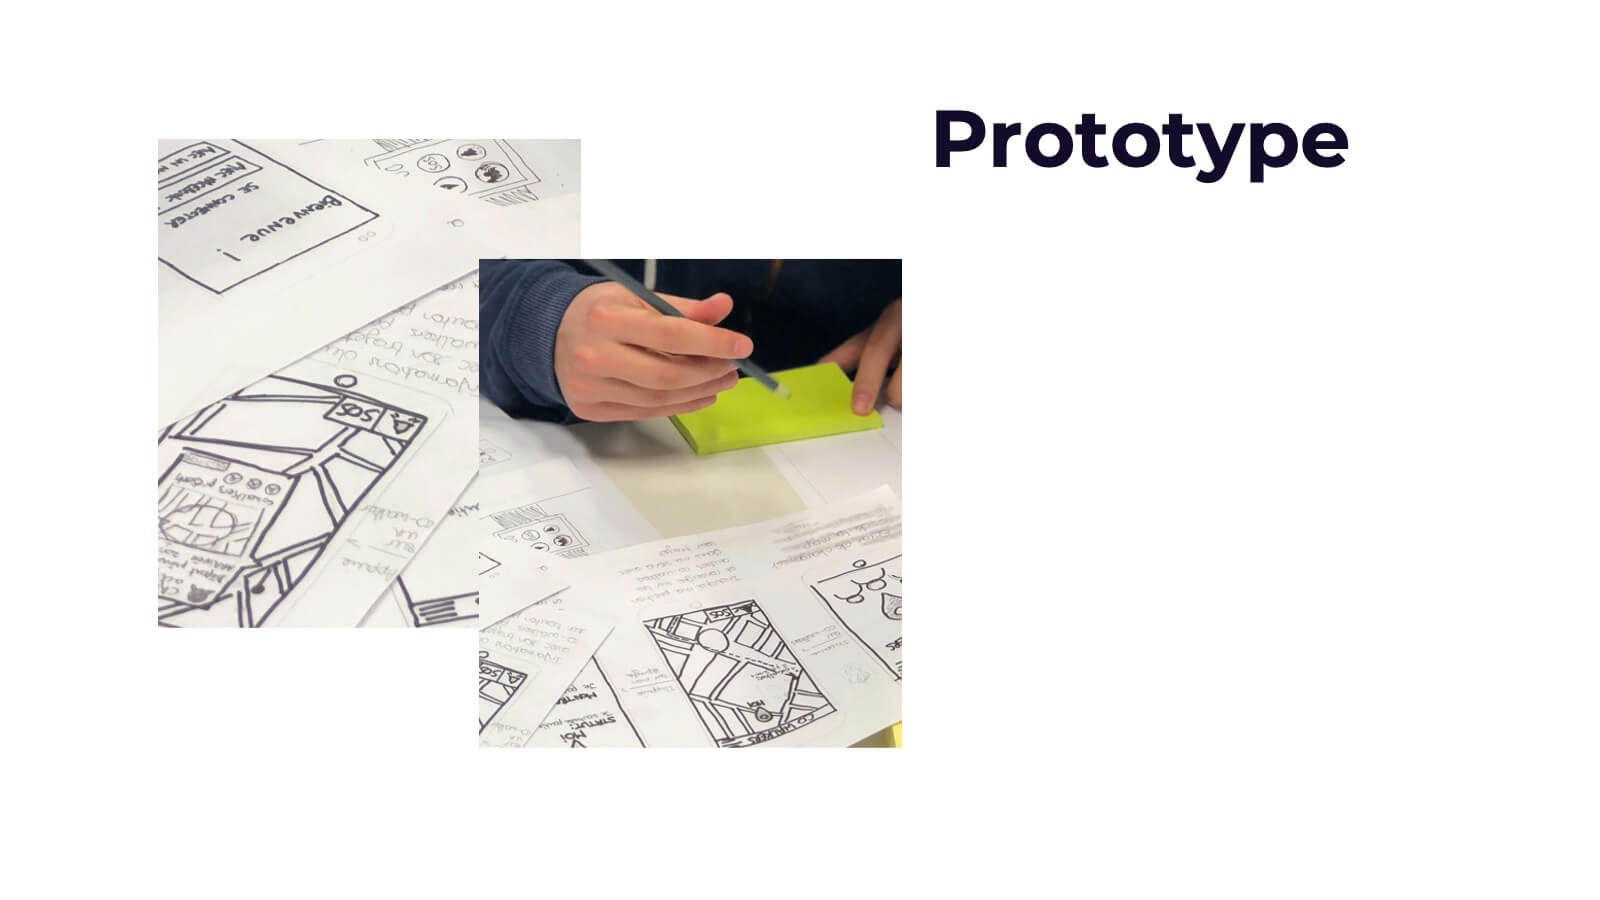
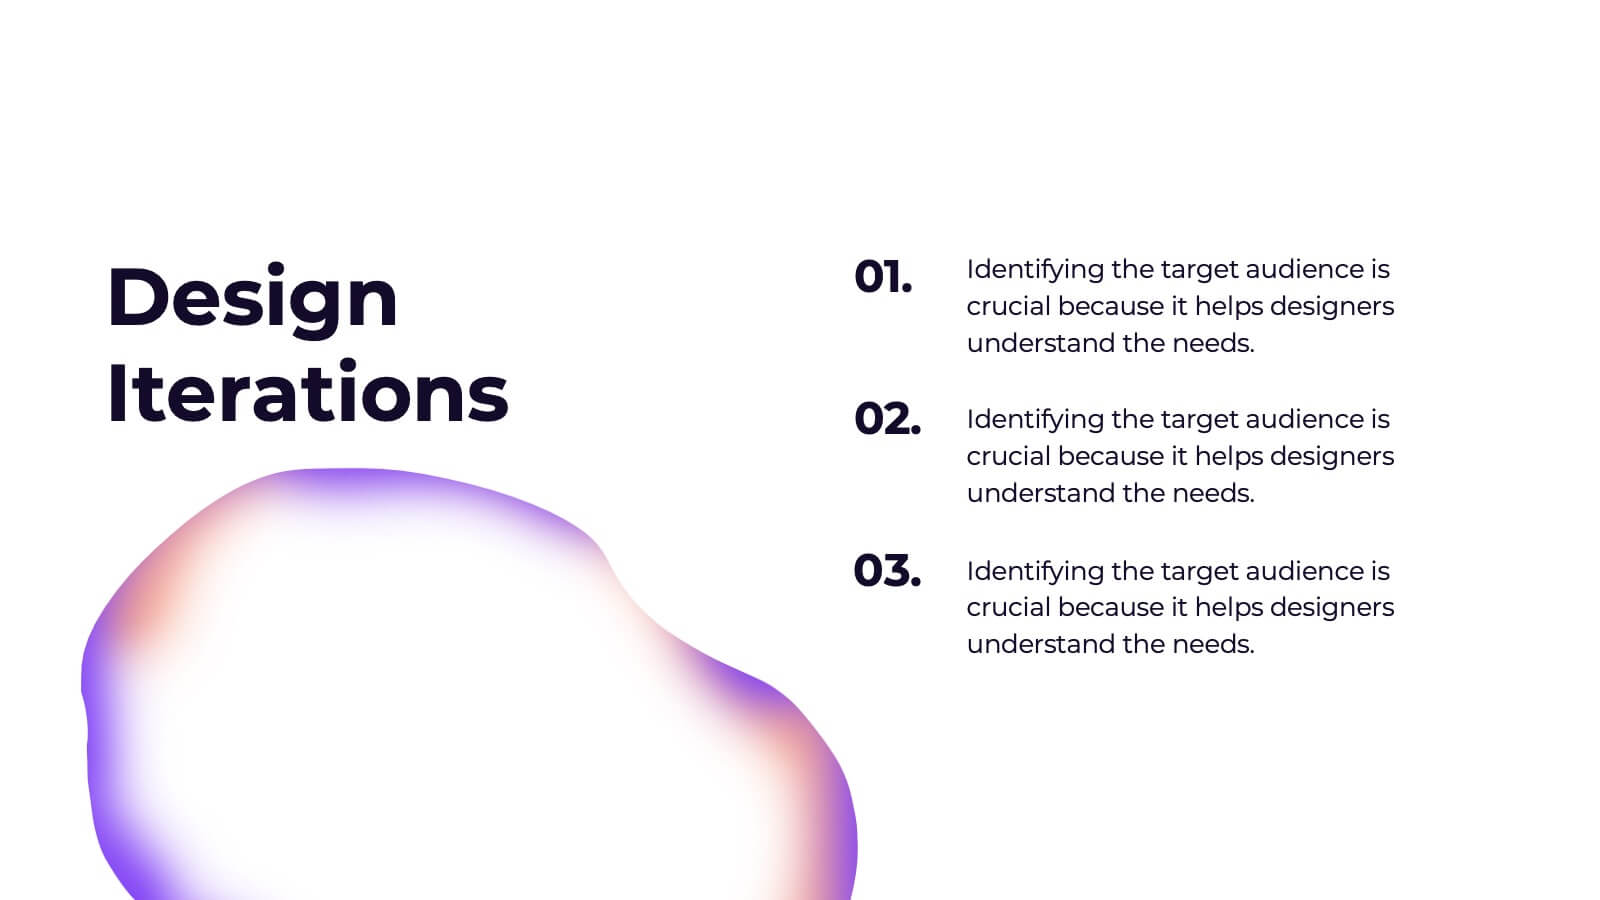
Elevate your design strategy presentations with this visually captivating and modern template! It covers every step of the design process, from concept development and mood boards to prototype iterations and feedback. Ideal for showcasing design elements, textures, and assets, this template is perfect for creative professionals. Compatible with PowerPoint, Keynote, and Google Slides for easy, polished presentations.

21 slides
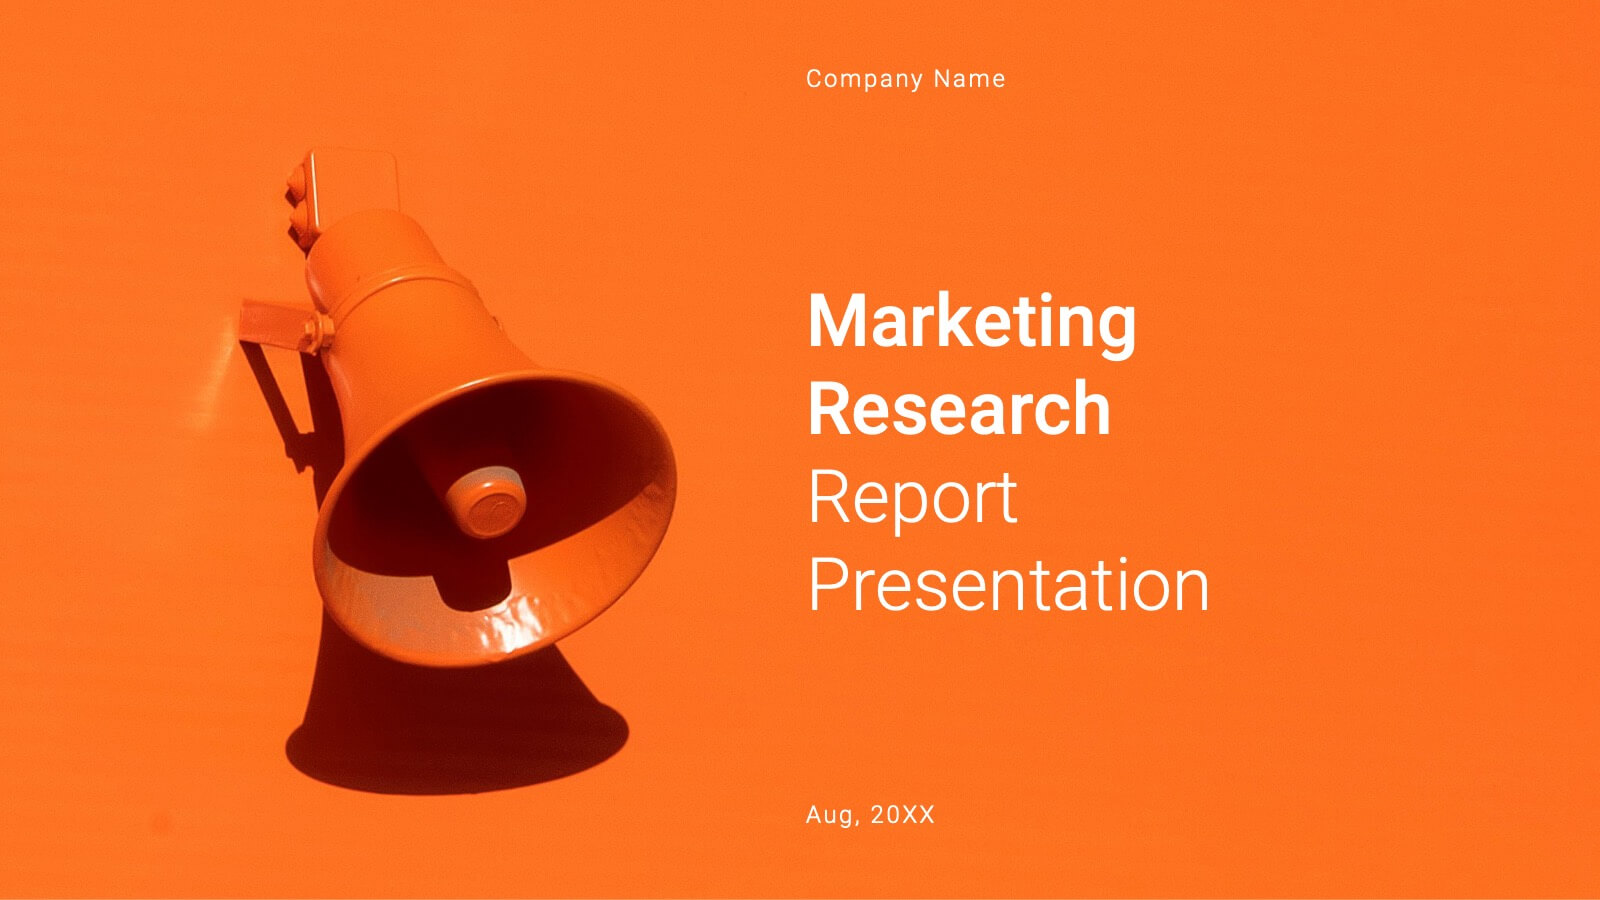
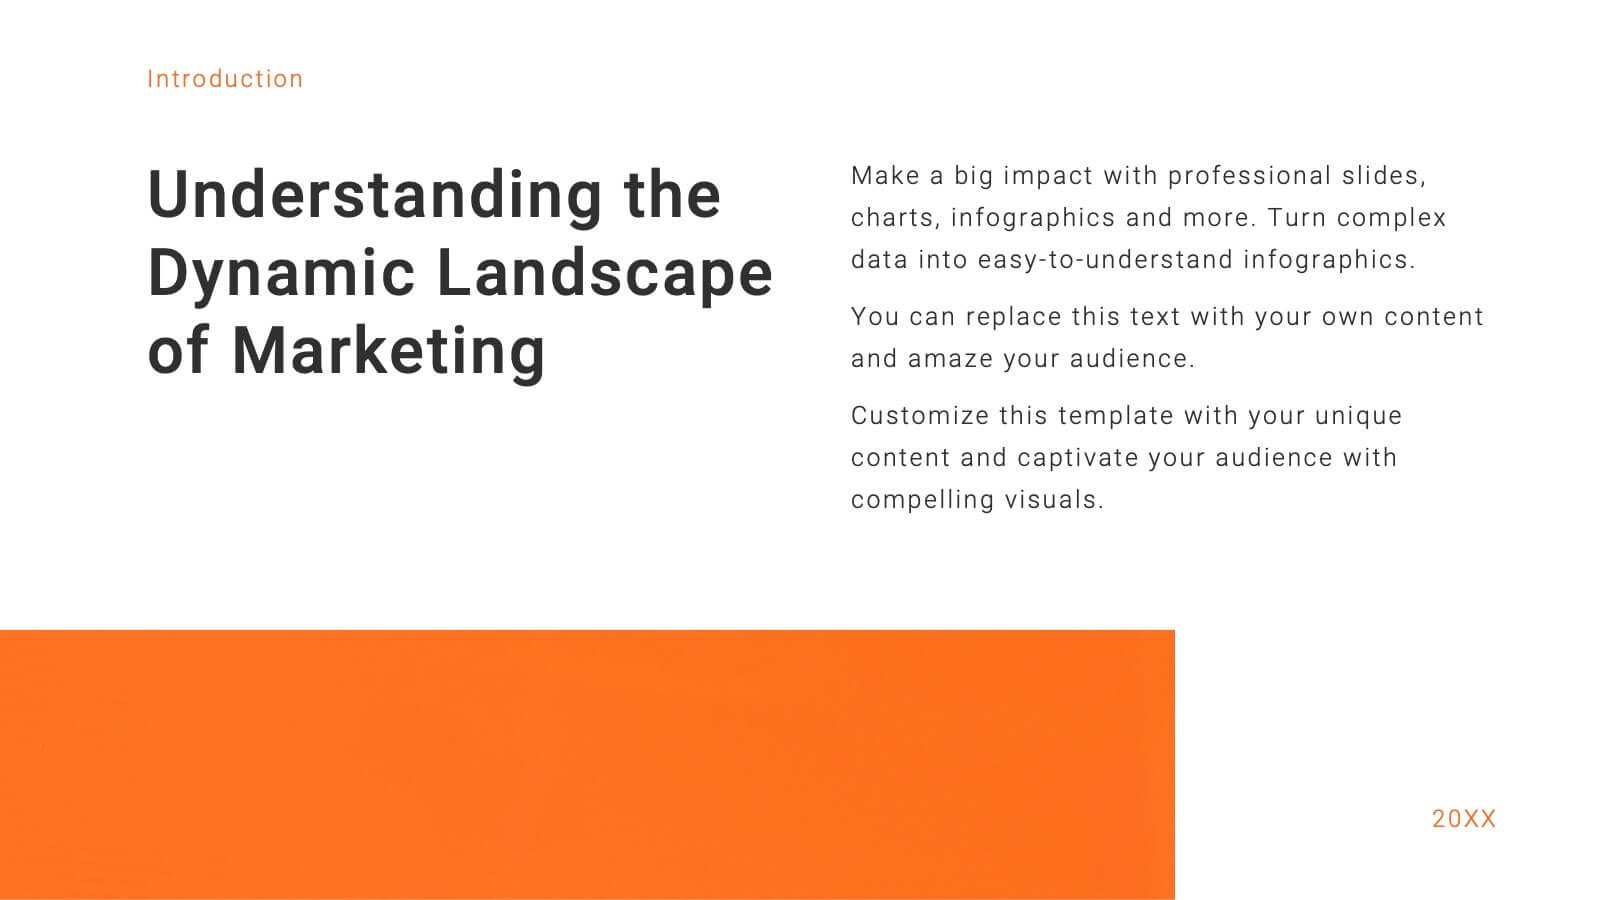
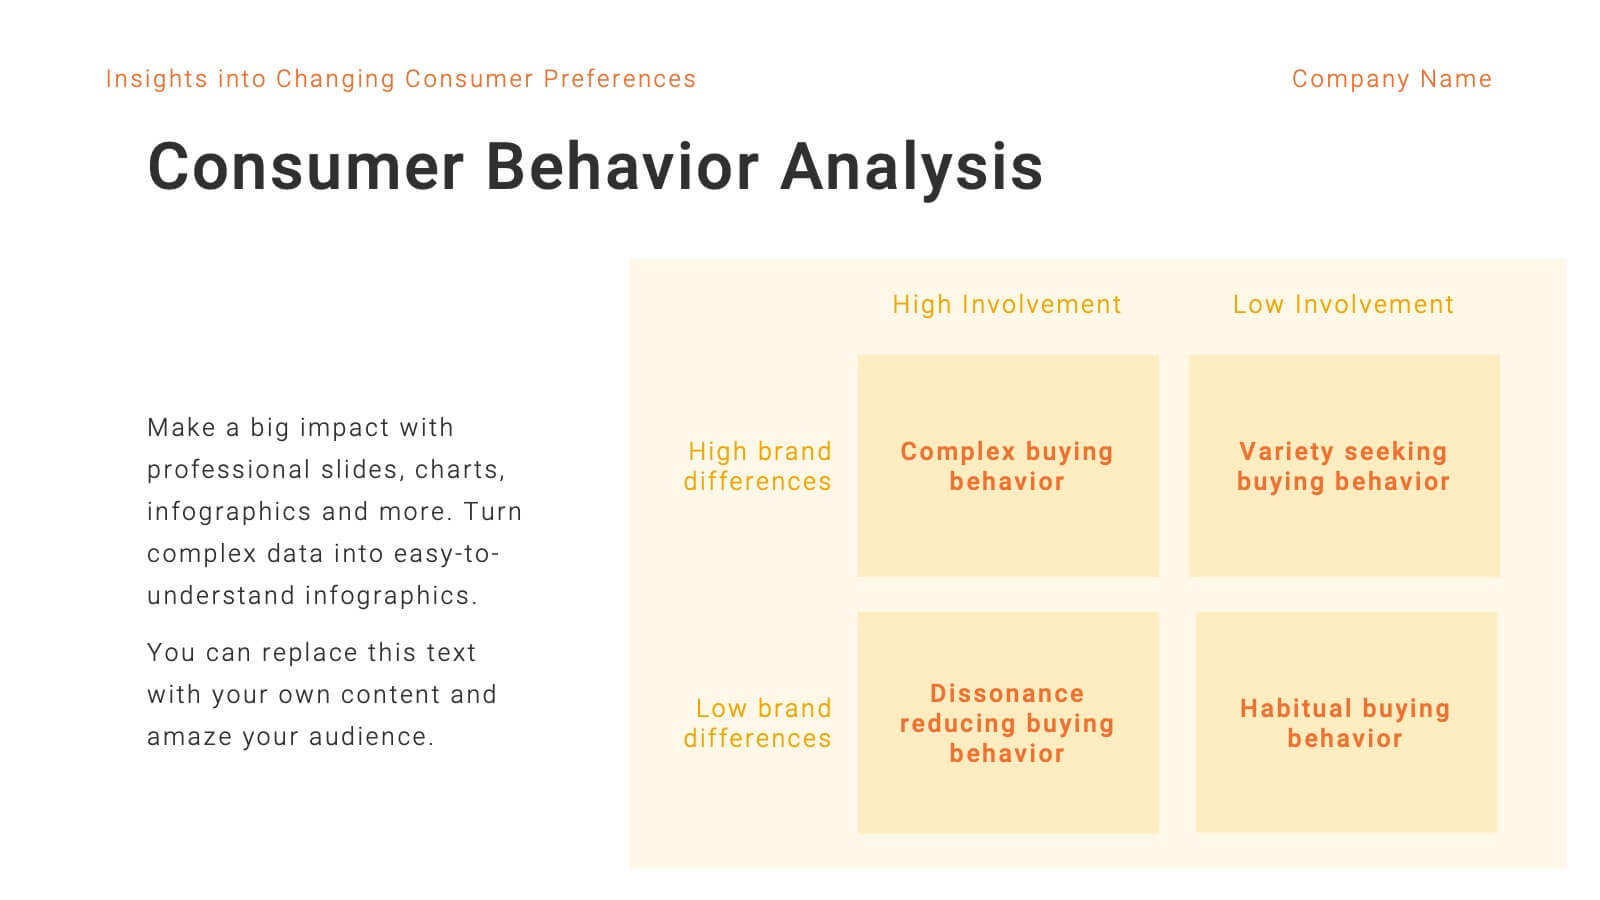
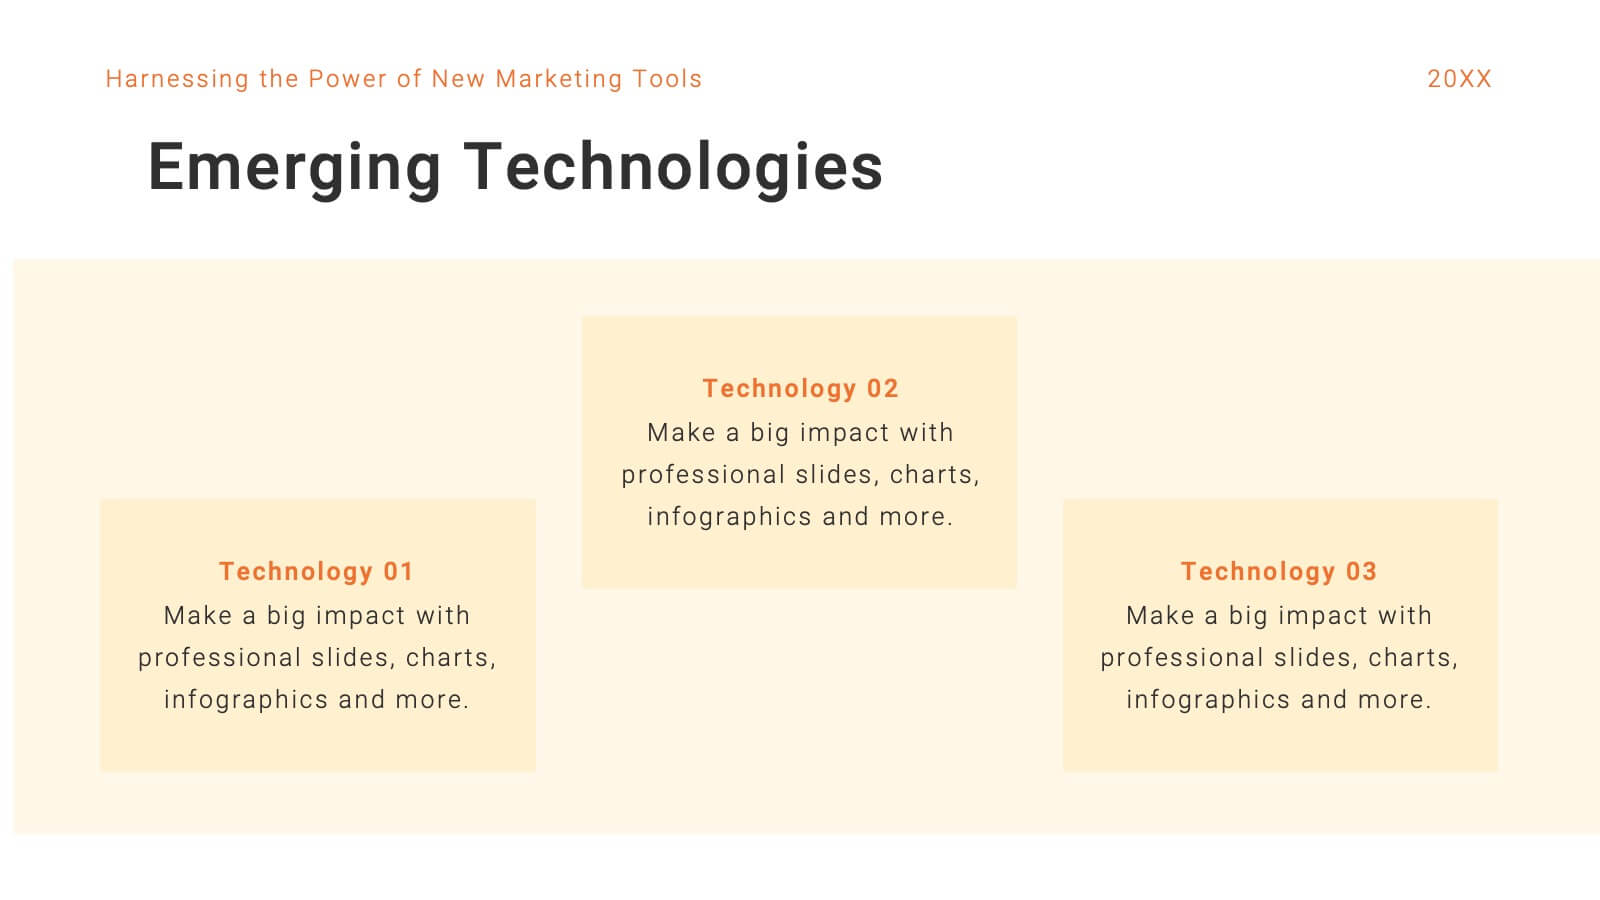
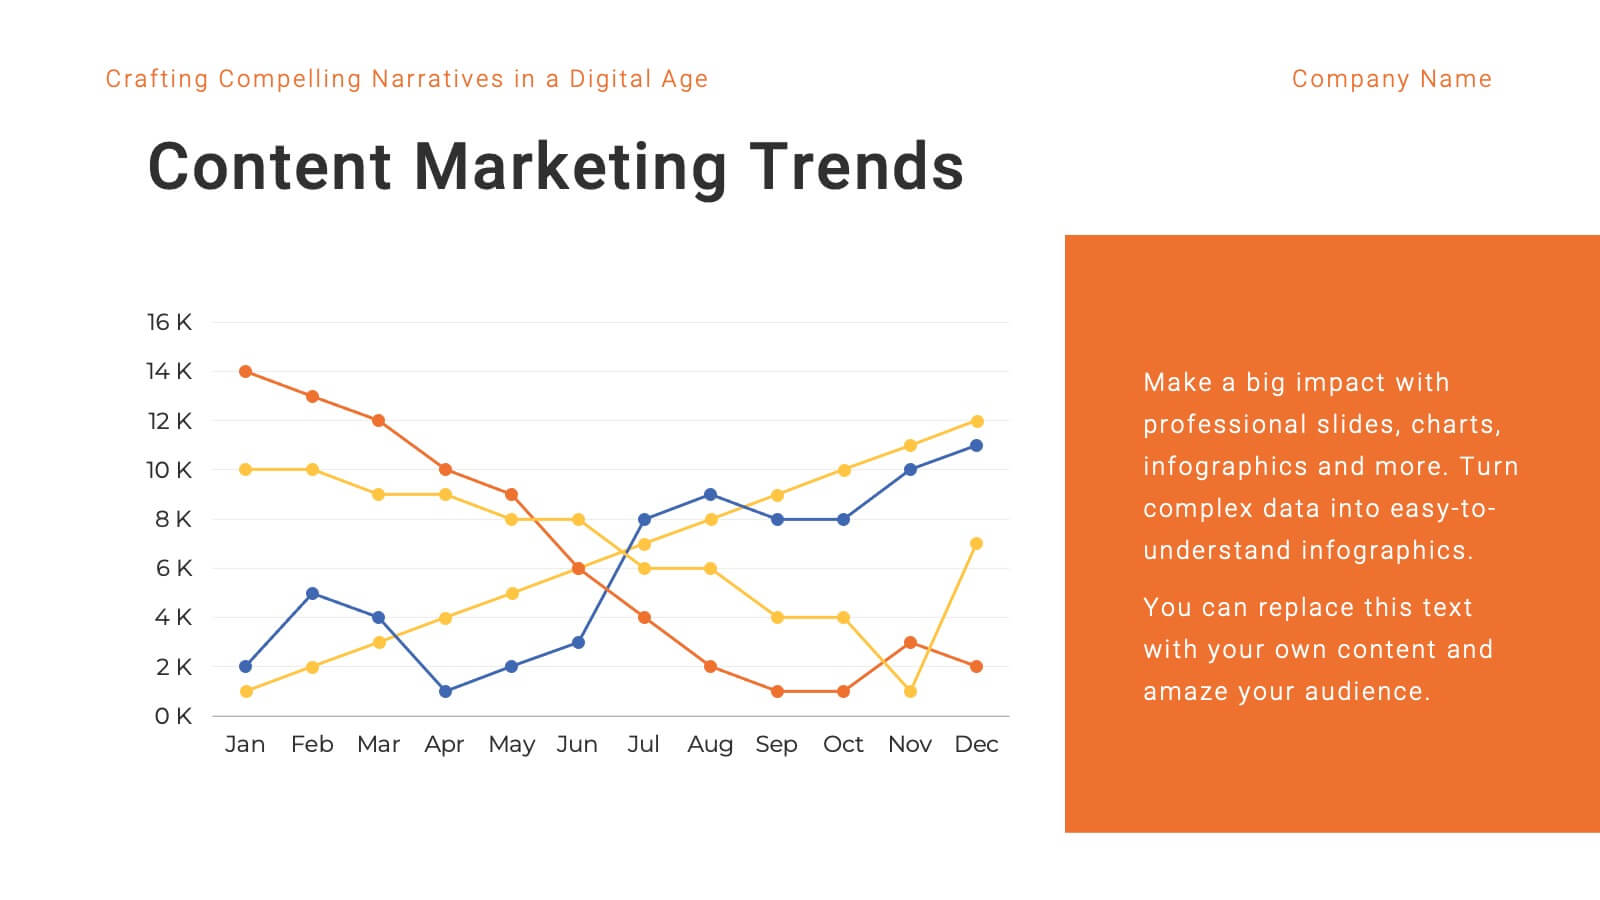
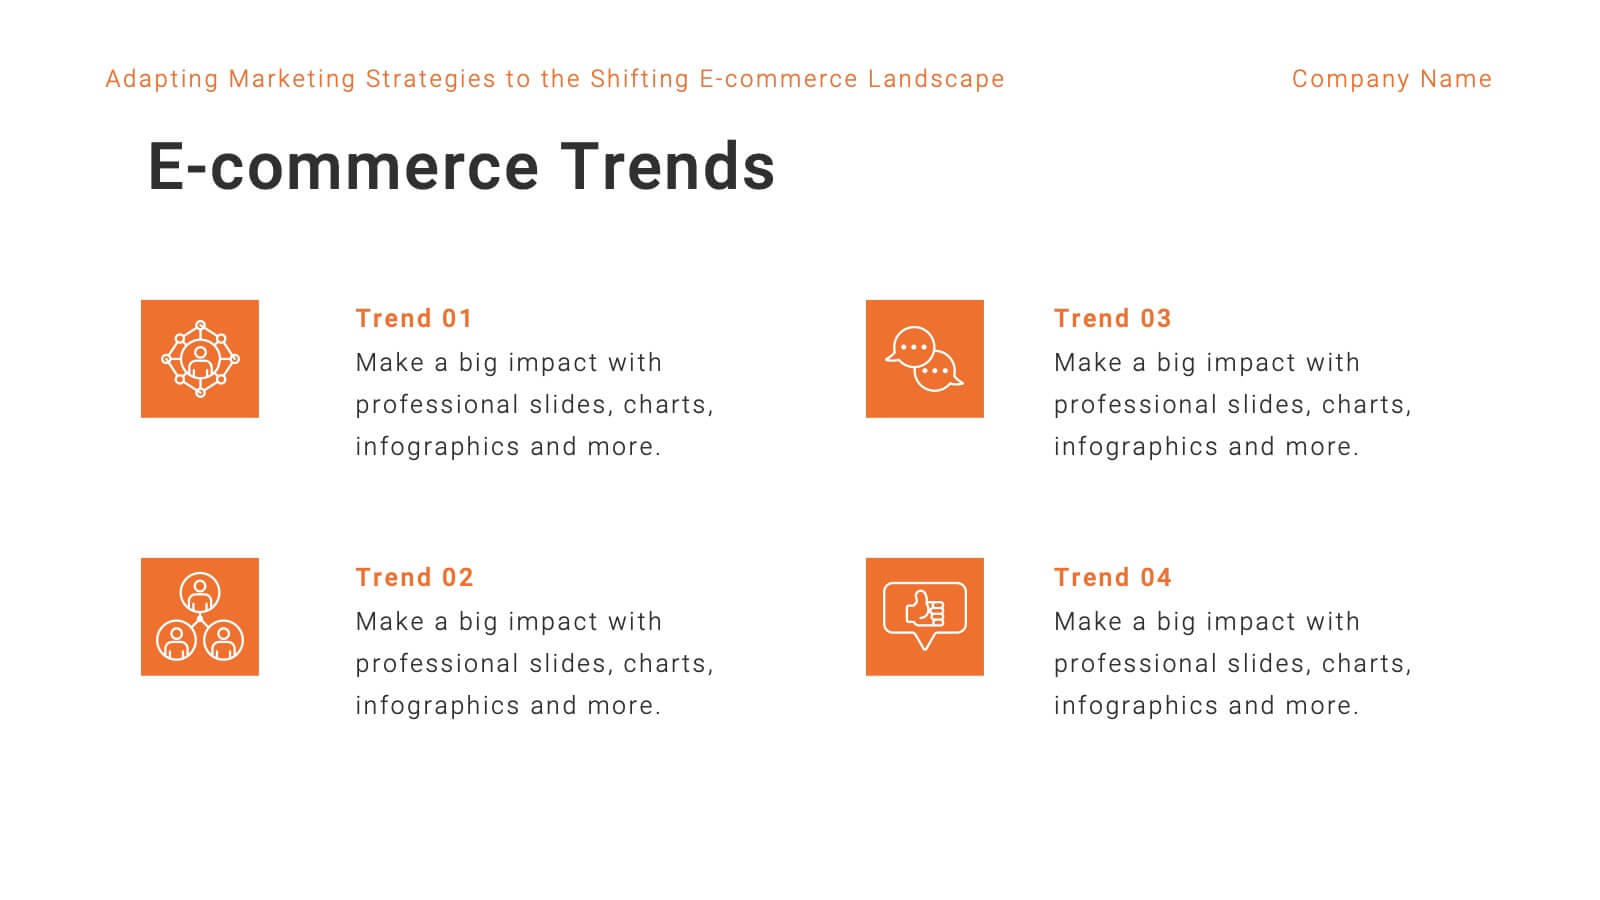
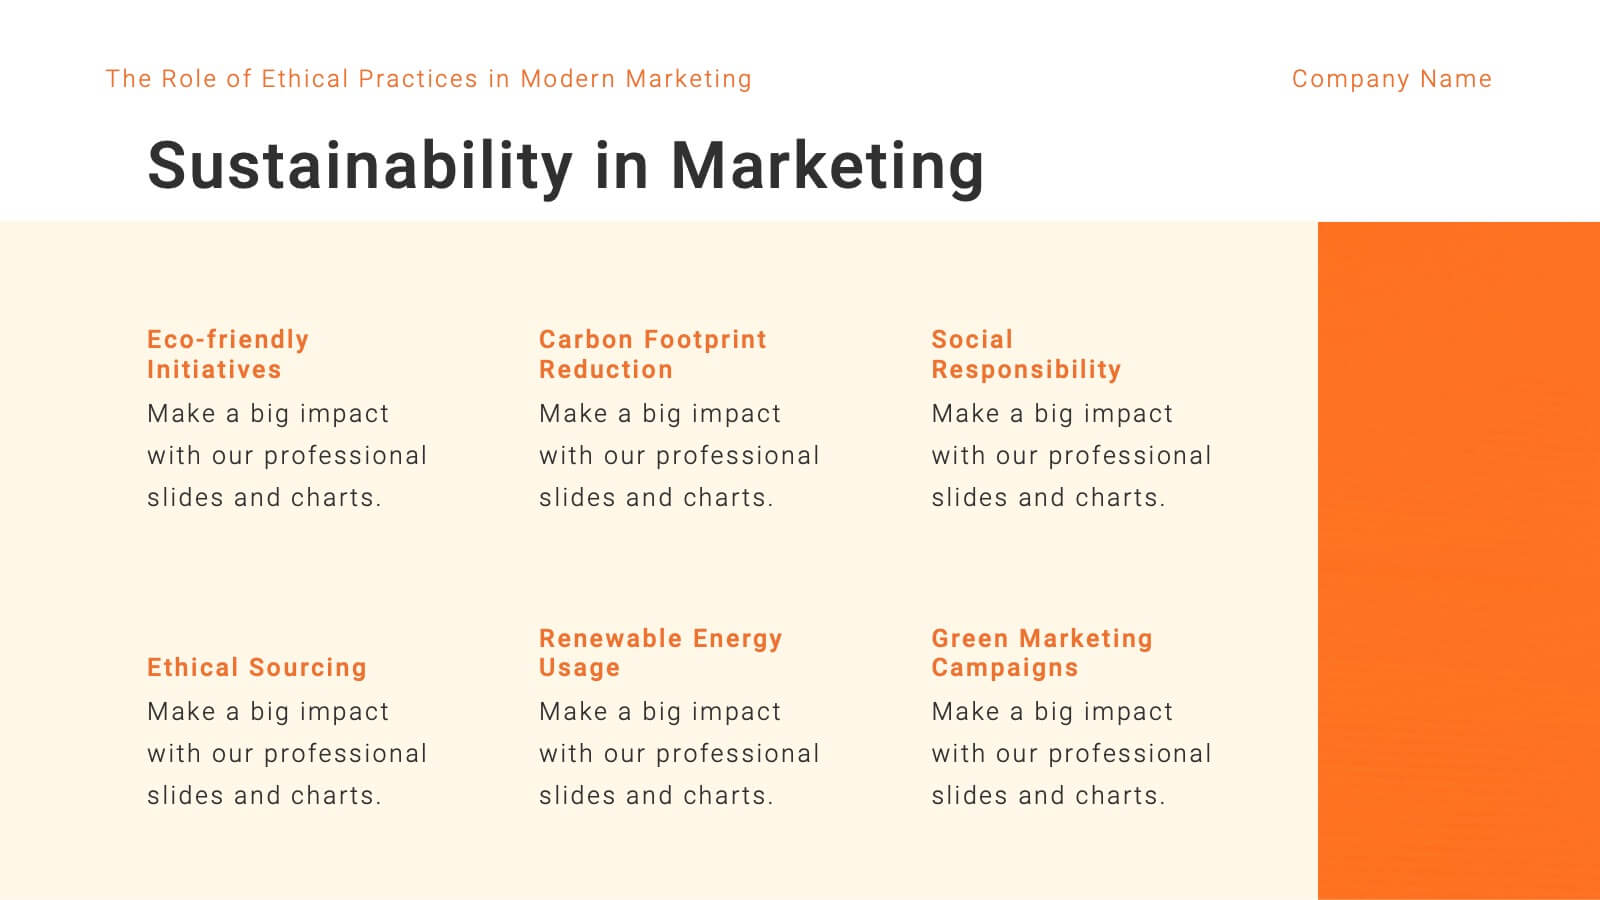
Mercury Marketing Research Report Presentation
Elevate your marketing strategy with this insightful and data-driven presentation template! Perfect for analyzing trends, consumer behavior, and emerging technologies, this template provides a thorough overview of today’s marketing landscape. From social media strategies to e-commerce trends, it covers all key areas. Fully customizable and compatible with PowerPoint, Keynote, and Google Slides for easy use.


6 slides
Product Comparison Table Presentation
Compare features, performance, or specifications at a glance with this Product Comparison Table Presentation. Featuring colorful bar charts and side-by-side metrics, this layout is perfect for showcasing multiple options clearly and professionally. Fully customizable in PowerPoint, Keynote, and Google Slides.


5 slides
Project Execution Next Steps Presentation
Streamline your workflow with the Project Execution Next Steps Presentation template. Designed for project managers and teams, this visual slide helps break down execution phases into clear, actionable steps. The connected chain layout ensures smooth project tracking, making it easy to communicate progress and responsibilities. Fully customizable in PowerPoint, Keynote, and Google Slides for seamless project planning and execution.


10 slides
Modern Geometric Shapes Presentation
The "Modern Geometric Shapes" presentation template uses a series of cascading, colorful shapes to organize and present data clearly and effectively. This layout is particularly suited for displaying hierarchical information or a series of processes that flow from one to the next, enhancing visual interest and readability. Each segment is distinctly colored to differentiate the sections while maintaining a cohesive design aesthetic, making it ideal for business presentations that require a blend of professionalism with modern graphic elements.


7 slides
Scope Management and Planning Presentation
Ensure clear project scope definition with the Scope Management and Planning Presentation. This structured template highlights key elements of project scope, responsibilities, and deliverables using an intuitive layout. Ideal for project managers, business analysts, and teams aligning project goals. Fully editable and compatible with PowerPoint, Keynote, and Google Slides.


6 slides
Leadership Vision and Strategy Presentation
Present your organization’s goals with this leadership vision and strategy template, designed with a hierarchy graphic to represent team structure and growth. Perfect for strategic planning, leadership meetings, and corporate presentations. Fully editable in Canva, PowerPoint, or Google Slides, making it easy to customize colors, text, and layout to fit your brand.


26 slides
Remote Work Strategies Presentation
Enhance your team's flexibility with our Remote Work Strategies presentation template, designed for use with PowerPoint, Keynote, and Google Slides. This template is an invaluable asset for team leaders, HR professionals, and business consultants dedicated to cultivating a productive remote work culture. Our template is tailored to provide an in-depth analysis of remote work best practices, offering slides that cover essential strategies for communication, collaboration, and project management in a virtual environment. It also includes insights on setting up a successful home office, maintaining work-life balance, and leveraging technology for seamless remote operations. With customizable elements, you can illustrate the advantages of remote work, share success stories, and provide actionable tips to maximize team efficiency from afar. This template is SEO-optimized to ensure your presentation reaches those seeking to optimize their remote work operations and foster a thriving digital workplace.


6 slides
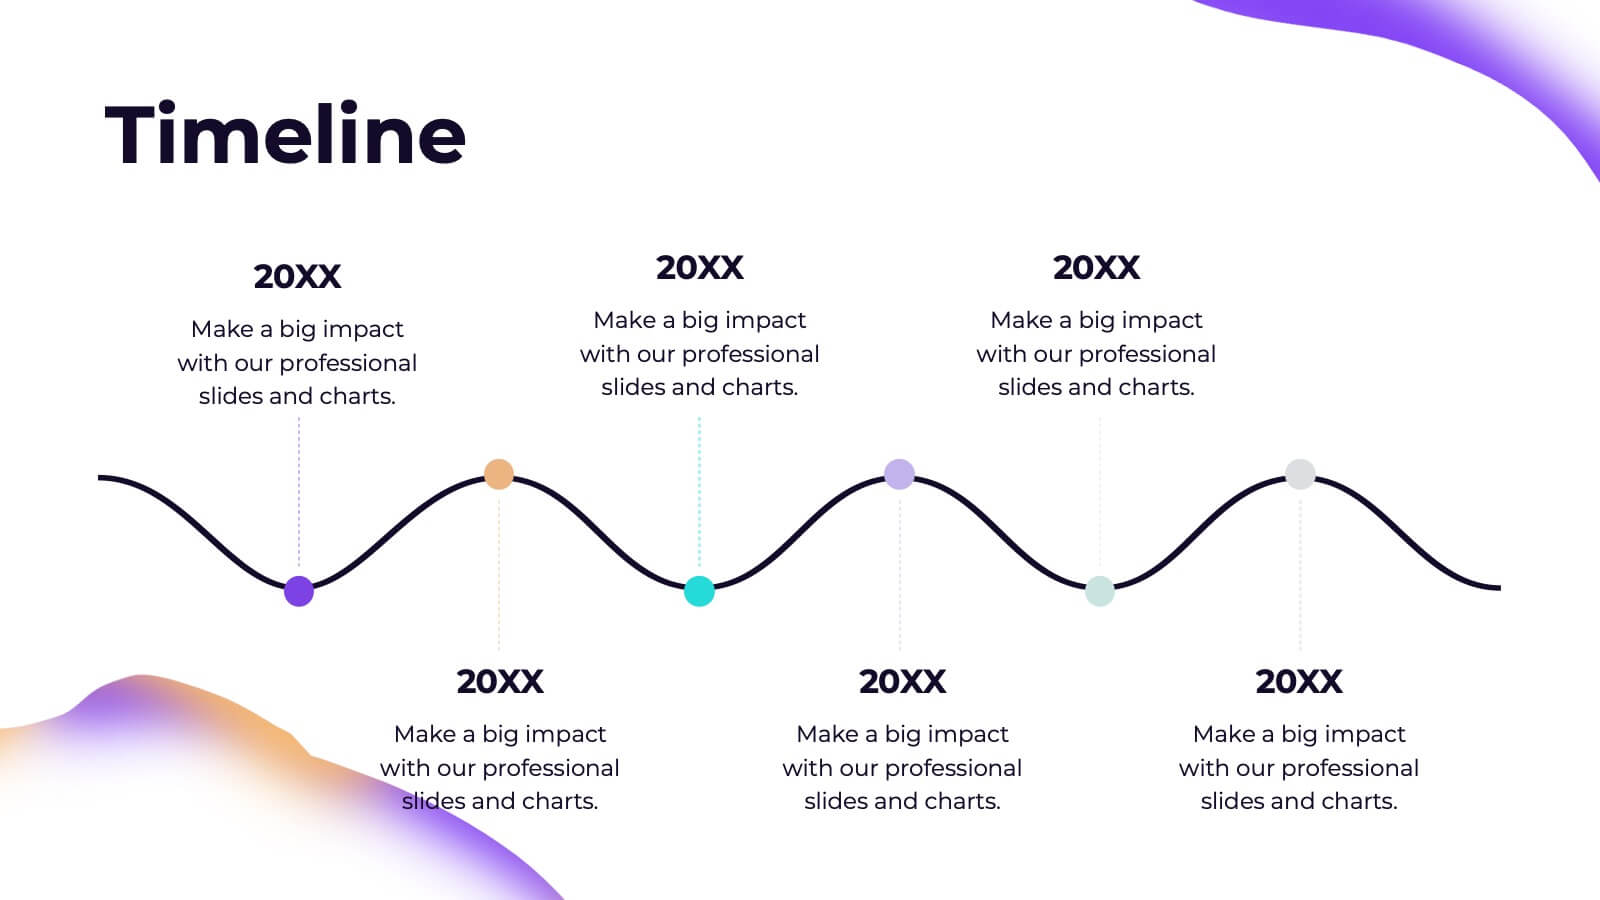
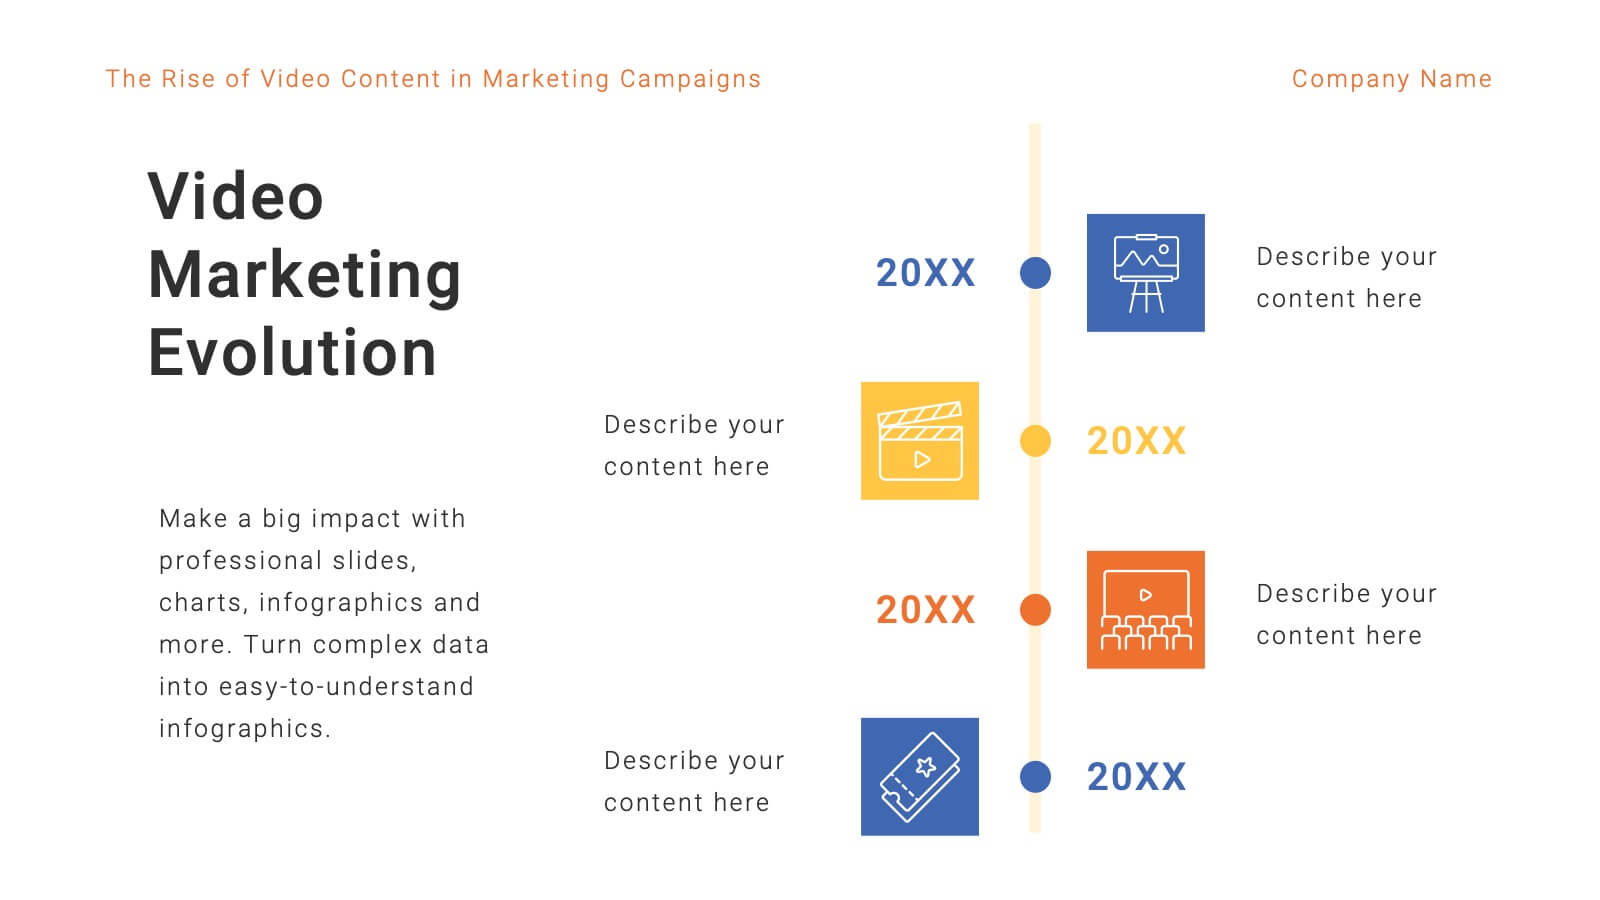
Historical Data Timeline Visualization
Showcase historical progression with clarity using the Historical Data Timeline Visualization. Designed for presenting chronological data points, this template combines circle elements with image icons and milestone labels—perfect for educational or historical presentations. Fully editable in Canva, PowerPoint, Keynote, and Google Slides for seamless customization.


4 slides
HR Policies and Employee Management Presentation
Clearly outline your workplace strategies with this HR Policies and Employee Management slide. Featuring four color-coded segments alongside an illustration of employee analysis, this layout is ideal for presenting onboarding steps, employee benefits, internal policies, or training procedures. Fully editable and compatible with PowerPoint, Keynote, and Google Slides for seamless customization.