


Features
- 6 Unique slides
- Fully editable and easy to edit in Microsoft Powerpoint, Keynote and Google Slides
- 16:9 widescreen layout
- Clean and professional designs
- Export to JPG, PDF or send by email


Do you have any questions?
Recommend


6 slides
Concentric Circles Study Infographic
Concentric circles are a set of circles with the same center point but different radii (plural of radius). This Infographic provides visual insights into the concept of concentric circles, their properties, and applications. These circles are arranged in such a way that one circle is surrounded by another, forming a pattern that resembles a target or a bullseye. This illustrates various concepts, making the infographic a versatile and engaging geometric pattern. Fully customizable and compatible with Powerpoint, Keynote, and Google Slides. Design an organized layout that guides the viewer's eye through the infographic.


4 slides
Gap Identification for Strategic Planning Presentation
Bridge the gap between where you are and where you want to be with this clean and practical layout. Ideal for outlining current challenges, action plans, and future goals, this presentation template helps visualize strategic progress with clarity. Fully compatible with PowerPoint, Keynote, and Google Slides.


6 slides
Strategic PESTEL Presentation
Kickstart smarter strategy sessions with a clean, colorful layout that makes external factor analysis feel effortless. This presentation helps teams map trends, identify risks, and understand the broader environment shaping business decisions. Clear visuals keep insights organized and actionable. Fully compatible with PowerPoint, Keynote, and Google Slides.


7 slides
Stock Market Futures Infographic
The stock market, also known as the equity market or share market, is a platform where buying, selling, and issuing shares of publicly-held companies take place. This infographic template serves as your compass through the intricate landscape of stocks and futures, empowering you with the knowledge to steer your investments towards a prosperous horizon. Compatible with Powerpoint, Keynote, and Google Slides. The striking visualizations present the clash between the bullish and bearish market forces, symbolizing the constant struggle that drives market movements. Easily showcase the latest stock prices with this template.


6 slides
Creative Process Infographic
The Creative Process Infographic offers a visually engaging and systematic approach to outlining the steps of a successful project or strategy. This template beautifully segments the process into distinct, color-coded stages, making it ideal for presentations, workshops, or educational materials that aim to simplify and illustrate the progression from concept to completion. Each section is clearly defined, providing a structured pathway that can be customized to detail specific tasks, checkpoints, or goals. This infographic is versatile and fully editable, suitable for Powerpoint, Google Slides, and Keynote, ensuring that it can be adapted to a wide range of topics and audiences.


5 slides
Economic Analysis of Europe Map Presentation
Visualize key economic indicators across European regions with this impactful map-based presentation. Use shaded country highlights and accompanying bar charts to present comparative data, performance trends, and regional growth. Ideal for economic reports, investor updates, or strategic planning. Fully editable and works seamlessly with PowerPoint, Keynote, and Google Slides.


27 slides
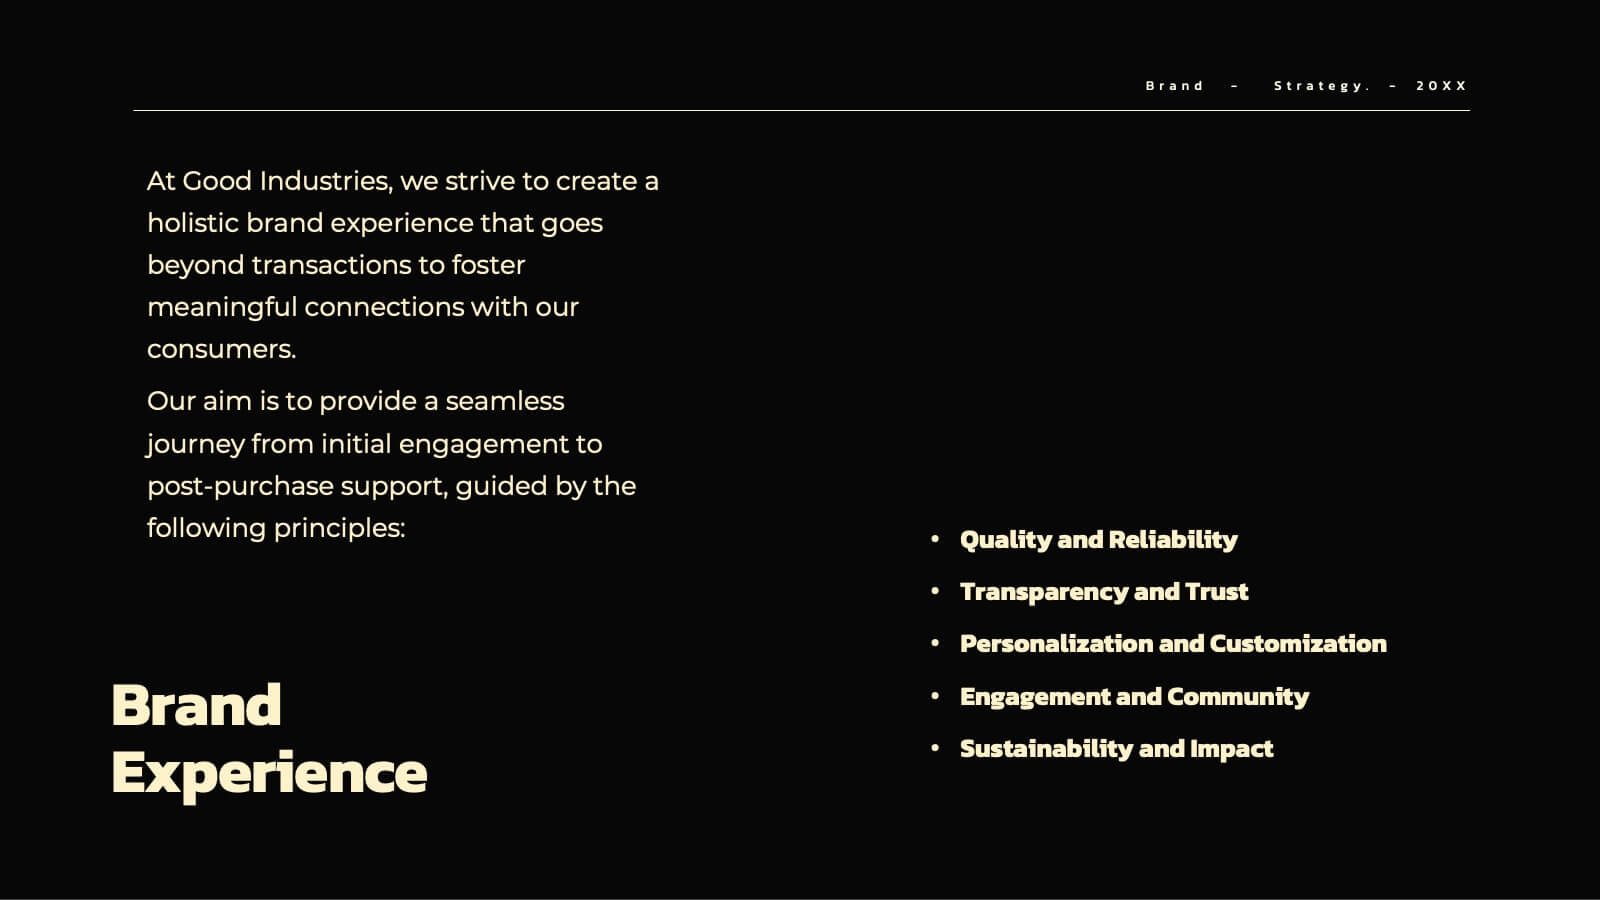
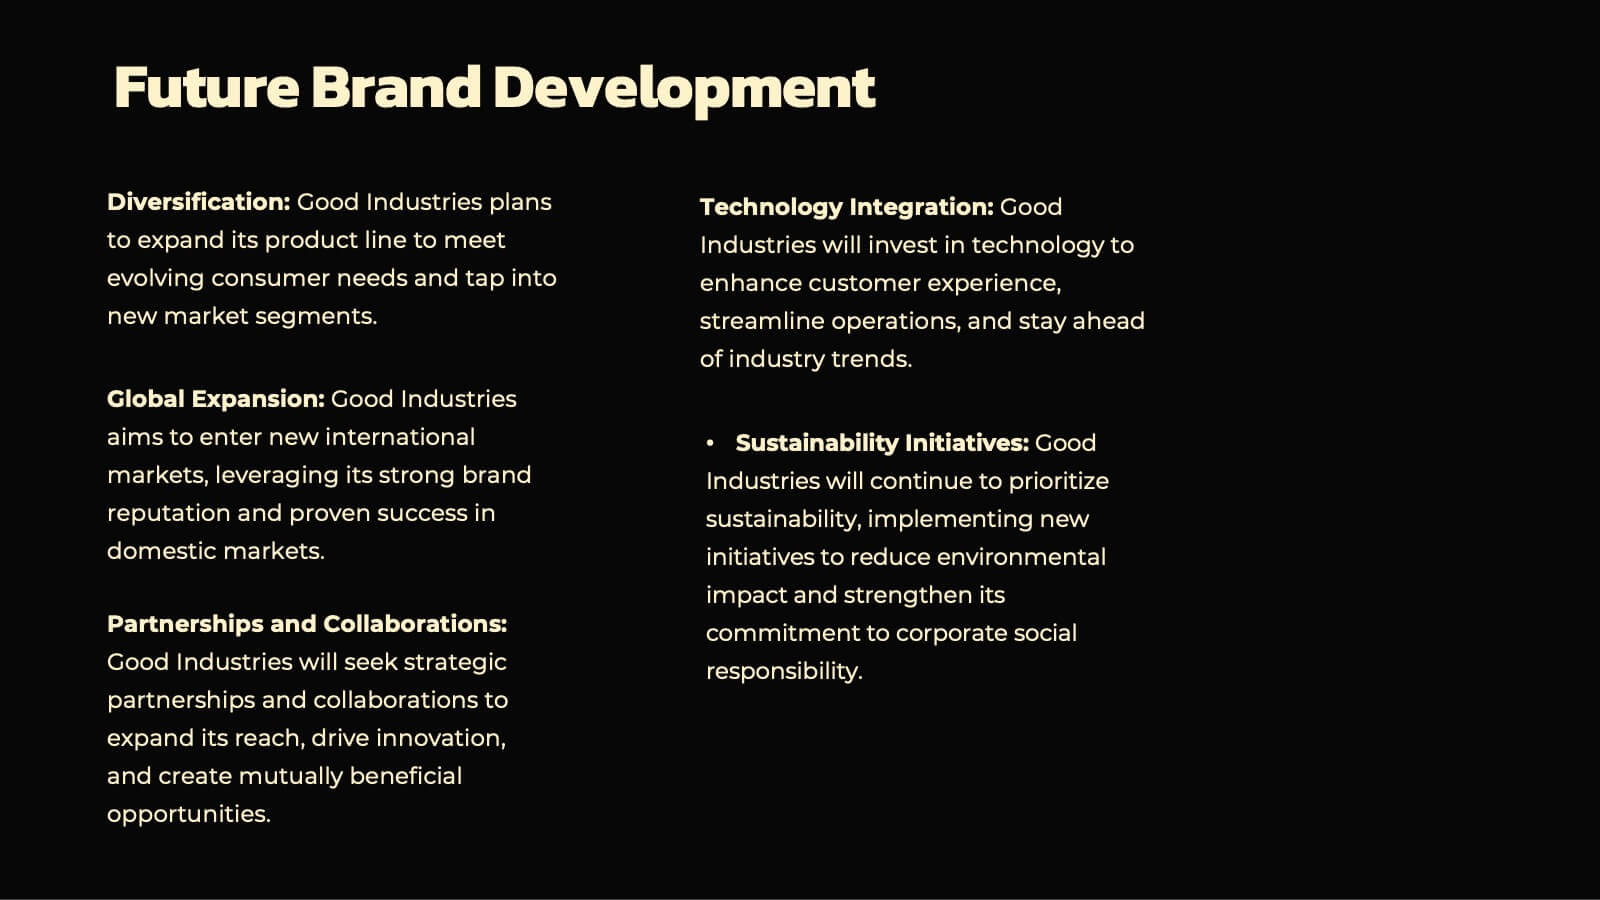
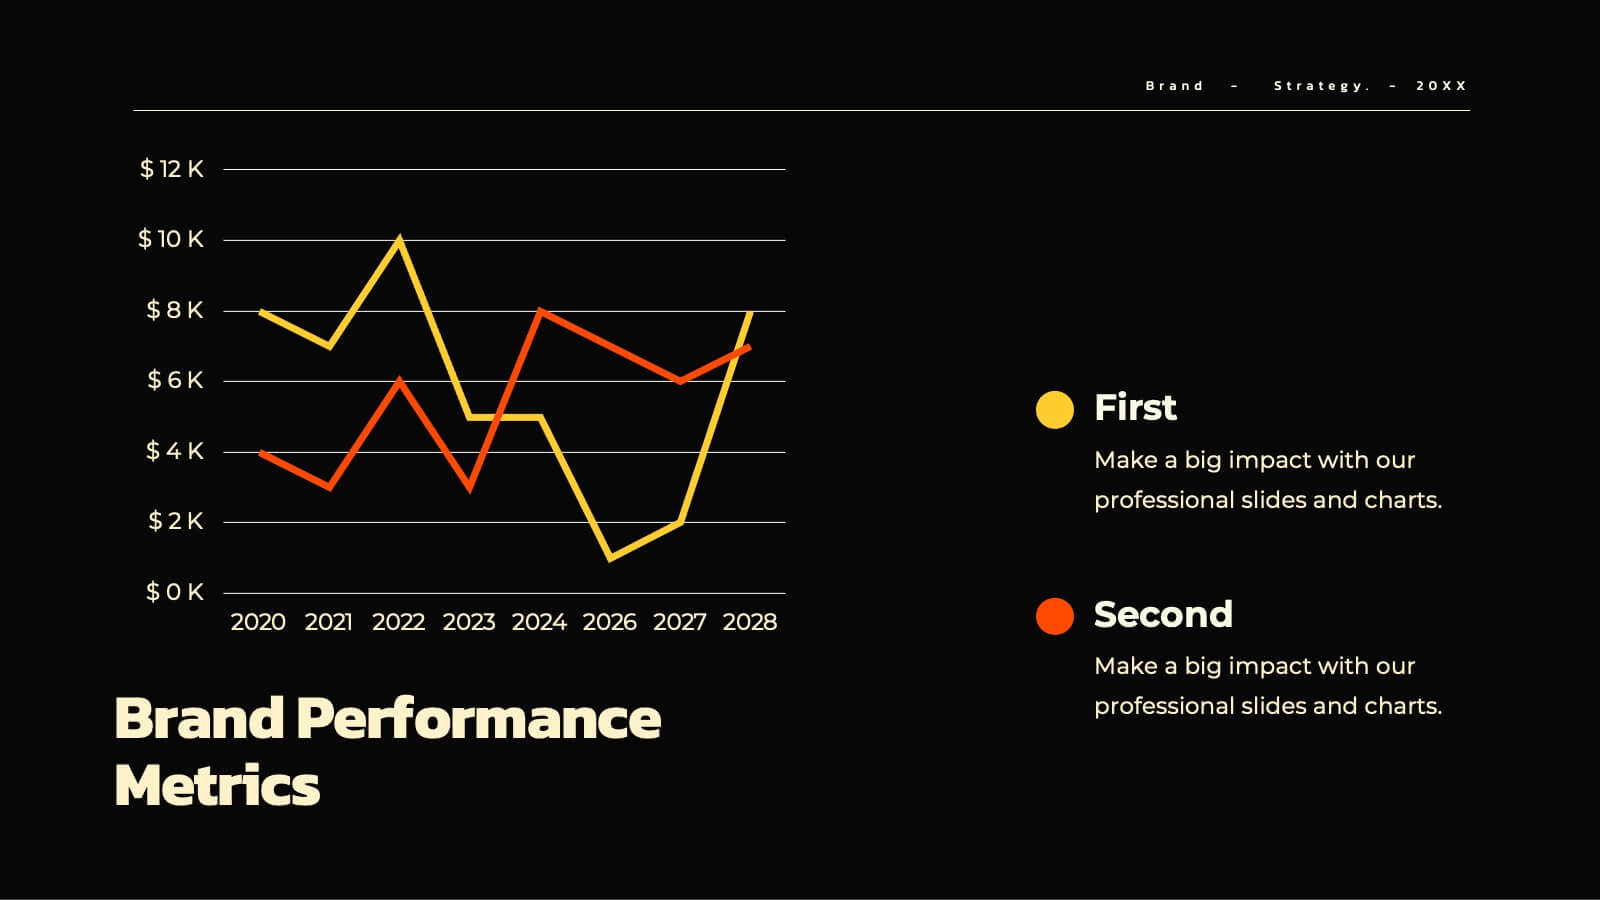
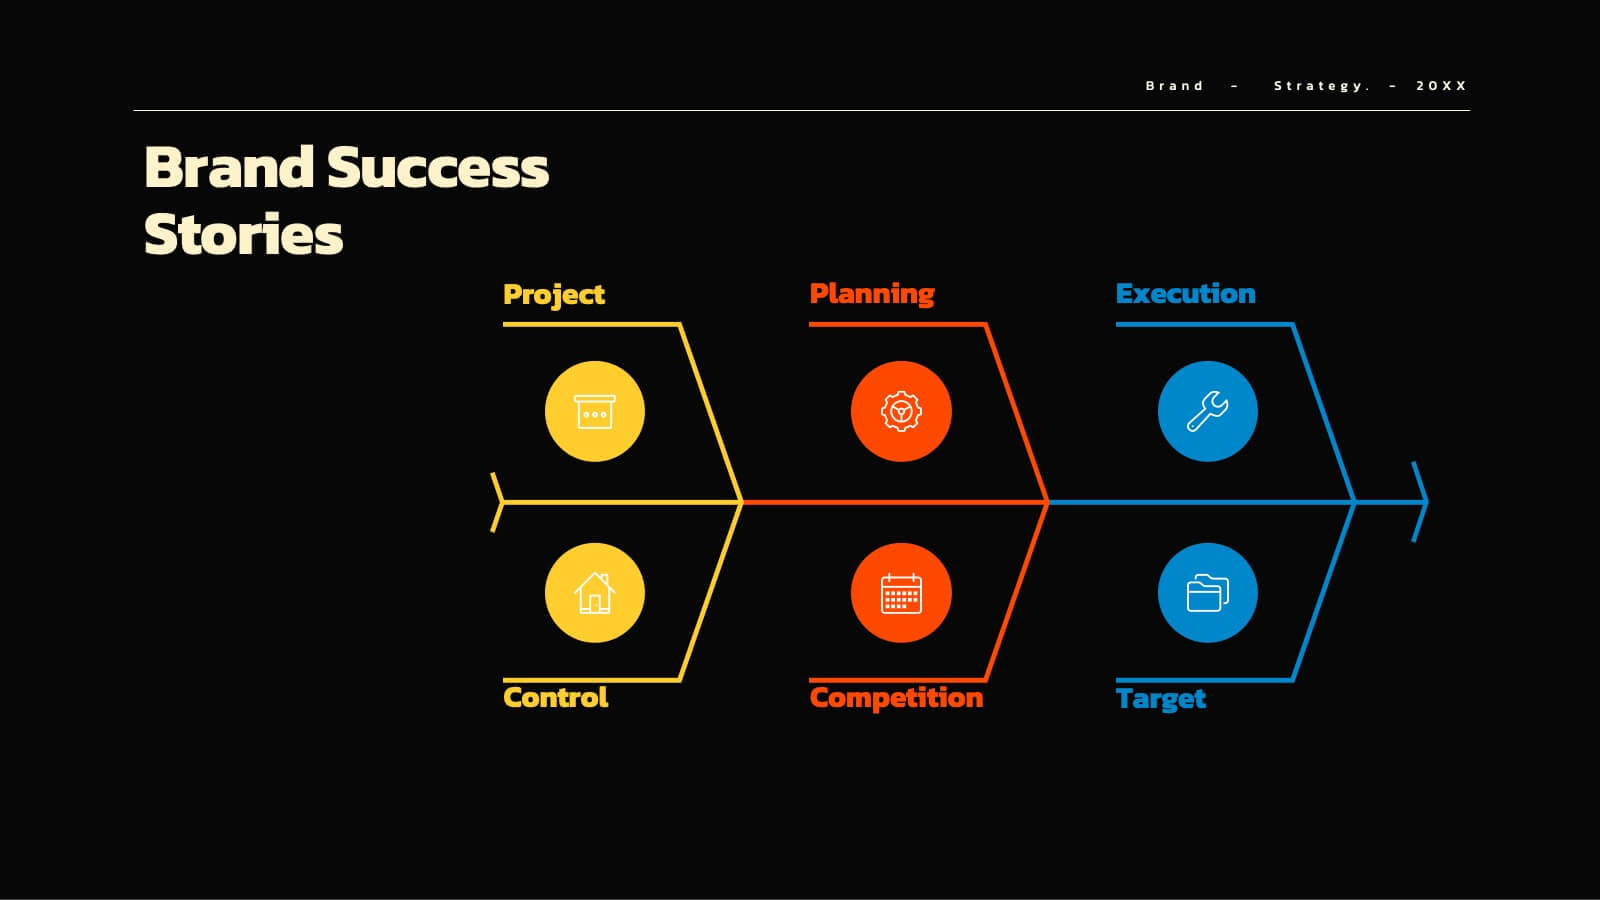
Aqua Brand Strategy Report Presentation
Make waves with this fresh, aqua-inspired presentation template, perfect for delivering a standout brand strategy report! Designed to help you showcase your brand's vision, market positioning, and strategic goals, it features a clean, modern layout that grabs attention. Compatible with PowerPoint, Keynote, and Google Slides for effortless customization.


20 slides
Whisper Creative Portfolio Presentation
The Creative Portfolio Presentation Template is a visually striking 20-slide design, ideal for showcasing your professional work or services. It features slides for introductions, about us, portfolio overviews, and individual project highlights. Key sections include philosophy, style, creative process, client testimonials, awards, and pricing structures. The vibrant yellow and pink gradient elements provide a modern, creative flair that grabs attention. Fully customizable and compatible with PowerPoint, Keynote, and Google Slides, this template is perfect for designers, agencies, and freelancers aiming to present their work professionally and uniquely.


8 slides
Business Data Analytics Dashboard
Monitor performance with clarity using this Business Data Analytics Dashboard. Featuring data bars, numeric highlights, and color-coded insights, this slide is perfect for quarterly updates, data reviews, or executive summaries. Clean and professional, it's fully editable in PowerPoint, Keynote, and Google Slides.


12 slides
Customer Satisfaction Smile Rating Presentation
Measure customer happiness with this engaging customer satisfaction smile rating template! Featuring a visual scale from dissatisfaction to delight, this design helps businesses track feedback and identify improvement areas. Ideal for reports, surveys, and performance reviews. Fully customizable and compatible with PowerPoint, Keynote, and Google Slides.


6 slides
Startup Goals and MVP Rollout Plan Presentation
Launch with clarity using the Startup Goals and MVP Rollout Plan Presentation. This dynamic circular layout features a rocket icon and segmented design to represent phased growth and product milestones. Ideal for showcasing early-stage priorities, MVP deliverables, and go-to-market strategies. Compatible with PowerPoint, Keynote, Google Slides, and Canva for full customization.


5 slides
Company Hierarchical Structure
Easily map out your company's reporting lines and team organization with this clean, photo-friendly hierarchy slide. Perfect for presenting departments, roles, or leadership structures. Fully editable in PowerPoint, Keynote, and Google Slides for effortless customization.


6 slides
Data Analysis Methods Infographics
This Data Analysis Methods Infographic is an excellent tool for professionals and students alike to present statistical findings and patterns. Designed for seamless integration with PowerPoint, Google Slides, and Keynote. The infographics are ideal for illustrating trends, and summarizing large amounts of data in an easily digestible format. With a variety of chart styles, including bar graphs, line charts, and icon arrays, the template allows for versatile data representation. Make your data speak volumes with this crisp and informative infographic, ensuring your audience grasps the insights at a glance. Perfect for market research, academic research, and business performance presentations.


5 slides
Retention and Loyalty Program Benefits Presentation
Showcase the value of your loyalty strategy with the Retention and Loyalty Program Benefits presentation. This template clearly communicates reward tiers, membership perks, and engagement incentives using a card-based visual structure. Perfect for marketing presentations, customer success teams, and subscription-based business models. Fully customizable in PowerPoint, Keynote, and Google Slides.


4 slides
Healthcare Access and Preventive Care Presentation
Bring your health strategy to life with this engaging heart-themed infographic slide. Perfect for illustrating patient access points, wellness checkpoints, or preventive initiatives, each segment is cleanly organized with icons and text. Ideal for medical presentations, this template works seamlessly in PowerPoint, Keynote, and Google Slides for total flexibility.


6 slides
Sustainabilitiy Management Goals and Metrics Presentation
Make your sustainability story shine with a clean, modern presentation that highlights environmental goals, measurable results, and ongoing progress. Perfect for communicating corporate impact and performance data with clarity and purpose. Fully customizable and compatible with PowerPoint, Keynote, and Google Slides for a professional and visually engaging delivery.


26 slides
Understanding Cryptocurrency Presentation
Step into the future of finance with this engaging presentation on cryptocurrency. Covering key topics like blockchain technology, digital wallets, market trends, and security best practices, this template helps simplify complex concepts for any audience. Fully customizable and compatible with PowerPoint, Keynote, and Google Slides for a seamless and informative presentation experience.