Defining Target Market and Audience Presentation
PowerPoint Template and Google Slides Theme


Features
- 5 Unique slides
- Fully editable and easy to edit in Microsoft Powerpoint, Keynote and Google Slides
- 16:9 widescreen layout
- Clean and professional designs
- Export to JPG, PDF or send by email
- Remove from favorites
Powerpoint Template
1 MB
Google Slides Template
External link
Keynote Template
1 MB
Recommend
- Remove from favorites
Powerpoint Template
19 MB
Google Slides Template
External link
Keynote Template
19 MB
20 slides
Team Meeting Presentation
Streamline your team meetings with this professional presentation template, designed in striking purple tones. It covers all essential aspects from agenda setting to feedback collection, ensuring efficient and effective communication. Compatible with PowerPoint, Google Slides, and Keynote, this template is perfect for keeping your team aligned and focused.
- Remove from favorites
Powerpoint Template
11 MB
Google Slides Template
External link
Keynote Template
12 MB
22 slides
SEO Report Presentation
Optimize your SEO strategies using our comprehensive SEO Report template. It includes sections for keyword performance, market trends, competitor insights, and client feedback. Tailored for digital marketers and SEO specialists, this template supports presentations in PowerPoint, Keynote, and Google Slides.
- Remove from favorites
Powerpoint Template
1 MB
Google Slides Template
External link
Keynote Template
1 MB
7 slides
Creative Tables Of Content Infographic
A creative table of contents is a visually appealing and innovative way of presenting the structure and contents of a document, report, book, or any written work. Our infographic template is an aesthetically pleasing and insightful map to your content landscape. This infographic is not just a guide; it's a visually engaging journey through your ideas and topics, promising a delightful and organized user experience. Fully customizable and compatible with Powerpoint, Keynote, and Google Slides. This creative table of contents uses design elements, colors, typography, and graphics to make it engaging and eye-catching.
- Remove from favorites
Powerpoint Template
6 MB
Google Slides Template
External link
Keynote Template
6 MB
26 slides
Remote Works Strategie Presentation
This presentation template is designed for businesses focused on remote work strategies. It features a variety of slide types, including team introductions, Gantt charts, comparison slides, and infographics. The design is clean and modern, with a mix of text, images, and icons to help communicate your message effectively. Key slides include options for showcasing your team, outlining different strategies, and presenting data visually through charts and maps. The template also includes device mockups for mobile and laptop views, making it versatile for different presentation needs. Each slide is customizable to fit your brand's colors and content.
- Remove from favorites
Powerpoint Template
9 MB
Google Slides Template
External link
Keynote Template
9 MB
7 slides
App Mockup Infographic
Elevate your app demonstrations with this vibrant collection of app mockup templates, specifically designed to showcase the functionality and design of mobile applications across various devices. Each template emphasizes the user experience, presenting your app in a clear and engaging manner that highlights its most compelling features. The templates are crafted with a clean, modern aesthetic, incorporating bright colors and clear typography to draw attention to key functionalities and user interfaces. Perfect for developers and designers looking to present their apps to clients, stakeholders, or potential users, these mockups provide a professional framework for displaying apps in context. Customizable to fit your specific needs, this collection allows you to seamlessly integrate your own app designs and screenshots, making it easier than ever to convey the look and feel of your app in a realistic setting. Whether for pitches, presentations, or promotional materials, these mockups are an invaluable tool for communicating the value and operation of your application.
- Remove from favorites
Powerpoint Template
1 MB
Google Slides Template
External link
Keynote Template
1 MB
4 slides
Modern 3D Business Diagram Presentation
Bring your metrics to life with this sleek 3D chart that adds instant dimension to any business presentation. Designed to visualize comparisons or progress across three data sets, this diagram helps you communicate clearly without overloading the slide. Fully compatible with PowerPoint, Keynote, and Google Slides for a seamless workflow.
- Remove from favorites
Powerpoint Template
1 MB
Google Slides Template
External link
Keynote Template
1 MB
5 slides
Data-Driven Statistics Slide Presentation
Turn your numbers into a story that’s clear, bold, and easy to follow. This modern layout is perfect for presenting metrics, comparisons, or performance insights with precision and style. Customize colors, data, and text effortlessly—compatible with PowerPoint, Keynote, and Google Slides for seamless editing and presentation flexibility.
- Remove from favorites
Powerpoint Template
1 MB
Google Slides Template
External link
Keynote Template
1 MB
7 slides
Harvey Ball Competitive Analysis Infographic
Enhance your competitive analysis presentations with our Harvey Ball Infographic, an excellent resource for business analysts, product managers, and market researchers. This infographic uses Harvey Balls to visually convey the comparison of product features or company services against competitors in the market. Our Harvey Ball Infographic offers a clear, comparative perspective of how different offerings stack up in key areas. It’s particularly useful for demonstrating product strengths, areas for improvement, and market positioning. With customizable Harvey Ball charts, you can reflect levels of completeness, satisfaction, or performance, allowing for an at-a-glance assessment that is both intuitive and impactful. This SEO-optimized infographic is tailored to make your competitive analysis resonate with stakeholders and decision-makers. Use this infographic to provide a snapshot of where your products or services stand in the competitive landscape, informing strategy and guiding development priorities.
- Remove from favorites
Powerpoint Template
1 MB
Google Slides Template
External link
Keynote Template
3 MB
7 slides
Vision Infographic
Elevate your presentations with our range of Slide Templates, tailored to showcase long-term objectives and strategies. These designs vary from simple and clean to bold and engaging, ensuring that every slide effectively communicates your forward-looking plans. Each template is crafted for easy customization to suit your brand's style, including areas for essential details, data representation, and motivational elements. They are perfect for aligning your team, engaging stakeholders, and promoting strategic discussions. Ideal for business presentations, team meetings, and motivational sessions, these templates offer a professional way to present your future goals and engage your audience effectively.
- Remove from favorites
Powerpoint Template
1 MB
Google Slides Template
External link
Keynote Template
1 MB
3 slides
Organized Bullet Point Summary Presentation
Present key facts clearly with the Organized Bullet Point Summary Presentation. Designed for structured communication, this layout visually breaks down your main points with icons, color blocks, and percentage highlights. Perfect for reporting metrics, comparing ideas, or prioritizing tasks. Fully editable in PowerPoint, Keynote, and Google Slides.
- Remove from favorites
Powerpoint Template
5 MB
Google Slides Template
External link
Keynote Template
7 MB
26 slides
Solar Energy Company Profile Presentation
Step into the radiant world of solar energy, where the sun’s power promises a greener tomorrow. This playful, vibrant template, painted in refreshing shades of green and light tan yellow, encapsulates the joy and promise of renewable energy. Decked with sun-kissed graphics, spirited icons, and illuminating image placeholders, it brings the power of solar to the forefront. Effortlessly adaptable to Powerpoint, Keynote, or Google Slides. A ray of sunshine for green startups, environmental educators, energy consultants, or anyone eager to spread the word about solar solutions. Illuminate your ideas; let the power of the sun shine through.
- Remove from favorites
Powerpoint Template
1 MB
Google Slides Template
External link
Keynote Template
1 MB
7 slides
One-Page Startup Model Canvas
Launch and refine your business idea with clarity using the One-Page Startup Model Canvas Presentation. This slide presents all key startup elements—Partners, Activities, Value Propositions, Customer Segments, Revenue Streams, and more—in a smart puzzle-piece layout that simplifies complex planning. Perfect for founders and pitch decks. Fully customizable in PowerPoint, Keynote, and Google Slides.
- Remove from favorites
Powerpoint Template
1 MB
Google Slides Template
External link
Keynote Template
1 MB
4 slides
Workforce Skills Gap Plan Presentation
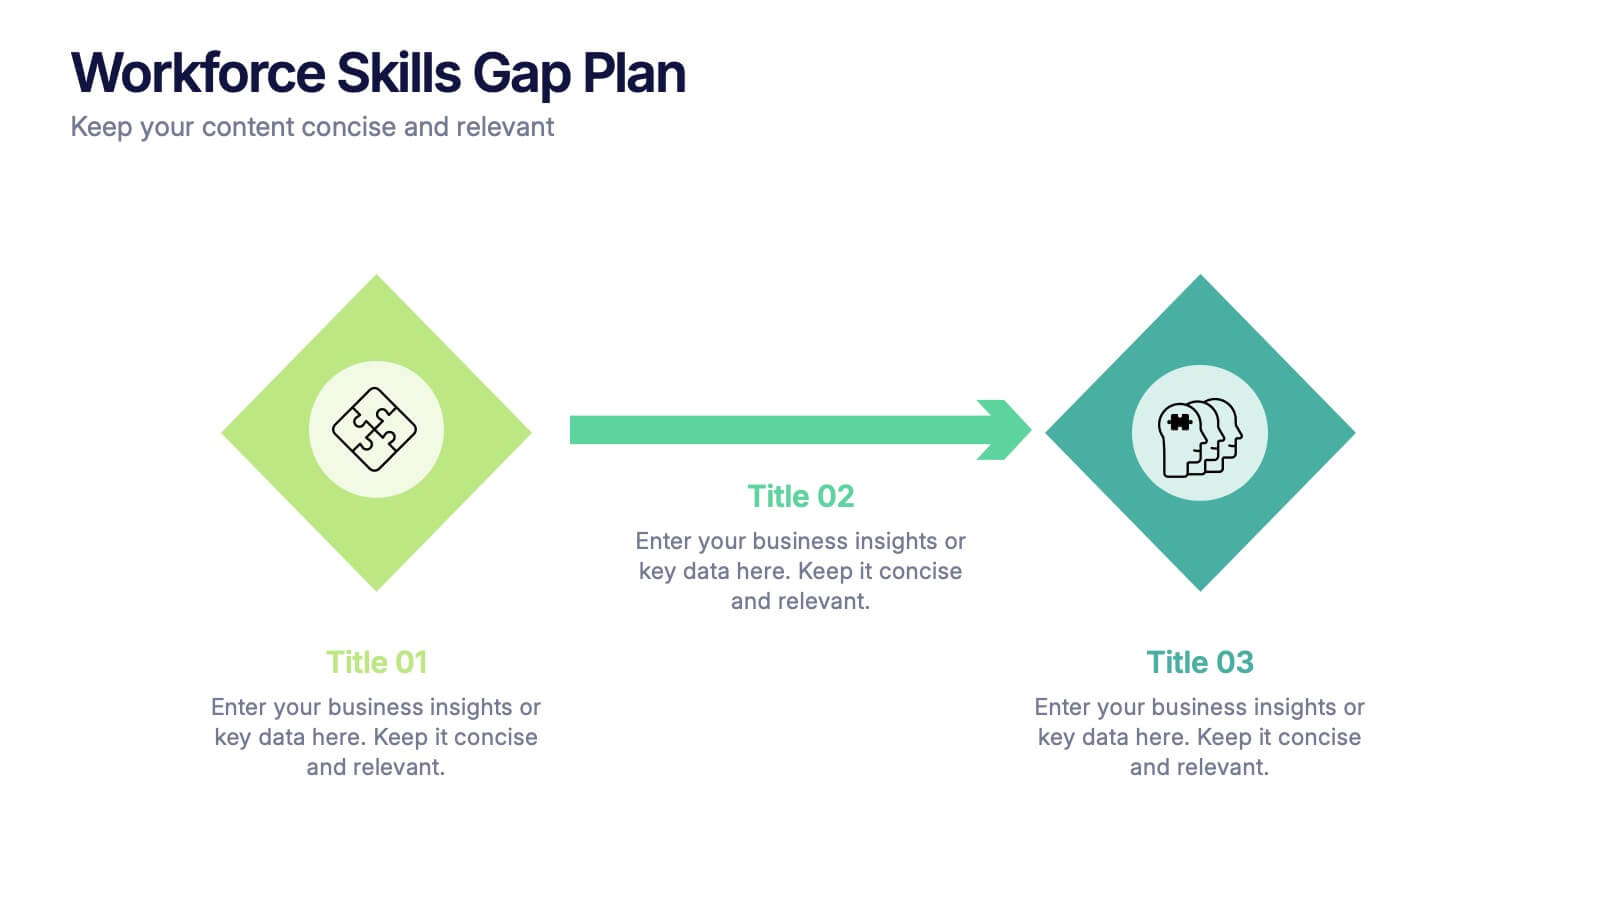
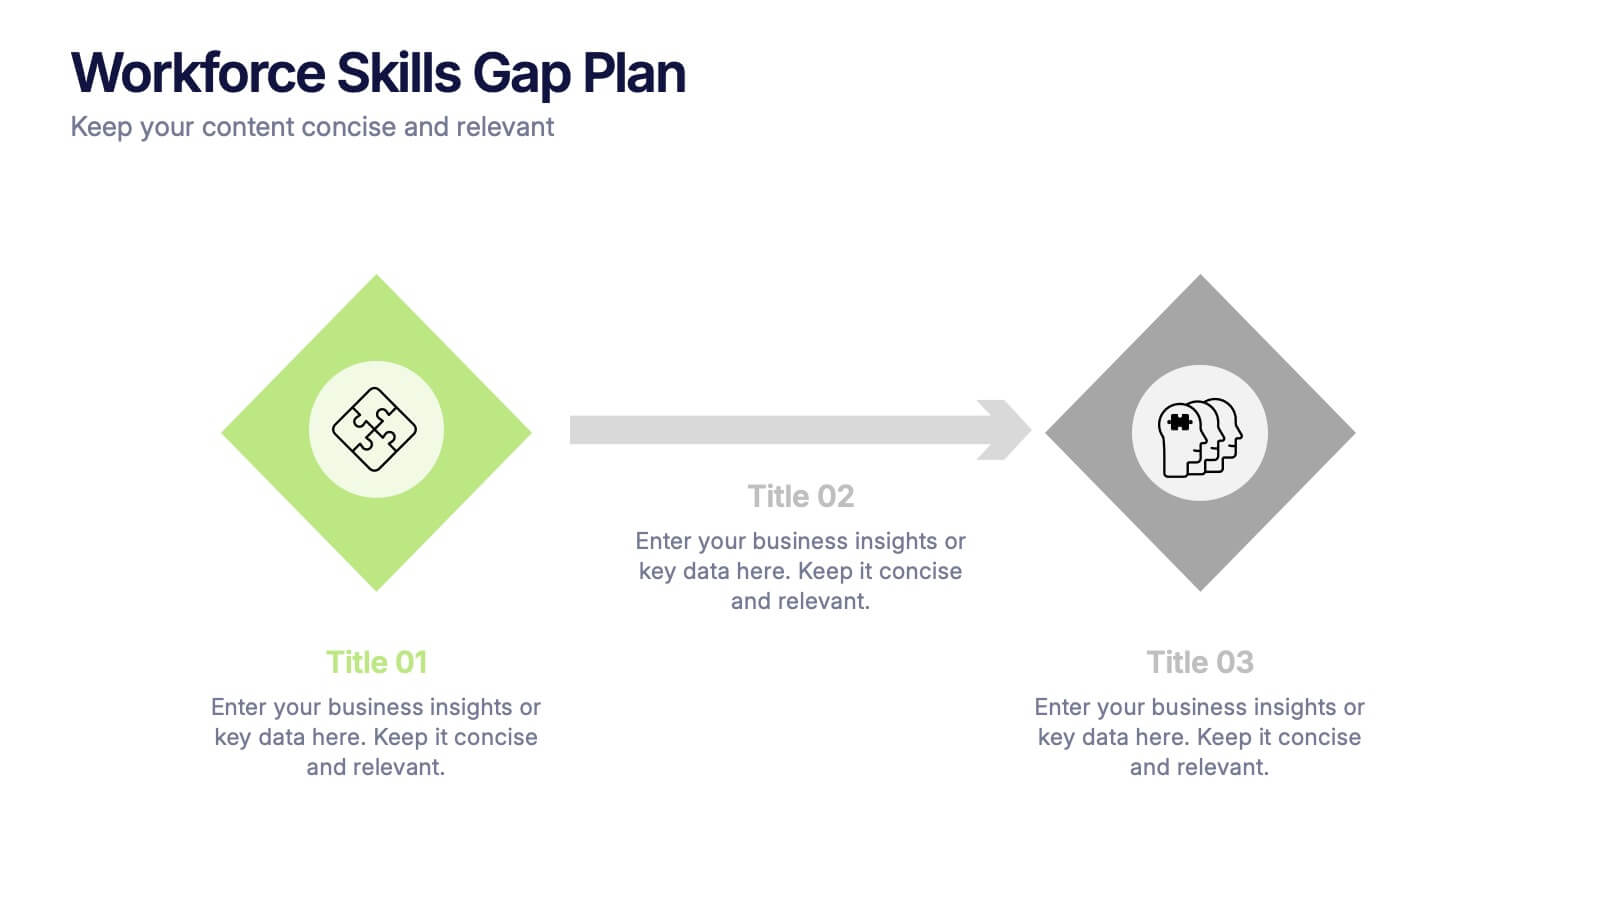
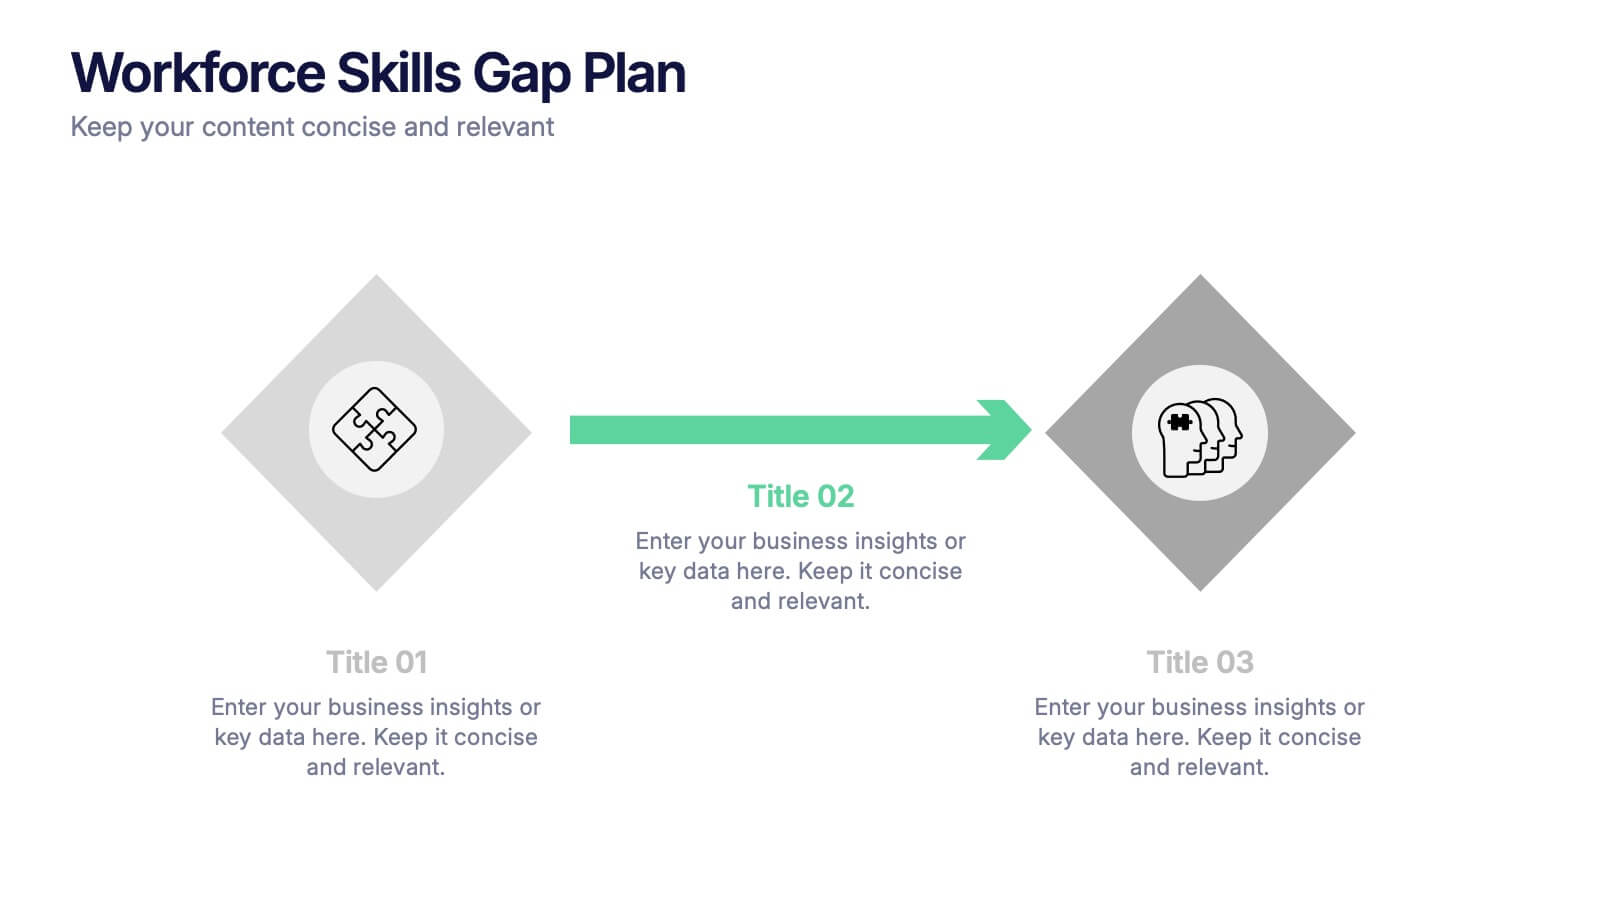
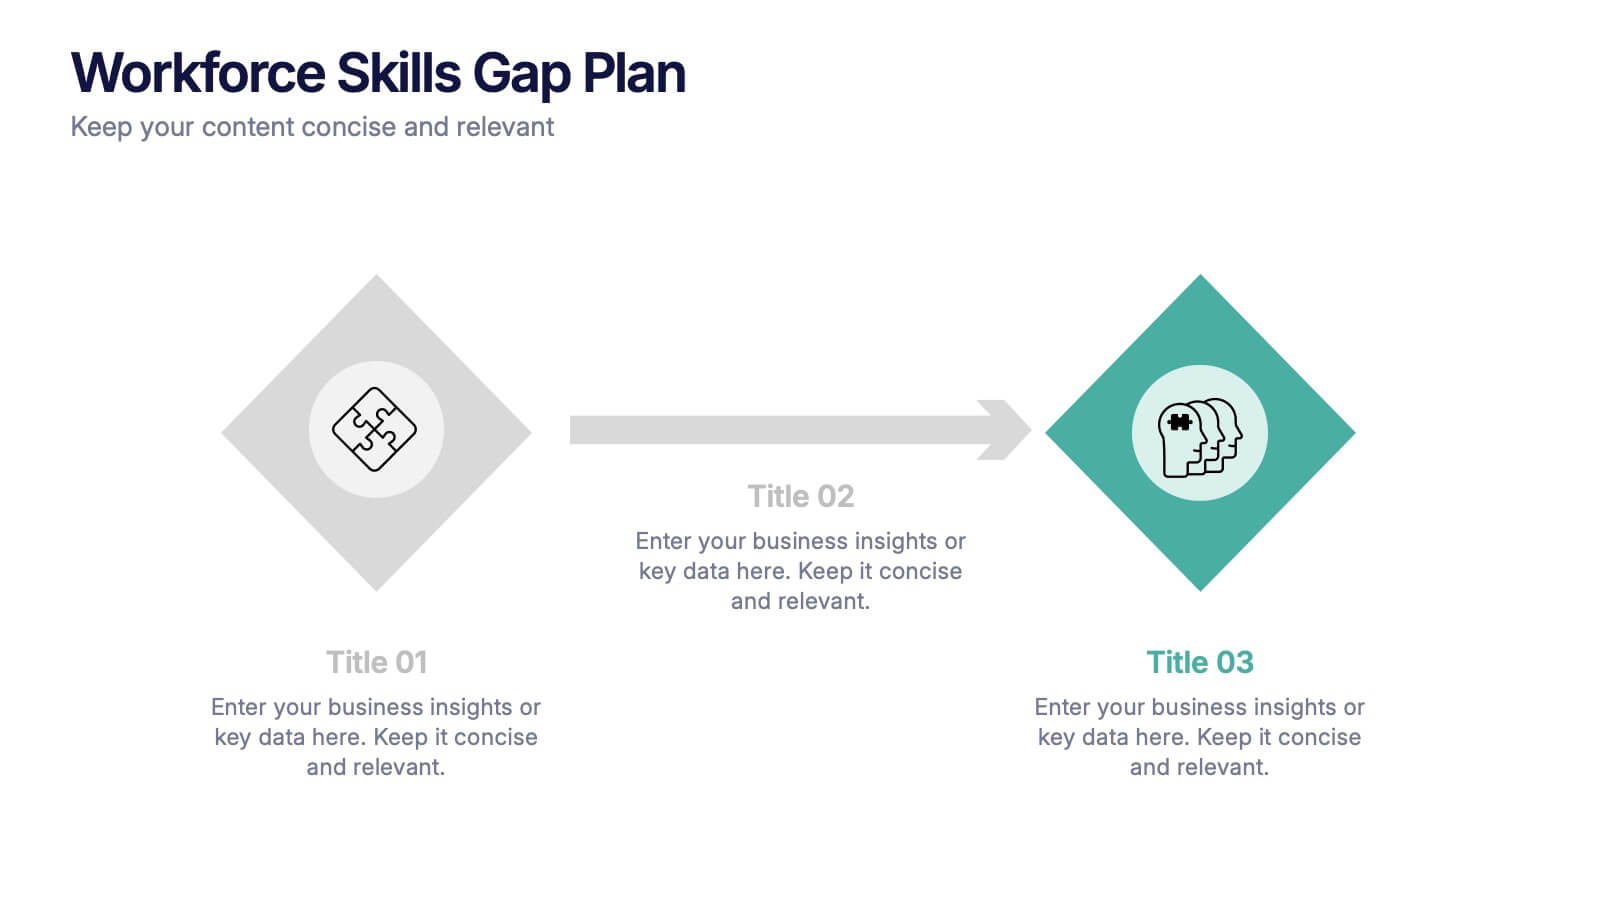
Ignite smarter workforce planning with a clear, engaging visual that highlights current capabilities, needed competencies, and actionable steps to close performance gaps. This presentation helps leaders map priorities, streamline development efforts, and strengthen team readiness for future demands. Fully compatible with PowerPoint, Keynote, and Google Slides.
- Remove from favorites
Powerpoint Template
1 MB
Google Slides Template
External link
Keynote Template
1 MB
5 slides
Editable Circular Flow Presentation
Streamline your presentations with this Editable Circular Flow template. Ideal for processes, workflows, and strategic planning, this diagram visually represents key steps in a structured format. Fully customizable and compatible with PowerPoint, Keynote, and Google Slides, it ensures clarity and professionalism for engaging, data-driven presentations.
- Remove from favorites
Powerpoint Template
1 MB
Google Slides Template
External link
Keynote Template
1 MB
6 slides
Investment Trust Infographic
An investment trust, also known as a closed-end fund, is a type of collective investment vehicle that pools funds from multiple investors to invest in a diversified portfolio of assets. This Infographic template visually communicates key information about investment trusts, which are financial vehicles from multiple investors to invest in a diversified portfolio of assets. This template highlights different types of investment, such as trusts, fixed-income trusts, or sector-specific trusts. The icons and images are included to represent each type. This infographic is fully customizable and compatible with Powerpoint, Keynote, and Google Slides.
- Remove from favorites
Powerpoint Template
1 MB
Google Slides Template
External link
Keynote Template
2 MB
7 slides
Challenge Infographic Presentation Template
Our Challenge Infographic template is designed for conveying the challenge, purpose, problem and solution of an issue. This template is perfect for presenting ideas and plans on any topic from business to education. It features a clean design that allows you to highlight your ideas with confidence. With this template, you will make your data stand out with a variety of charts, graphs and text to create contrast and guide the audience through your message. Our template is compatible with powerpoint and gives you the ability to customize all of the text boxes, colors and any other elements.
- Remove from favorites
Powerpoint Template
2 MB
Google Slides Template
External link
Keynote Template
3 MB
2 slides
Modern Business Title Slide Presentation
Step into the future of presentations with the "Modern Business Slide," designed to make your corporate message shine. This template features a sleek, minimalist layout with bold typography and a striking visual of a stylish office setting, perfect for making a professional impact. Ideal for any business presentation, it's compatible with PowerPoint, Keynote, and Google Slides, ensuring versatility across different platforms.


