Creative Geometric Infographic Presentation

PowerPoint Template and Google Slides Theme

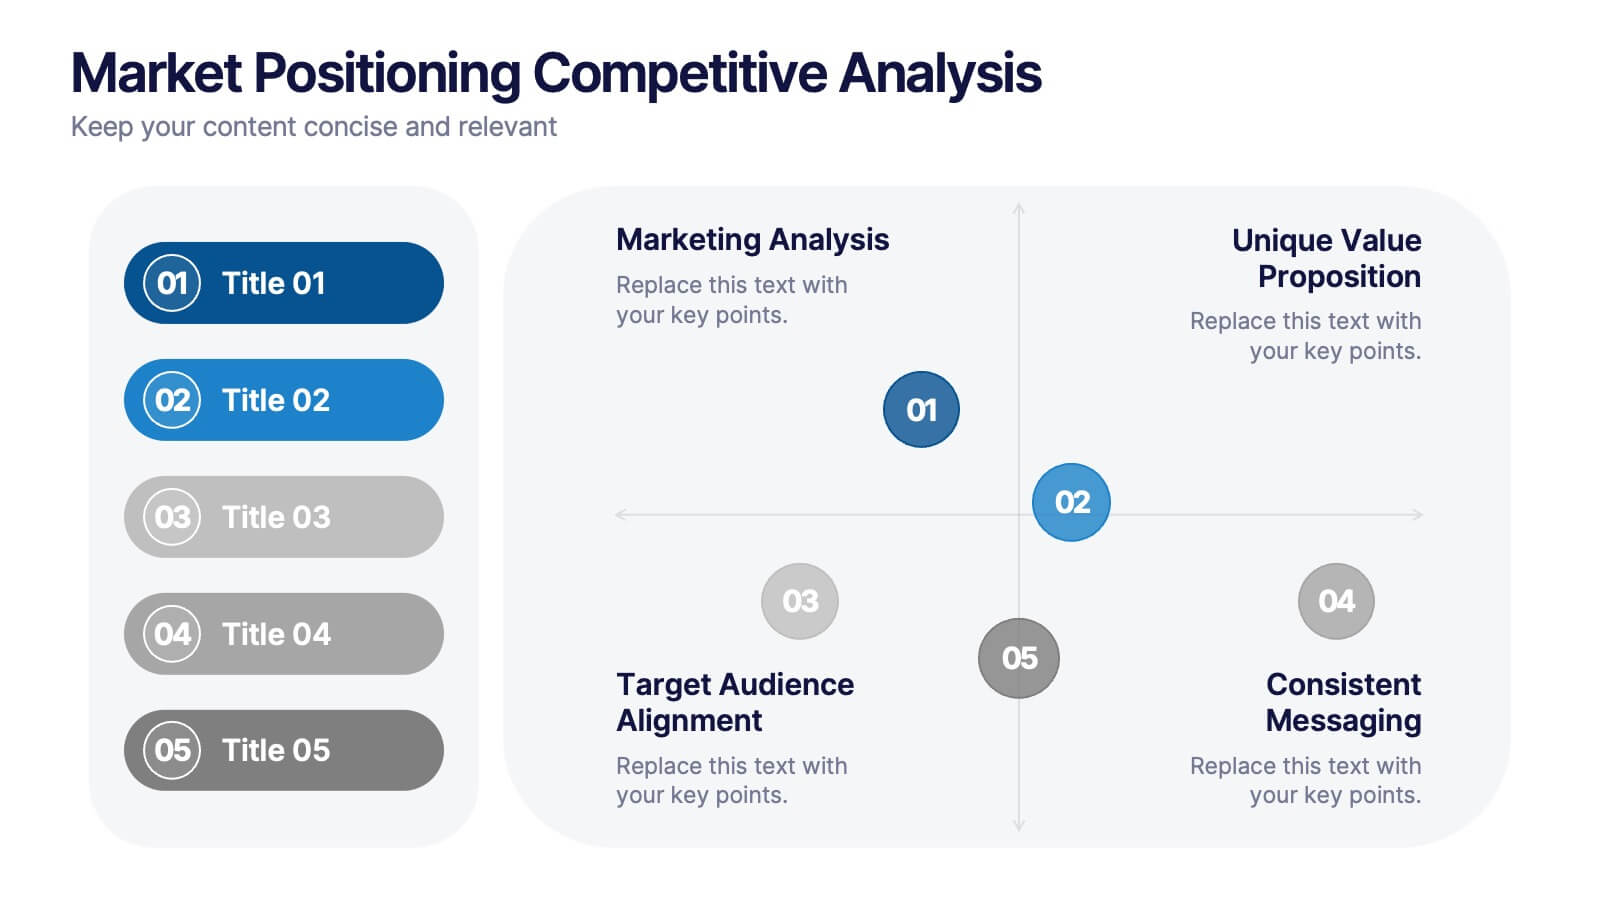
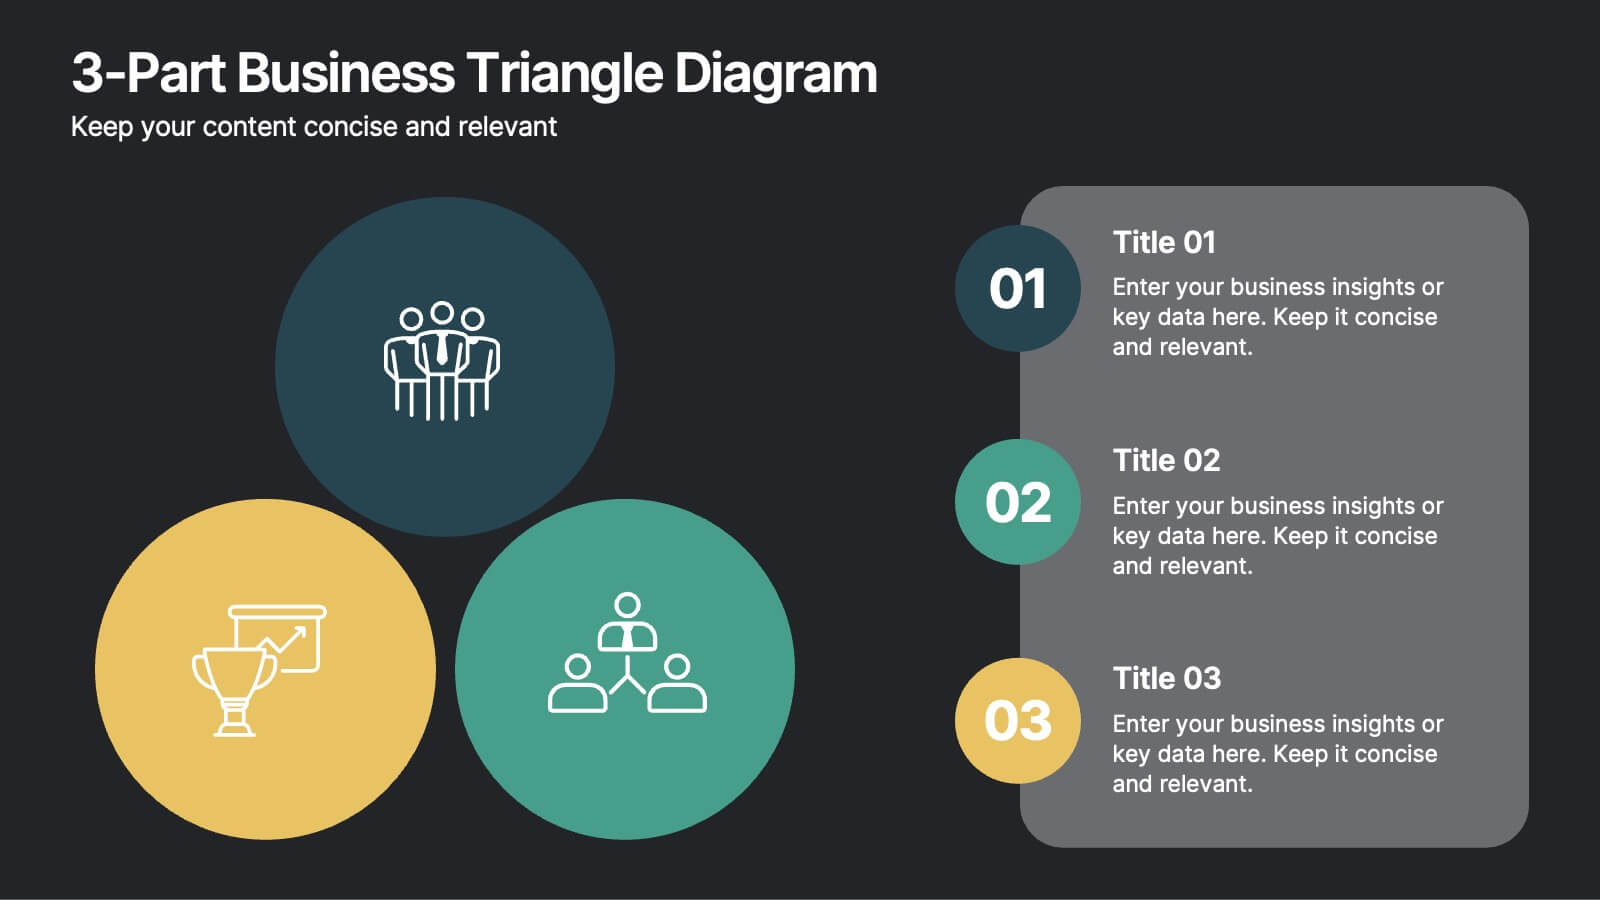
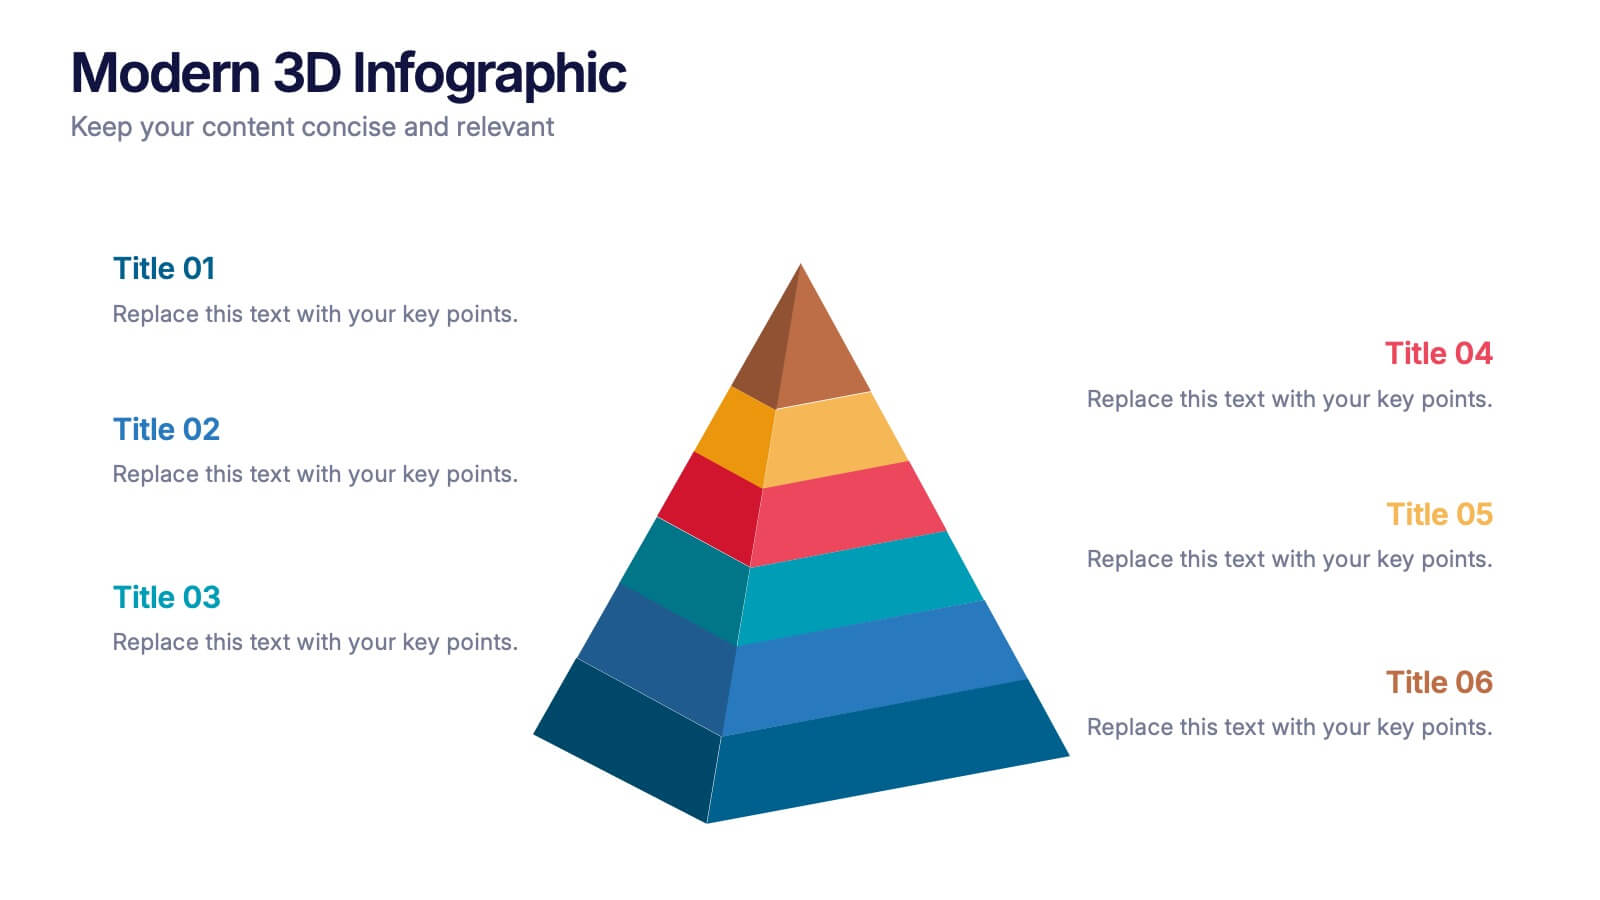
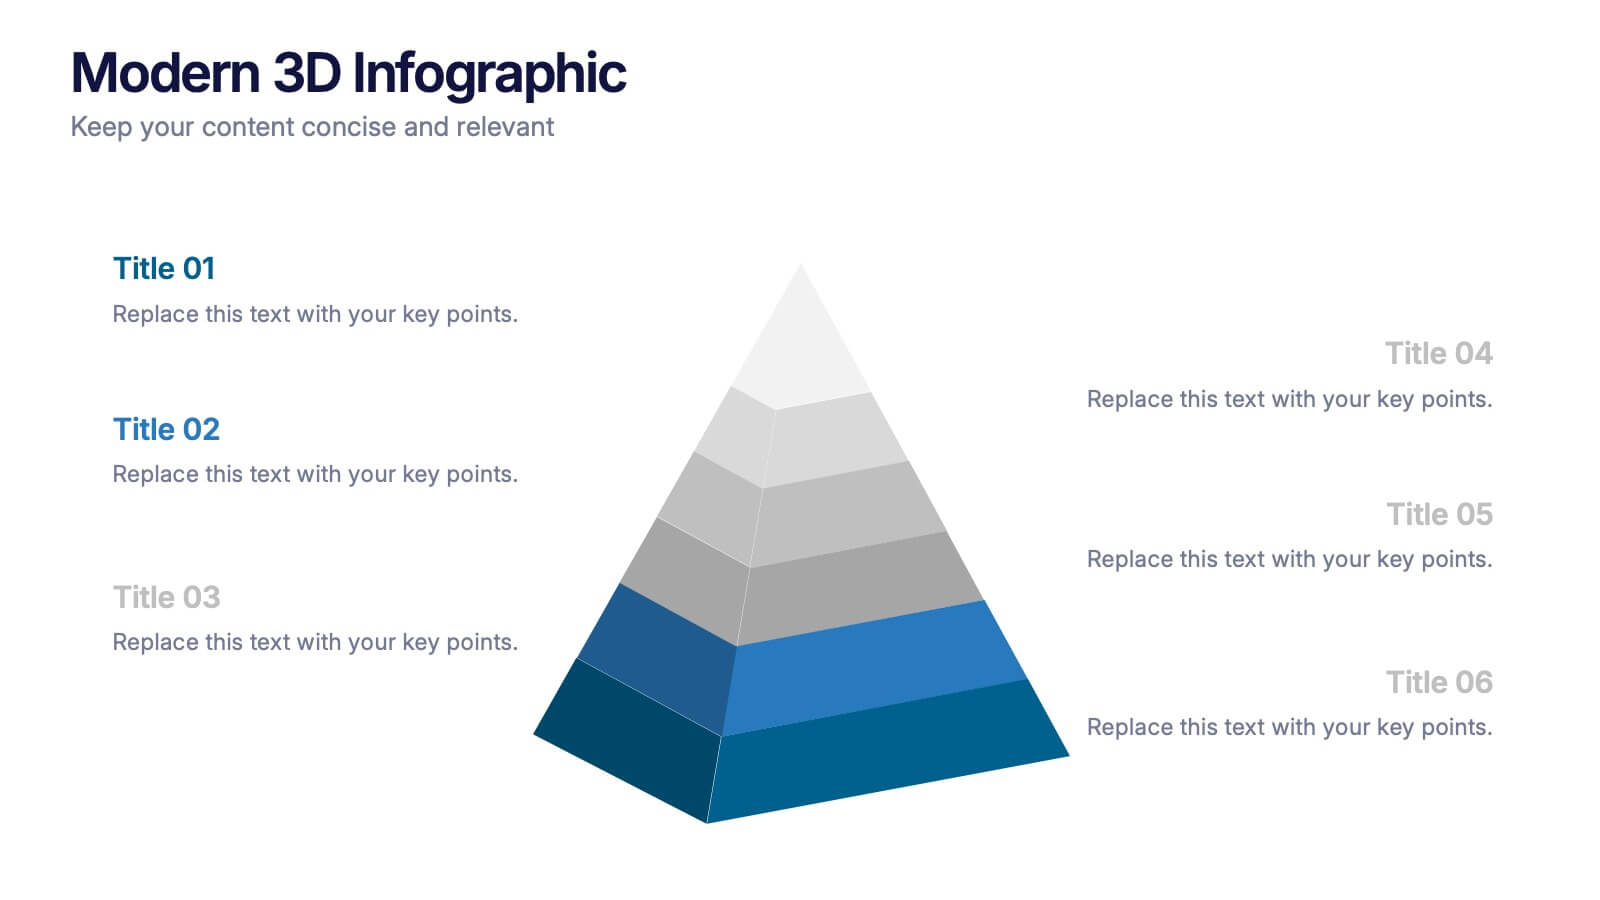
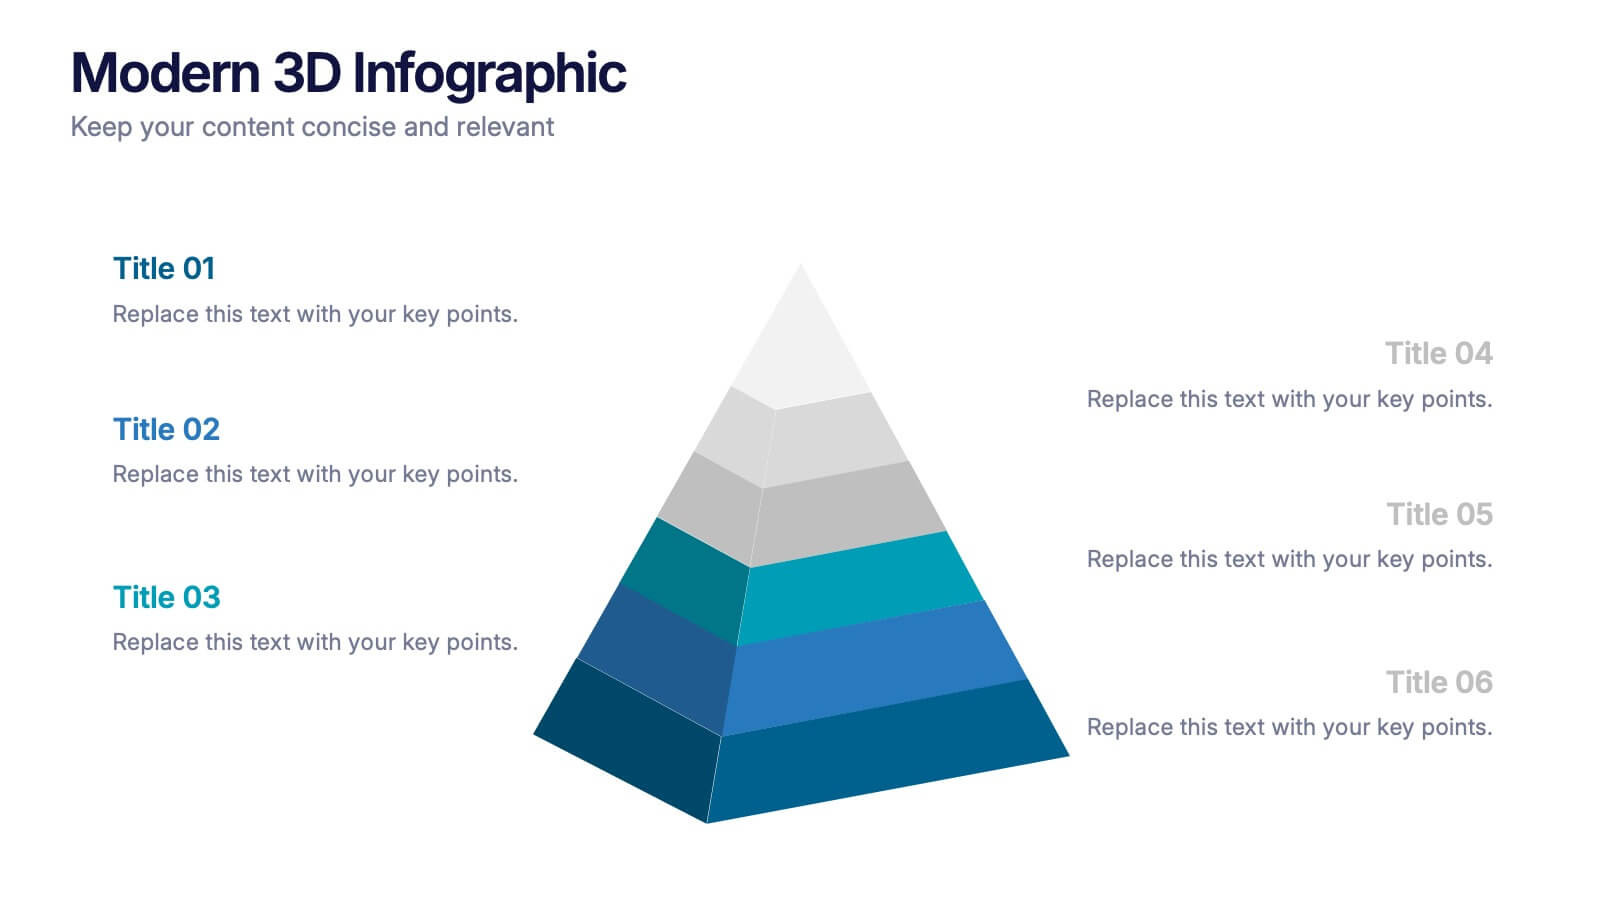
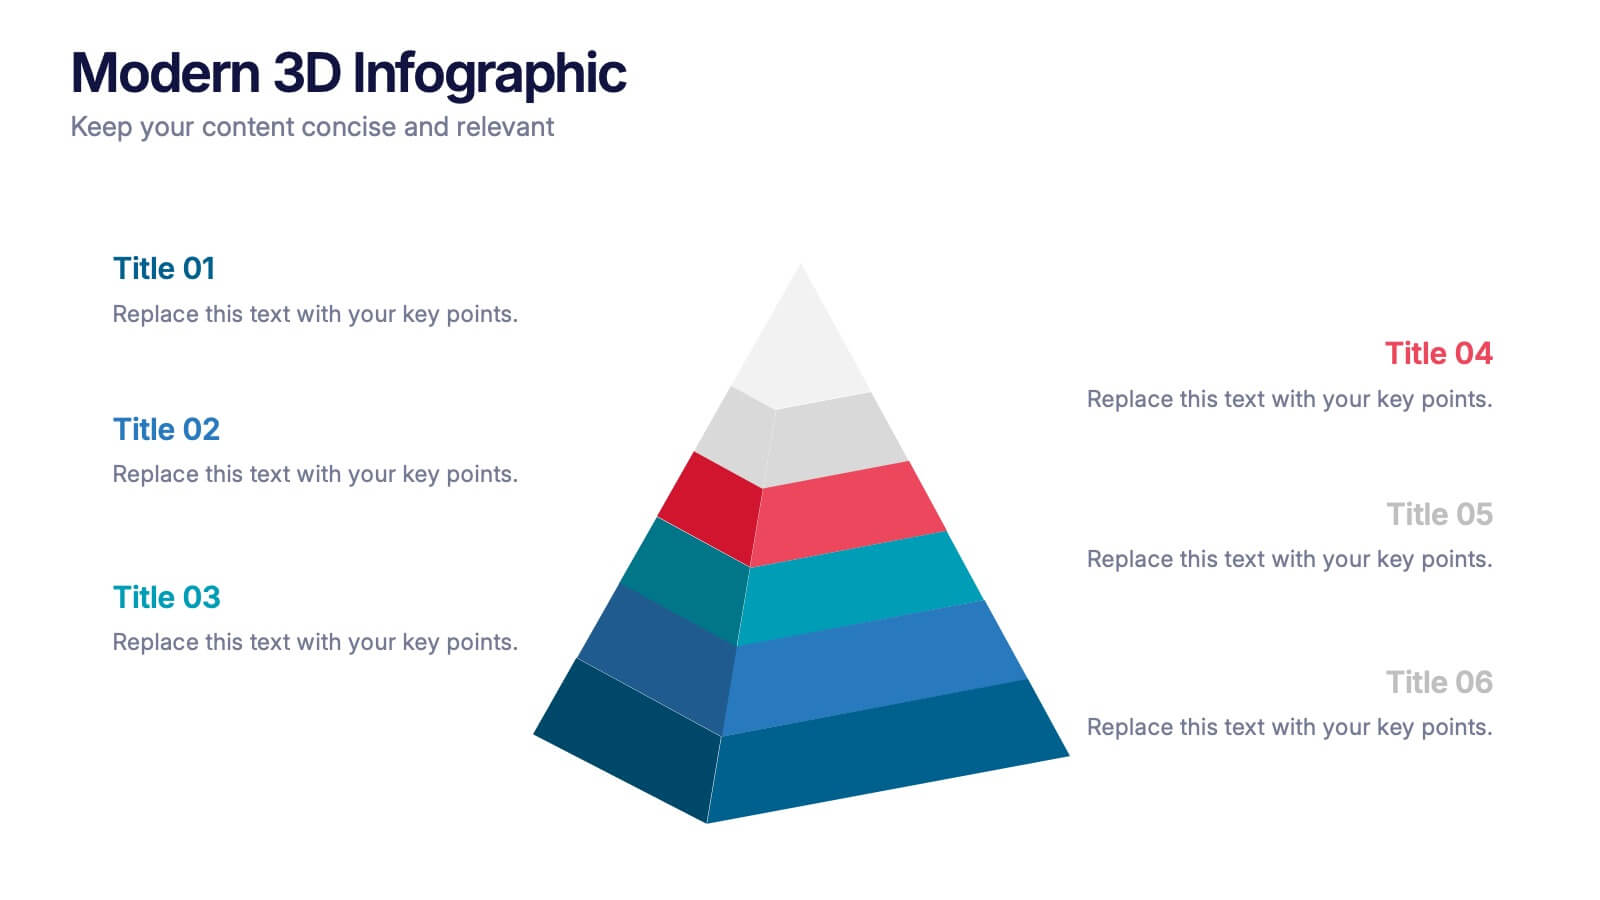
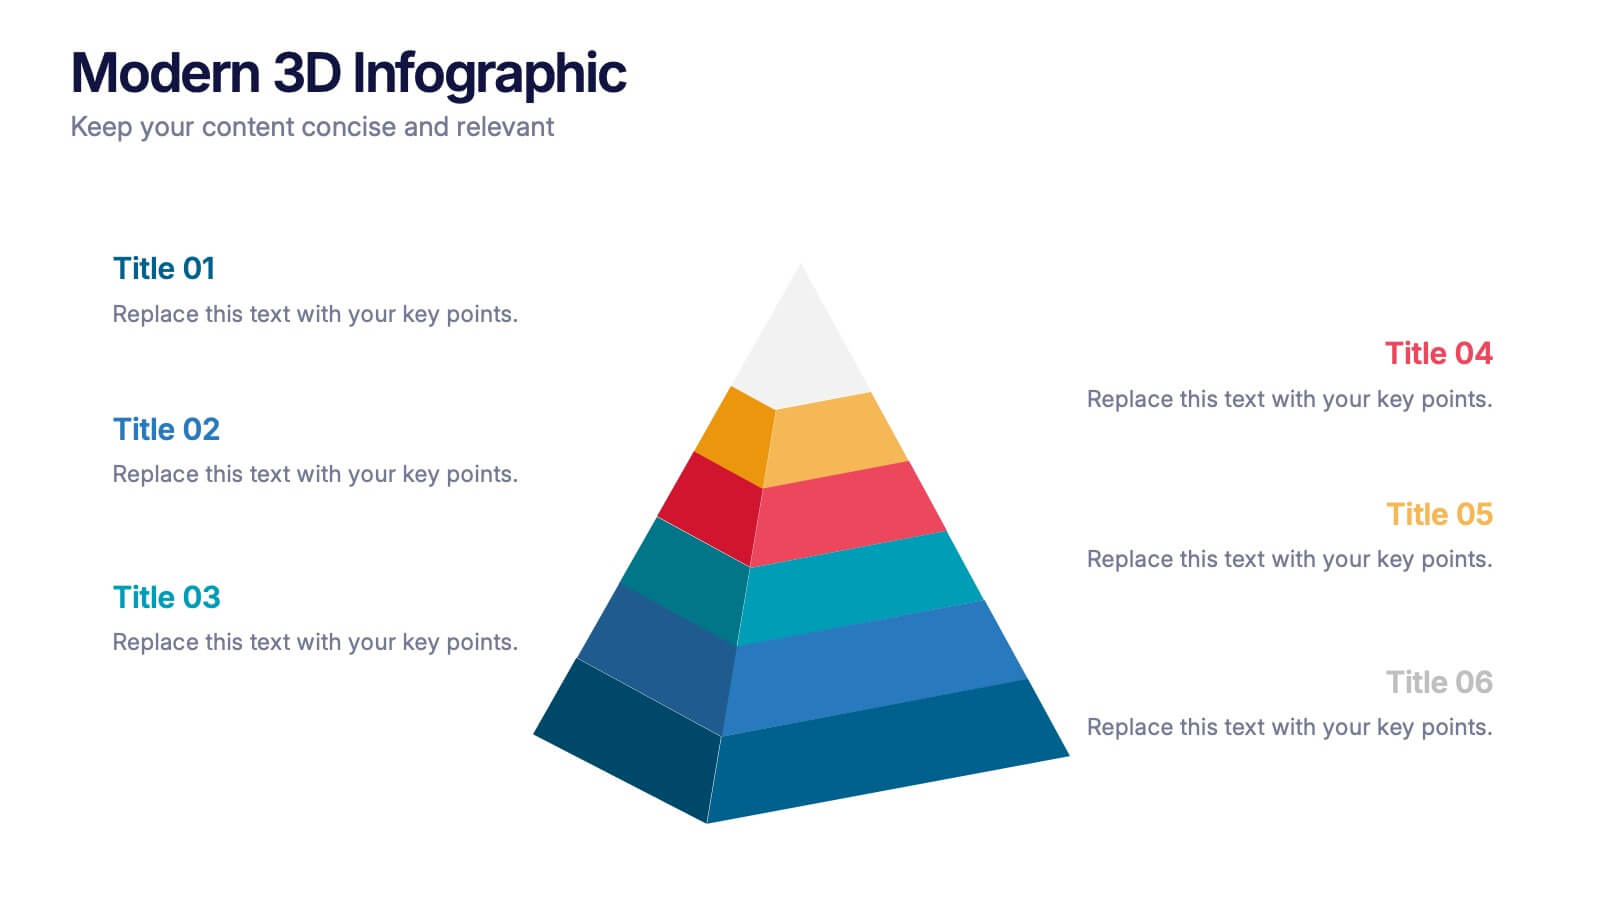
The "Creative Geometric Infographic" presentation template leverages dynamic circular shapes and interconnected designs to elegantly display information. This template provides a fresh, visually engaging way to present business insights, data points, or key concepts across multiple areas or themes. The use of distinct icons and varying color palettes within each segment helps highlight different aspects effectively while maintaining an organized look. It is an excellent choice for presentations that require a blend of creativity and clarity to communicate complex information efficiently. This setup is particularly useful for visually summarizing relationships or processes in business, technology, or educational fields.
Features
  • 5 Unique Slides
  • Fully editable and easy to edit in Microsoft Powerpoint, Keynote and Google Slides
  • 16:9 widescreen layout
  • Clean and professional designs
  • Export to JPG, PDF or send by email
decor

Do you have any questions?

Recommend

Self-sufficient Environmental InfographicSelf-sufficient Environmental InfographicSelf-sufficient Environmental InfographicSelf-sufficient Environmental InfographicSelf-sufficient Environmental InfographicSelf-sufficient Environmental InfographicSelf-sufficient Environmental Infographic
Premium

7 slides

Self-sufficient Environmental Infographic

In an era where sustainability is paramount, understanding self-sufficiency in environmental contexts has never been more crucial. Our refreshing infographic, adorned in crisp whites, lush greens, with subtle black nuances, delves deep into this pivotal subject. Crafted to be both educational and engaging, this infographic sheds light on the essentials of eco-friendly independence. It's a must-have tool for educators, environmental enthusiasts, policy-makers, and individuals aiming for a green footprint. Seamlessly integrated with PowerPoint, Keynote, and Google Slides, our infographic invites you to explore, educate, and empower for a more sustainable tomorrow.

Travel Infographic Presentation TemplateTravel Infographic Presentation TemplateTravel Infographic Presentation TemplateTravel Infographic Presentation TemplateTravel Infographic Presentation TemplateTravel Infographic Presentation TemplateTravel Infographic Presentation Template
Premium

7 slides

Travel Infographic Presentation Template

Our Travel Infographic is a gorgeous infographic template that allows you to instantly create a modern, stylish and eye-catching travel infographic. You can easily customize this travel infographic to suit all your needs in just a few minutes. This Travel Infographic is designed to used as a travel guide with tons of destinations, flight deals and tips to make your trip memorable. This template can be used to help you create dynamic visual content for your travels. This travel infographic is a perfect way to plan, organize and prepare for your next trip or for all the upcoming trips!

Storytelling in Education PresentationStorytelling in Education PresentationStorytelling in Education PresentationStorytelling in Education PresentationStorytelling in Education PresentationStorytelling in Education PresentationStorytelling in Education PresentationStorytelling in Education PresentationStorytelling in Education PresentationStorytelling in Education PresentationStorytelling in Education PresentationStorytelling in Education PresentationStorytelling in Education PresentationStorytelling in Education PresentationStorytelling in Education PresentationStorytelling in Education PresentationStorytelling in Education PresentationStorytelling in Education PresentationStorytelling in Education PresentationStorytelling in Education PresentationStorytelling in Education PresentationStorytelling in Education PresentationStorytelling in Education PresentationStorytelling in Education PresentationStorytelling in Education PresentationStorytelling in Education Presentation
Premium

26 slides

Storytelling in Education Presentation

Our "Storytelling in Education" template is the ideal canvas for those who understand that the heart of learning is a good story. Whether you're presenting with PowerPoint, Keynote, or Google Slides, this template helps you weave compelling tales into your educational content. With the "Greatest Art in The World: The Art Of Storytelling" slide, set the tone for the transformative power of stories in teaching. The "Table of Contents" organizes your narrative journey, while "Meet Our Team" introduces the storytellers shaping educational experiences. The "Three Option Slide" and "Four Option Slide" illustrate choices in narrative paths. Use the "Brain Infographic" to show storytelling's impact on learning, and the "Process Infographic" to outline narrative frameworks. The "Timeline Infographic" can chart the history of storytelling, and the "Africa Map" slide connects tales across continents. Personalize this template to your storytelling approach, ensuring your "Storytelling in Education" presentation captivates minds and fosters unforgettable learning.

Ancient CivilIzations History PresentationAncient CivilIzations History PresentationAncient CivilIzations History PresentationAncient CivilIzations History PresentationAncient CivilIzations History PresentationAncient CivilIzations History PresentationAncient CivilIzations History PresentationAncient CivilIzations History PresentationAncient CivilIzations History PresentationAncient CivilIzations History PresentationAncient CivilIzations History PresentationAncient CivilIzations History PresentationAncient CivilIzations History PresentationAncient CivilIzations History PresentationAncient CivilIzations History PresentationAncient CivilIzations History PresentationAncient CivilIzations History PresentationAncient CivilIzations History PresentationAncient CivilIzations History PresentationAncient CivilIzations History PresentationAncient CivilIzations History PresentationAncient CivilIzations History PresentationAncient CivilIzations History PresentationAncient CivilIzations History PresentationAncient CivilIzations History PresentationAncient CivilIzations History Presentation
Premium

26 slides

Ancient CivilIzations History Presentation

Take a journey through time with this richly designed presentation template, ideal for delving into the history of ancient civilizations. The deep, earthy tones and iconic images of age-old monuments provide a window into the past, setting the stage for a historical exploration. This template is perfect for educators, historians, and students, offering an array of slides that can be used to discuss the culture, architecture, and significant events of bygone eras. The strategic use of maps, timelines, and comparative analysis encourages a deeper understanding of the connections between ancient societies and their legacies. With compatibility across PowerPoint, Keynote, and Google Slides, this template equips you with the tools to create an educational experience that’s not only informative but also visually captivating.

Watercolor Plan InfographicWatercolor Plan InfographicWatercolor Plan InfographicWatercolor Plan InfographicWatercolor Plan InfographicWatercolor Plan InfographicWatercolor Plan Infographic
Premium

7 slides

Watercolor Plan Infographic

A watercolor plan infographic refers to an infographic design or style that incorporates elements of watercolor painting. Dive into the world of dreams and aspirations with our watercolor plan infographic template. This artistic and visually captivating infographic guides you through your plans and goals with the fluidity and creativity of watercolors. This infographic is a visually stunning and inspiring template that transforms the process of goal setting into an artistic masterpiece, encouraging individuals to paint their dreams with vivid hues of determination and creativity.

IT Architecture Solution InfographicIT Architecture Solution InfographicIT Architecture Solution InfographicIT Architecture Solution InfographicIT Architecture Solution InfographicIT Architecture Solution InfographicIT Architecture Solution Infographic
Premium

7 slides

IT Architecture Solution Infographic

Enhance your presentations with our IT Architecture Solution infographic, tailored for optimal clarity in Powerpoint, Keynote, and Google Slides. This infographic offers a comprehensive visual tool to simplify complex IT structures, ideal for professionals aiming to articulate intricate systems with ease. Its design facilitates a clear understanding of hierarchical IT frameworks, making it perfect for educational environments, business meetings, and tech conferences. Our IT Architecture Solution infographic is crafted to aid in the seamless conveyance of IT strategies and structures. The intuitive layout provides a straightforward narrative to IT infrastructure, ensuring your audience grasps technical details without feeling overwhelmed. This infographic is a must-have for anyone presenting IT concepts, delivering a balanced combination of simplicity and detail that caters to both novice and expert levels. With compatibility across various presentation platforms, this infographic integrates smoothly into your existing slides, enhancing your ability to communicate effectively in the digital age. Elevate your IT presentations with this essential visual aid.

Concentric Circle Diagrams Infographic Presentation TemplateConcentric Circle Diagrams Infographic Presentation TemplateConcentric Circle Diagrams Infographic Presentation TemplateConcentric Circle Diagrams Infographic Presentation TemplateConcentric Circle Diagrams Infographic Presentation TemplateConcentric Circle Diagrams Infographic Presentation TemplateConcentric Circle Diagrams Infographic Presentation Template
Premium

7 slides

Concentric Circle Diagrams Infographic Presentation Template

Concentric Circle Diagrams can display interrelated and independent units of a concept in overlapping circular designs. The diagram is really helpful for organizing information, displaying relationships among concepts, showing whole-part relationships and more. It uses overlapping circular designs to display ideas and separate them with their own size, color and position on a chart. This template contains a variety of circular diagram that display in overlapping different-shaded circles. This template can be used to demonstrate the relationship of all elements to the central idea.

Operational Risk Management InfographicOperational Risk Management InfographicOperational Risk Management InfographicOperational Risk Management InfographicOperational Risk Management InfographicOperational Risk Management InfographicOperational Risk Management Infographic
Premium

7 slides

Operational Risk Management Infographic

Dive into the methodical domain of risk management with our sleek risk management infographic. Cloaked in varying blue tones, our template embodies the serenity and stability that effective risk management brings to operations. Enhanced with precise infographics, clear icons, and relevant image placeholders, it transforms complex risk analysis into easily comprehensible visual insights. Flawlessly crafted for Powerpoint, Keynote, or Google Slides. A pivotal tool for business strategists, operations managers, financial analysts, or any organization aiming to fortify its operational resilience. Strategize with clarity; let every slide be a shield against potential pitfalls.

The Best Fireworks Displays in the U.S. PresentationThe Best Fireworks Displays in the U.S. PresentationThe Best Fireworks Displays in the U.S. PresentationThe Best Fireworks Displays in the U.S. PresentationThe Best Fireworks Displays in the U.S. PresentationThe Best Fireworks Displays in the U.S. PresentationThe Best Fireworks Displays in the U.S. PresentationThe Best Fireworks Displays in the U.S. PresentationThe Best Fireworks Displays in the U.S. PresentationThe Best Fireworks Displays in the U.S. PresentationThe Best Fireworks Displays in the U.S. PresentationThe Best Fireworks Displays in the U.S. PresentationThe Best Fireworks Displays in the U.S. PresentationThe Best Fireworks Displays in the U.S. PresentationThe Best Fireworks Displays in the U.S. PresentationThe Best Fireworks Displays in the U.S. PresentationThe Best Fireworks Displays in the U.S. PresentationThe Best Fireworks Displays in the U.S. PresentationThe Best Fireworks Displays in the U.S. PresentationThe Best Fireworks Displays in the U.S. PresentationThe Best Fireworks Displays in the U.S. PresentationThe Best Fireworks Displays in the U.S. PresentationThe Best Fireworks Displays in the U.S. PresentationThe Best Fireworks Displays in the U.S. PresentationThe Best Fireworks Displays in the U.S. PresentationThe Best Fireworks Displays in the U.S. Presentation
Premium

26 slides

The Best Fireworks Displays in the U.S. Presentation

Experience the magic of dazzling lights with this exciting presentation on the best fireworks displays in the U.S. Covering iconic celebrations, historical traditions, must-visit locations, and expert photography tips, this template helps bring the spectacle to life. Fully customizable and compatible with PowerPoint, Keynote, and Google Slides for a seamless presentation experience.

Chemistry Lessons InfographicsChemistry Lessons InfographicsChemistry Lessons InfographicsChemistry Lessons InfographicsChemistry Lessons Infographics
Premium

5 slides

Chemistry Lessons Infographics

Dive into the fascinating world of chemistry with our chemistry lessons infographics. Set against a backdrop of bold orange, black, and blue, this template captures the vibrant essence of chemical reactions and laboratory experiments. Tailored for educators, students, and science enthusiasts, this collection is perfect for enhancing lesson plans, study materials, or research presentations. Compatible with Powerpoint, Keynote, and Google Slides. With its creative, lab-themed design, each infographic is enriched with striking graphics and icons, providing a visual feast that simplifies complex concepts and promotes the joy of learning chemistry.

Mortgage Comparison InfographicMortgage Comparison InfographicMortgage Comparison InfographicMortgage Comparison InfographicMortgage Comparison InfographicMortgage Comparison InfographicMortgage Comparison Infographic
Premium

7 slides

Mortgage Comparison Infographic

Make the home buying decision easier with our mortgage comparison infographic template. This user-friendly and visually engaging infographic allows you to compare different mortgage options, helping your audience make informed financial choices. Use the charts to illustrate how the loan term impacts the total cost of the mortgage, making it easier to choose the right term. Fully customizable and compatible with Powerpoint, Keynote, and Google Slides. With this template, you can demystify mortgage options and empower individuals to choose the mortgage that best fits their needs and financial goals.

Digital Business Strategy InfographicDigital Business Strategy InfographicDigital Business Strategy InfographicDigital Business Strategy InfographicDigital Business Strategy InfographicDigital Business Strategy InfographicDigital Business Strategy Infographic
Premium

7 slides

Digital Business Strategy Infographic

Navigate the complex landscape of digital business strategy with this comprehensive infographic template, which is meticulously designed to aid business strategists, entrepreneurs, and students in understanding and developing effective business plans. This resource breaks down the core components of a successful business strategy into digestible, visually engaging segments. The template spans several key areas of strategic planning including execution, governance, planning, marketing, and innovation. Each section is clearly delineated with vibrant colors and icons that correspond to different aspects of business strategy, such as venture, capital, and brand positioning. The layout is thoughtfully organized to guide the viewer through the process step-by-step, making complex concepts accessible and straightforward. Utilizing a clean and professional design, this template is ideal for presentations, educational materials, or as a visual aid during business meetings. It provides a clear roadmap for aligning digital tools and platforms with business objectives, highlighting the pathways to profitability and market expansion. Whether for internal strategy sessions, academic purposes, or entrepreneurial pitches, this infographic is an invaluable tool for conveying the essentials of digital business strategy effectively and efficiently.

Cells Biology Research PresentationCells Biology Research PresentationCells Biology Research PresentationCells Biology Research PresentationCells Biology Research PresentationCells Biology Research PresentationCells Biology Research PresentationCells Biology Research PresentationCells Biology Research PresentationCells Biology Research PresentationCells Biology Research PresentationCells Biology Research PresentationCells Biology Research PresentationCells Biology Research PresentationCells Biology Research PresentationCells Biology Research PresentationCells Biology Research PresentationCells Biology Research PresentationCells Biology Research PresentationCells Biology Research PresentationCells Biology Research PresentationCells Biology Research PresentationCells Biology Research PresentationCells Biology Research PresentationCells Biology Research PresentationCells Biology Research Presentation
Premium

26 slides

Cells Biology Research Presentation

Cells biology is a branch of biology that focuses on the study of cells, which are the basic structural and functional units of all living organisms. This presentation template provides a visually engaging and well-structured approach to explore the fascinating world of cells and their intricate functions. This is perfect to present your research findings or discoveries related to cellular biology. Use the graphs, charts, and data visualizations to showcase your data effectively. This well-organized template will effectively communicate the complexities and importance of cellular biology, making it a great tool for anyone involved in cell research.

Environment Preservation InfographicsEnvironment Preservation InfographicsEnvironment Preservation InfographicsEnvironment Preservation InfographicsEnvironment Preservation Infographics
Premium

5 slides

Environment Preservation Infographics

Environment preservation refers to the protection, conservation, and sustainable management of natural resources and ecosystems to maintain their integrity and ensure their long-term viability. These vertical infographics are designed to raise awareness about the current environmental challenges and inspire individuals and communities to take action to protect and conserve the environment. It can be used in presentations, workshops, educational campaigns, and sustainability initiatives to inspire individuals, organizations, and communities to take steps towards a more sustainable and resilient future. Compatible with Powerpoint, Keynote, and google Slides.

Gantt Chart Management InfographicGantt Chart Management InfographicGantt Chart Management InfographicGantt Chart Management InfographicGantt Chart Management InfographicGantt Chart Management InfographicGantt Chart Management Infographic
Premium

7 slides

Gantt Chart Management Infographic

Elevate your project planning with our gantt chart management infographic. Laid out on a pristine white backdrop and highlighted with the professional shades of blue, regal purple, energetic red, and growth-centric green, this template is the epitome of structured time management. Equipped with illustrative infographics, symbolic icons, and dedicated image placeholders, it breaks down project timelines and tasks with immaculate precision. Immaculately tailored for Powerpoint, Keynote, or Google Slides. An invaluable asset for project managers, team leaders, corporate trainers, or anyone aiming for meticulous time tracking and project progression.

Speech Therapy for Adults PresentationSpeech Therapy for Adults PresentationSpeech Therapy for Adults PresentationSpeech Therapy for Adults PresentationSpeech Therapy for Adults PresentationSpeech Therapy for Adults PresentationSpeech Therapy for Adults PresentationSpeech Therapy for Adults PresentationSpeech Therapy for Adults PresentationSpeech Therapy for Adults PresentationSpeech Therapy for Adults PresentationSpeech Therapy for Adults PresentationSpeech Therapy for Adults PresentationSpeech Therapy for Adults PresentationSpeech Therapy for Adults PresentationSpeech Therapy for Adults PresentationSpeech Therapy for Adults PresentationSpeech Therapy for Adults PresentationSpeech Therapy for Adults PresentationSpeech Therapy for Adults PresentationSpeech Therapy for Adults PresentationSpeech Therapy for Adults PresentationSpeech Therapy for Adults PresentationSpeech Therapy for Adults PresentationSpeech Therapy for Adults PresentationSpeech Therapy for Adults Presentation
Premium

26 slides

Speech Therapy for Adults Presentation

Enhance communication with our Speech Therapy for Adults presentation template, a versatile tool for PowerPoint, Keynote, and Google Slides. This template is expertly designed for speech therapists, healthcare professionals, and educators working with adults to improve their speech and communication skills. The thoughtful layout and calming color scheme provide a supportive atmosphere for learning and development. The slides are crafted to facilitate the presentation of strategies, exercises, and progress in speech therapy sessions. From introducing the therapy team to detailed process infographics, this template supports a wide range of content. Use the mind map infographic to explain the connections between speech and cognition, and the comparison slides to show therapy techniques and their effectiveness. Our Speech Therapy for Adults template is more than a presentation; it's a pathway to clearer communication. Download it now to empower your clients and guide them towards successful expression, one slide at a time.

AIDA Model Marketing InfographicsAIDA Model Marketing InfographicsAIDA Model Marketing InfographicsAIDA Model Marketing InfographicsAIDA Model Marketing Infographics
Premium

5 slides

AIDA Model Marketing Infographics

The AIDA model is a marketing and advertising framework that outlines the stages a consumer goes through during the decision-making process.This AIDA model is a widely used marketing framework that outlines the stages a customer goes through in the buying process: Attention, Interest, Desire, and Action. These infographic templates are effective tools for explaining and illustrating the AIDA model in marketing presentations, training sessions, or educational materials. These infographics will enable your audience to apply the AIDA model in their marketing strategies, campaigns, and customer engagement efforts.