


Features
- 5 Unique slides
- Fully editable and easy to edit in Microsoft Powerpoint, Keynote and Google Slides
- 16:9 widescreen layout
- Clean and professional designs
- Export to JPG, PDF or send by email


Do you have any questions?
Recommend


5 slides
Business Process Checklist Presentation
Ensure smooth workflows with the Business Process Checklist template. This visually structured layout simplifies process tracking, highlighting key steps and completion percentages. Perfect for project managers and teams looking to optimize efficiency. Fully editable and compatible with PowerPoint, Keynote, and Google Slides for easy customization and seamless presentation.


4 slides
Funding & Investor Startup Presentation
Present your investment strategy with clarity and impact using this triangle diagram slide. Ideal for showcasing the relationship between key funding stages, investor types, or business milestones, this layout offers a clean structure with labeled nodes (A, B, C) and supporting icons. Fully editable in PowerPoint, Keynote, and Google Slides for seamless customization.


7 slides
TAM SAM SOM Infographic Presentation Template
TAM, SAM and SOM are acronyms that represents different subsets of a market. Which stand for (TAM) Total Addressable Market, (SAM) Serviceable Addressable Market, and (SOM) Serviceable Obtainable Market. Understanding these acronyms can help you better target your marketing efforts to potential customers. This presentation template is a great tool to organize and plan any of your important business projects. Using this template can become critically important to the very foundation of your business model, and TAM, SAM, SOM should be key components to craft the details of your business plan.


6 slides
Effective Leadership Skills Presentation
Build stronger teams with this effective leadership skills template, featuring a colorful building block design to represent key competencies. Ideal for leadership workshops, corporate training, and professional development, it visually organizes six core skills. Fully editable in Canva, PowerPoint, or Google Slides for easy customization to match your organization’s style.


7 slides
Africa Map Infographic Presentation Template
The African continent is home to a great deal of linguistic and cultural diversity. Africa has approximately one-third of the world's languages. There are at least seventy-five African languages with more than one million speakers. The diversity of Africa's languages is evidenced by their populations. This template features fully editable vector shapes of countries, national flags and lines to highlight routes across this diverse continent. Use this Africa map template to illustrate the countries of Africa and their borders. You can easily add information, such as other icons in the blank spaces.


5 slides
CBD Industry Infographics
CBD, or cannabidiol, is a natural compound derived from the hemp plant that has gained popularity in recent years for its potential therapeutic benefits. This infographic template is perfect if you want to educate others on the CBD industry. These vertical infographics are designed to help you provide a concise and engaging way to present facts, statistics, and trends about CBD products, usage, benefits, regulations, and market growth. This template can be used by CBD companies, health professionals, and educational institutions to inform and educate their audience about the industry and important considerations.


6 slides
Strategic Triangle Layout Presentation
Turn your ideas into a visual roadmap with this sleek, geometric layout that balances design and strategy. Perfect for illustrating workflows, key milestones, or connected concepts, it helps your message flow seamlessly across stages. Fully editable and compatible with PowerPoint, Keynote, and Google Slides for effortless customization.


5 slides
Business KPI Performance Presentation
Bring your business results to life with a clear, modern layout designed to showcase key metrics and performance goals. Perfect for tracking growth, progress, and success indicators, this visual design helps make data easy to understand and engaging. Fully editable in PowerPoint, Keynote, and Google Slides.


7 slides
Real Estate Market Analysis Presentation
Bring energy and clarity to your insights with this dynamic slide designed to break down key market factors in a simple, visual flow. It helps you explain trends, opportunities, and performance drivers with ease, making complex real estate data feel intuitive and organized. Fully compatible with PowerPoint, Keynote, and Google Slides.


4 slides
AIDA Steps in Consumer Behavior
Showcase the psychology of purchase decisions with the AIDA Steps in Consumer Behavior Presentation. This sleek, modern template visually maps out the Attention, Interest, Desire, and Action stages using intuitive shapes and icons. Ideal for marketers, educators, and sales teams looking to explain buying behavior clearly. Compatible with PowerPoint, Keynote, and Google Slides.


4 slides
Business Executive Summary Report
Get straight to the point with a clean, colorful slide designed to capture big-picture business insights at a glance. Perfect for summarizing key metrics, strategies, and results, this executive summary template keeps your presentation sharp, structured, and impactful. Fully compatible with PowerPoint, Keynote, and Google Slides for maximum flexibility.


21 slides
Journey Annual Report Presentation
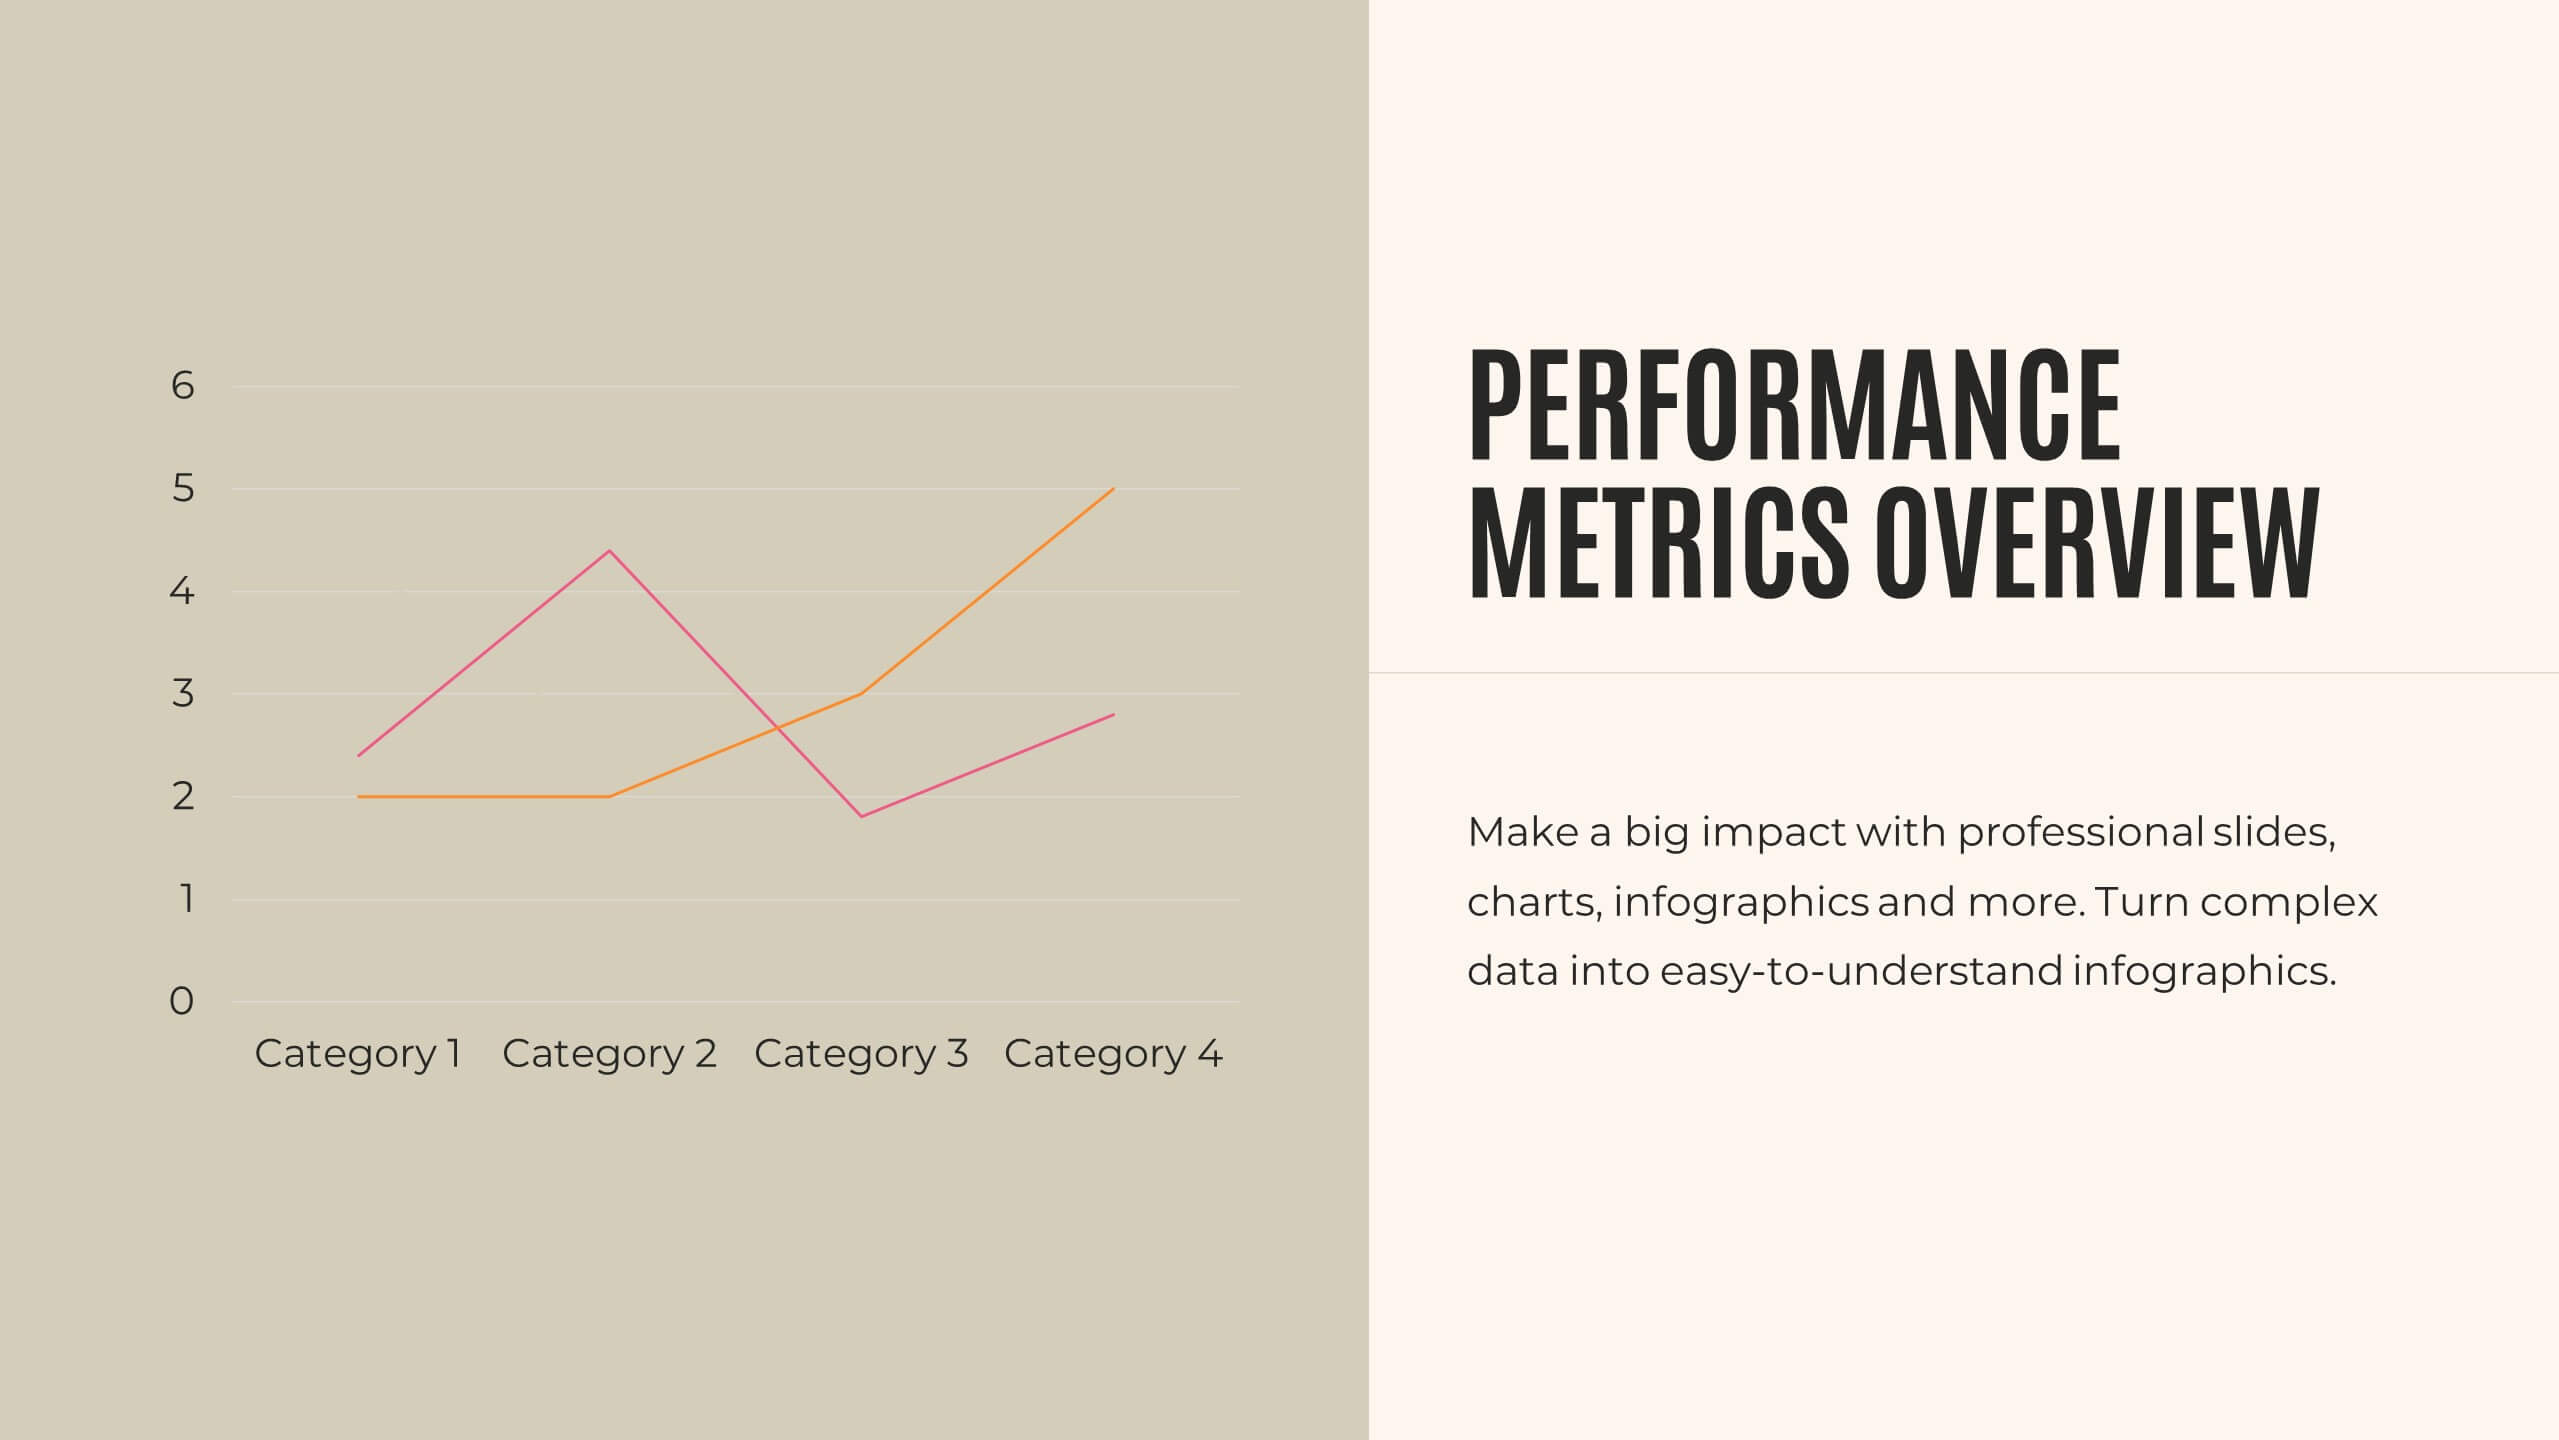
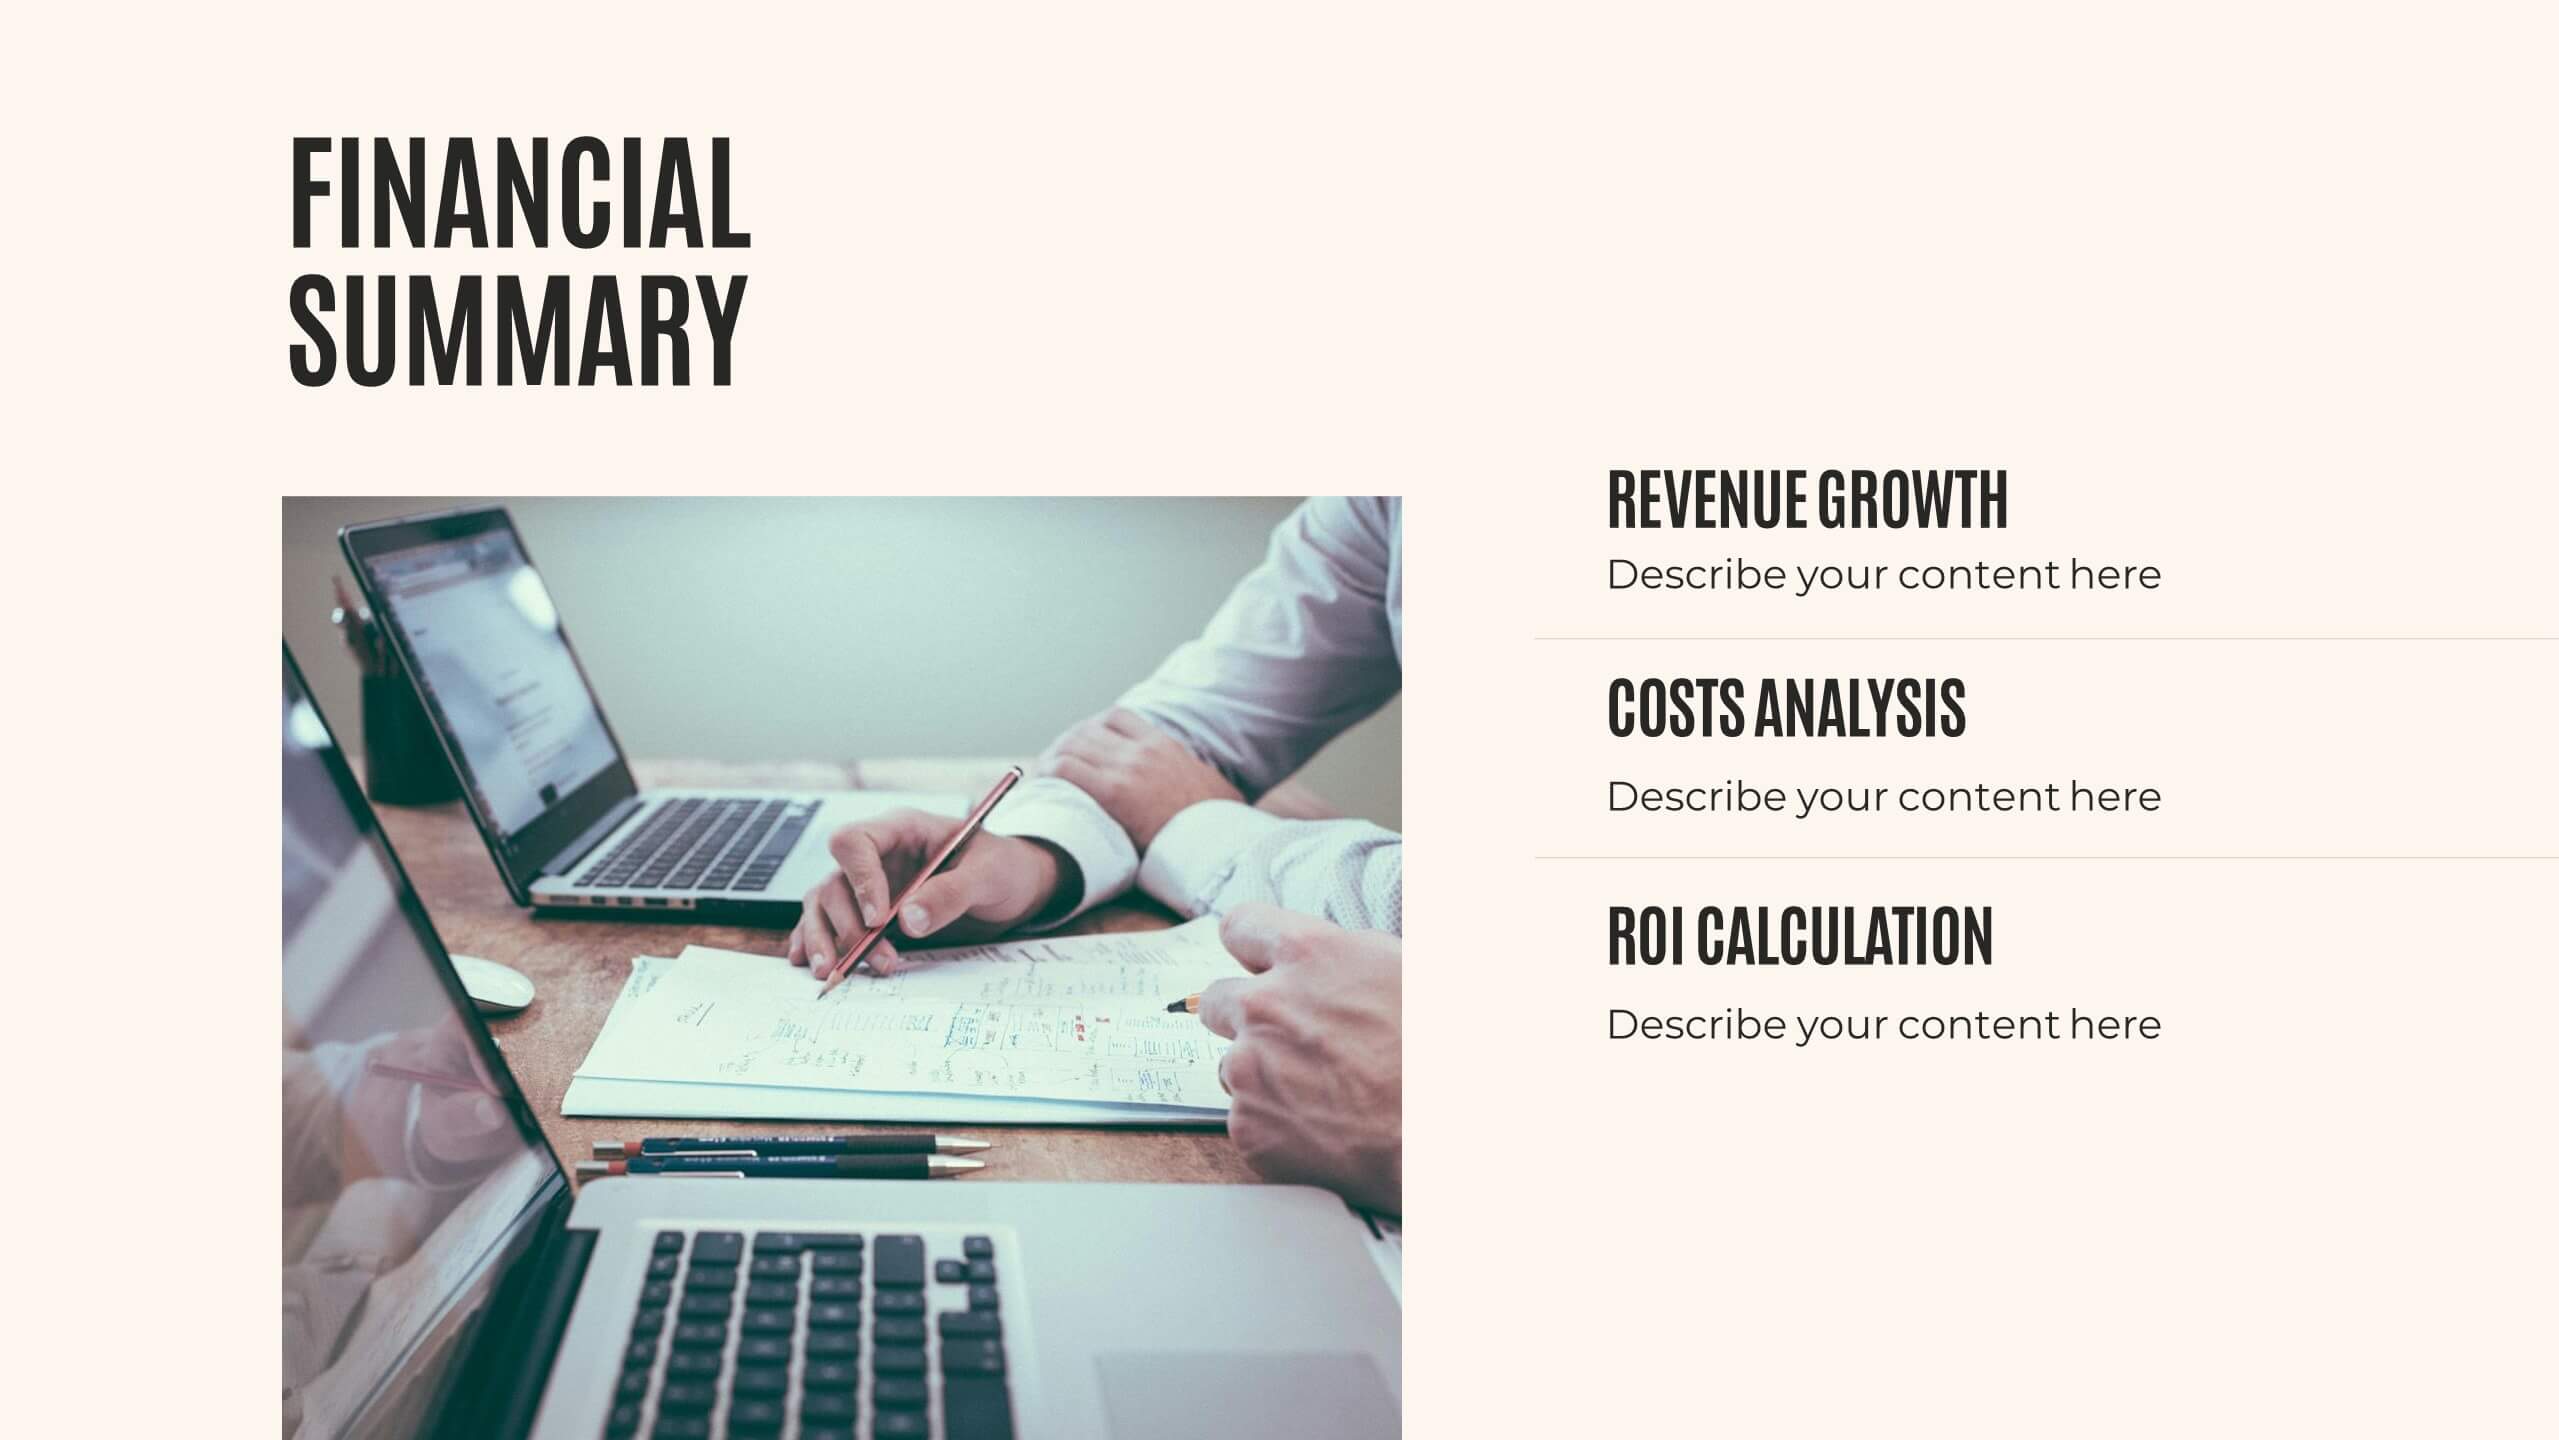
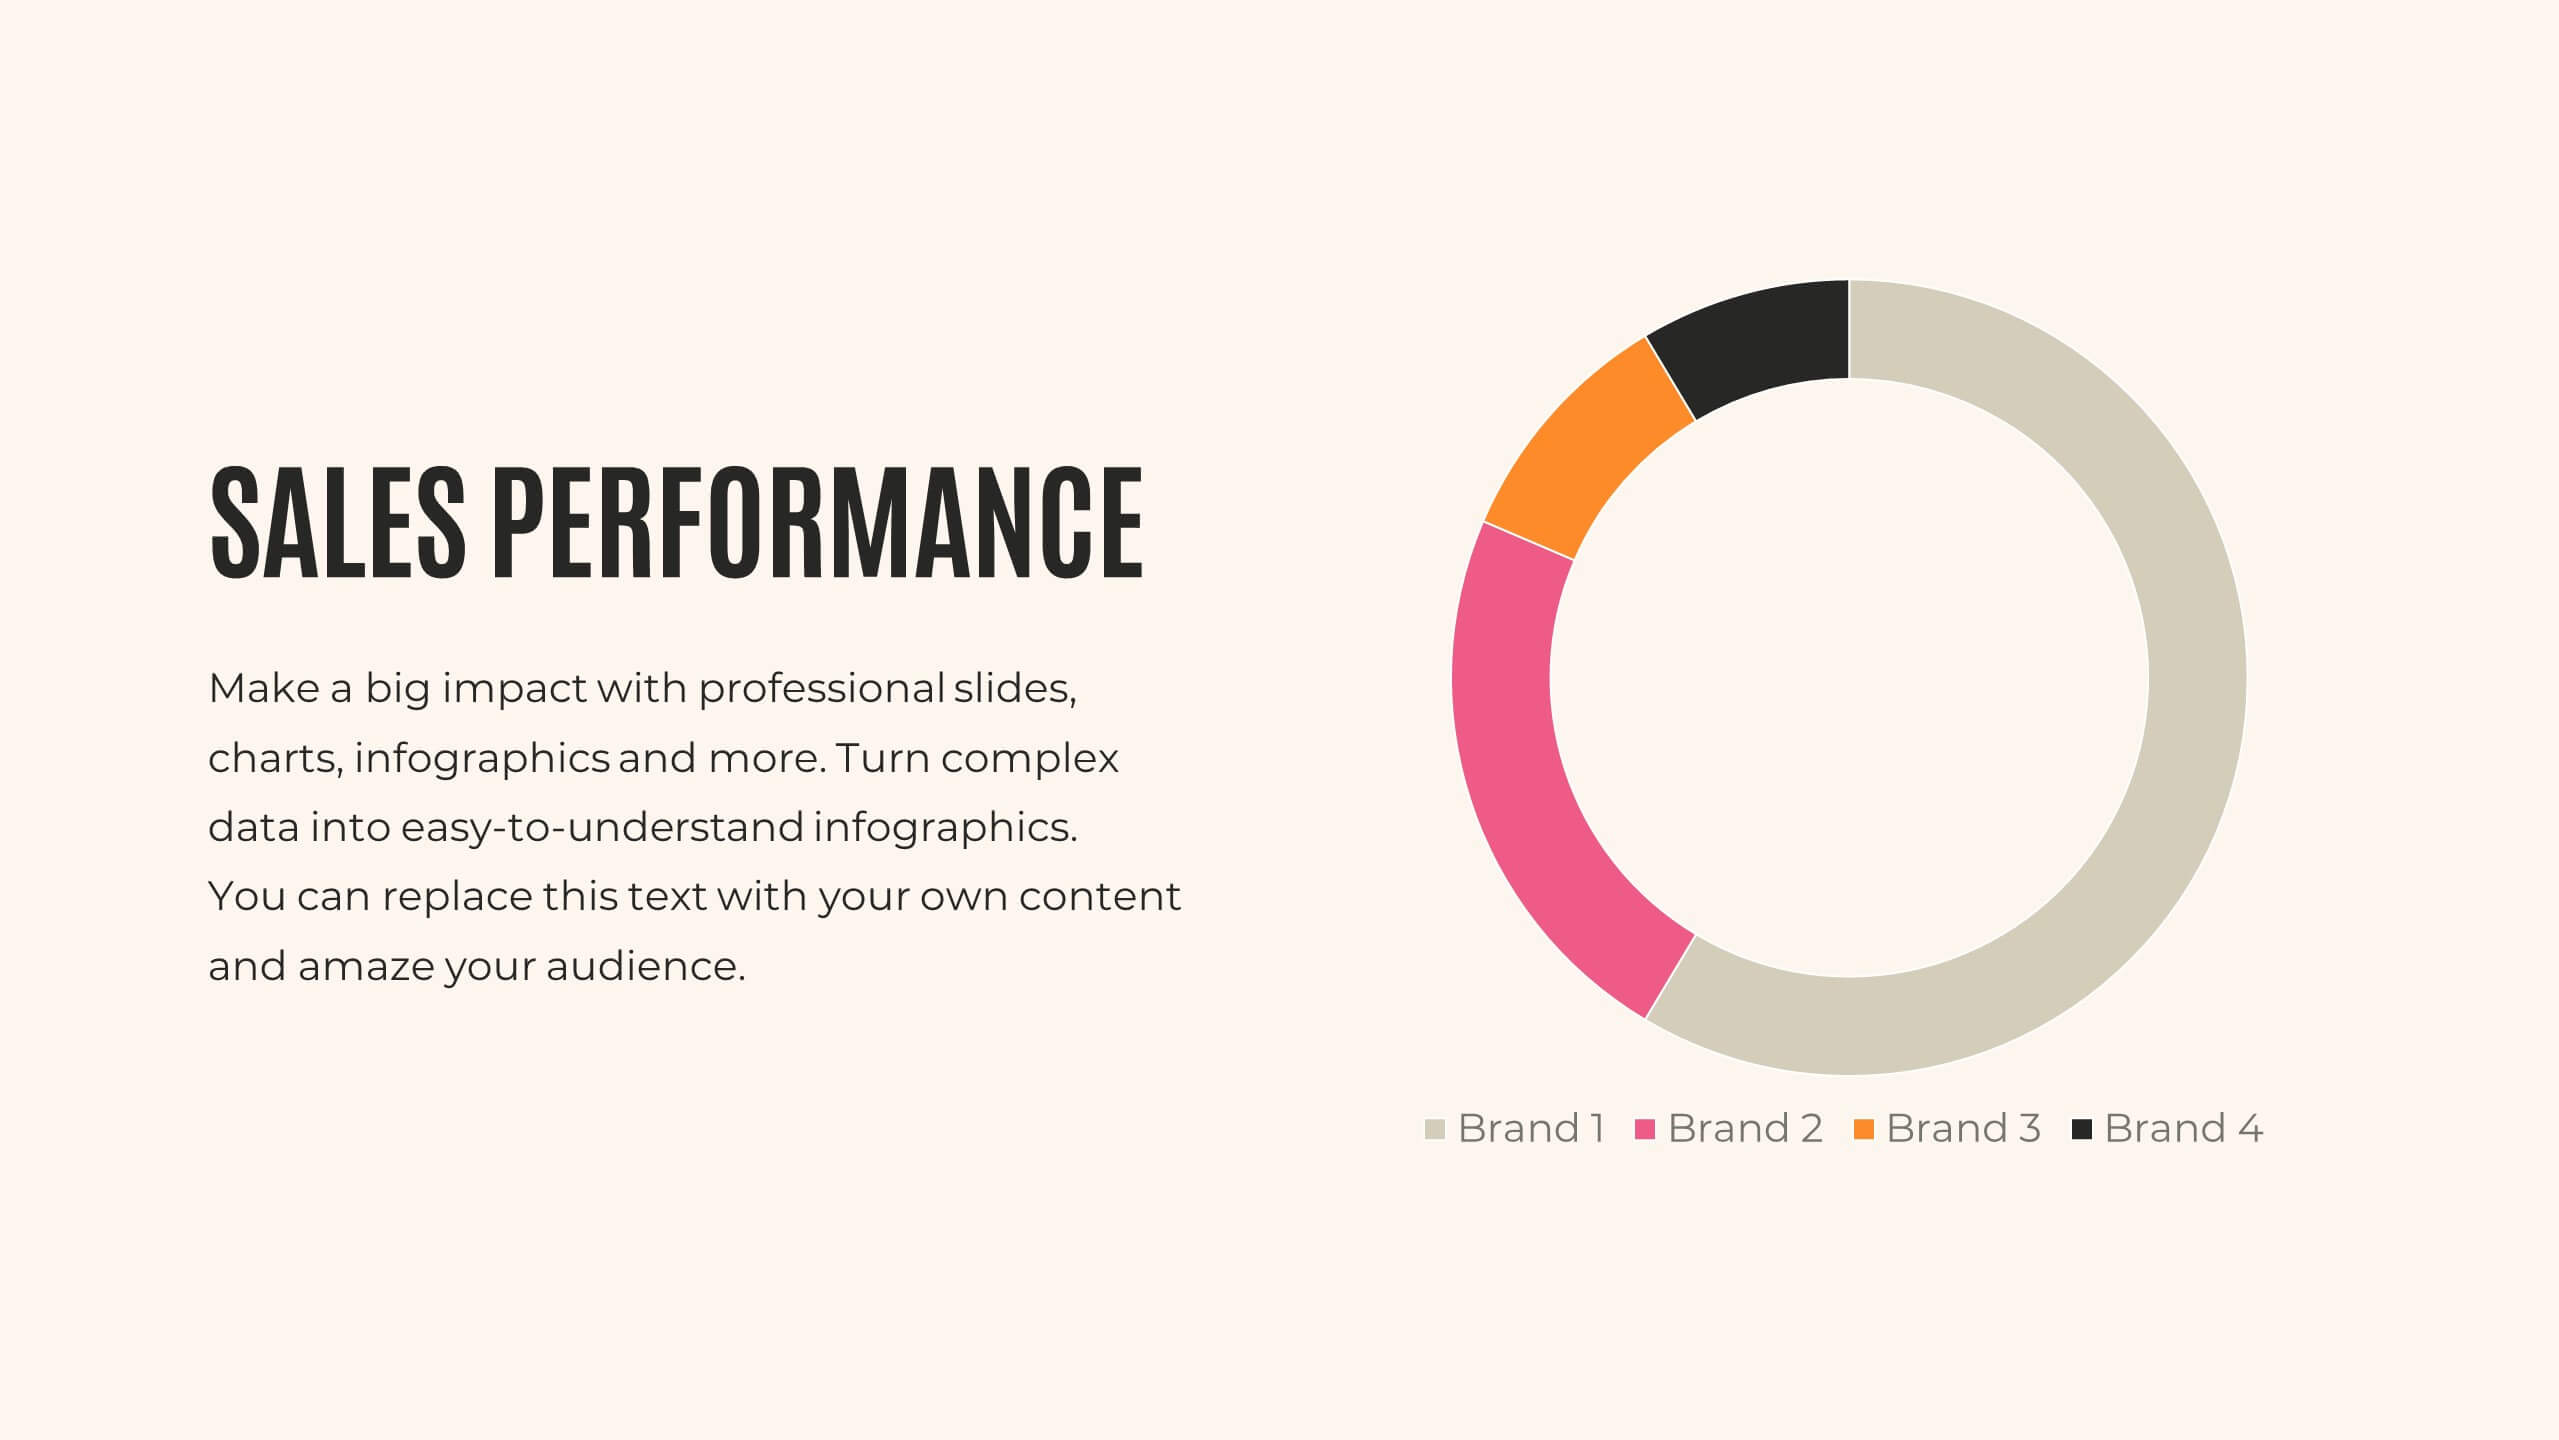
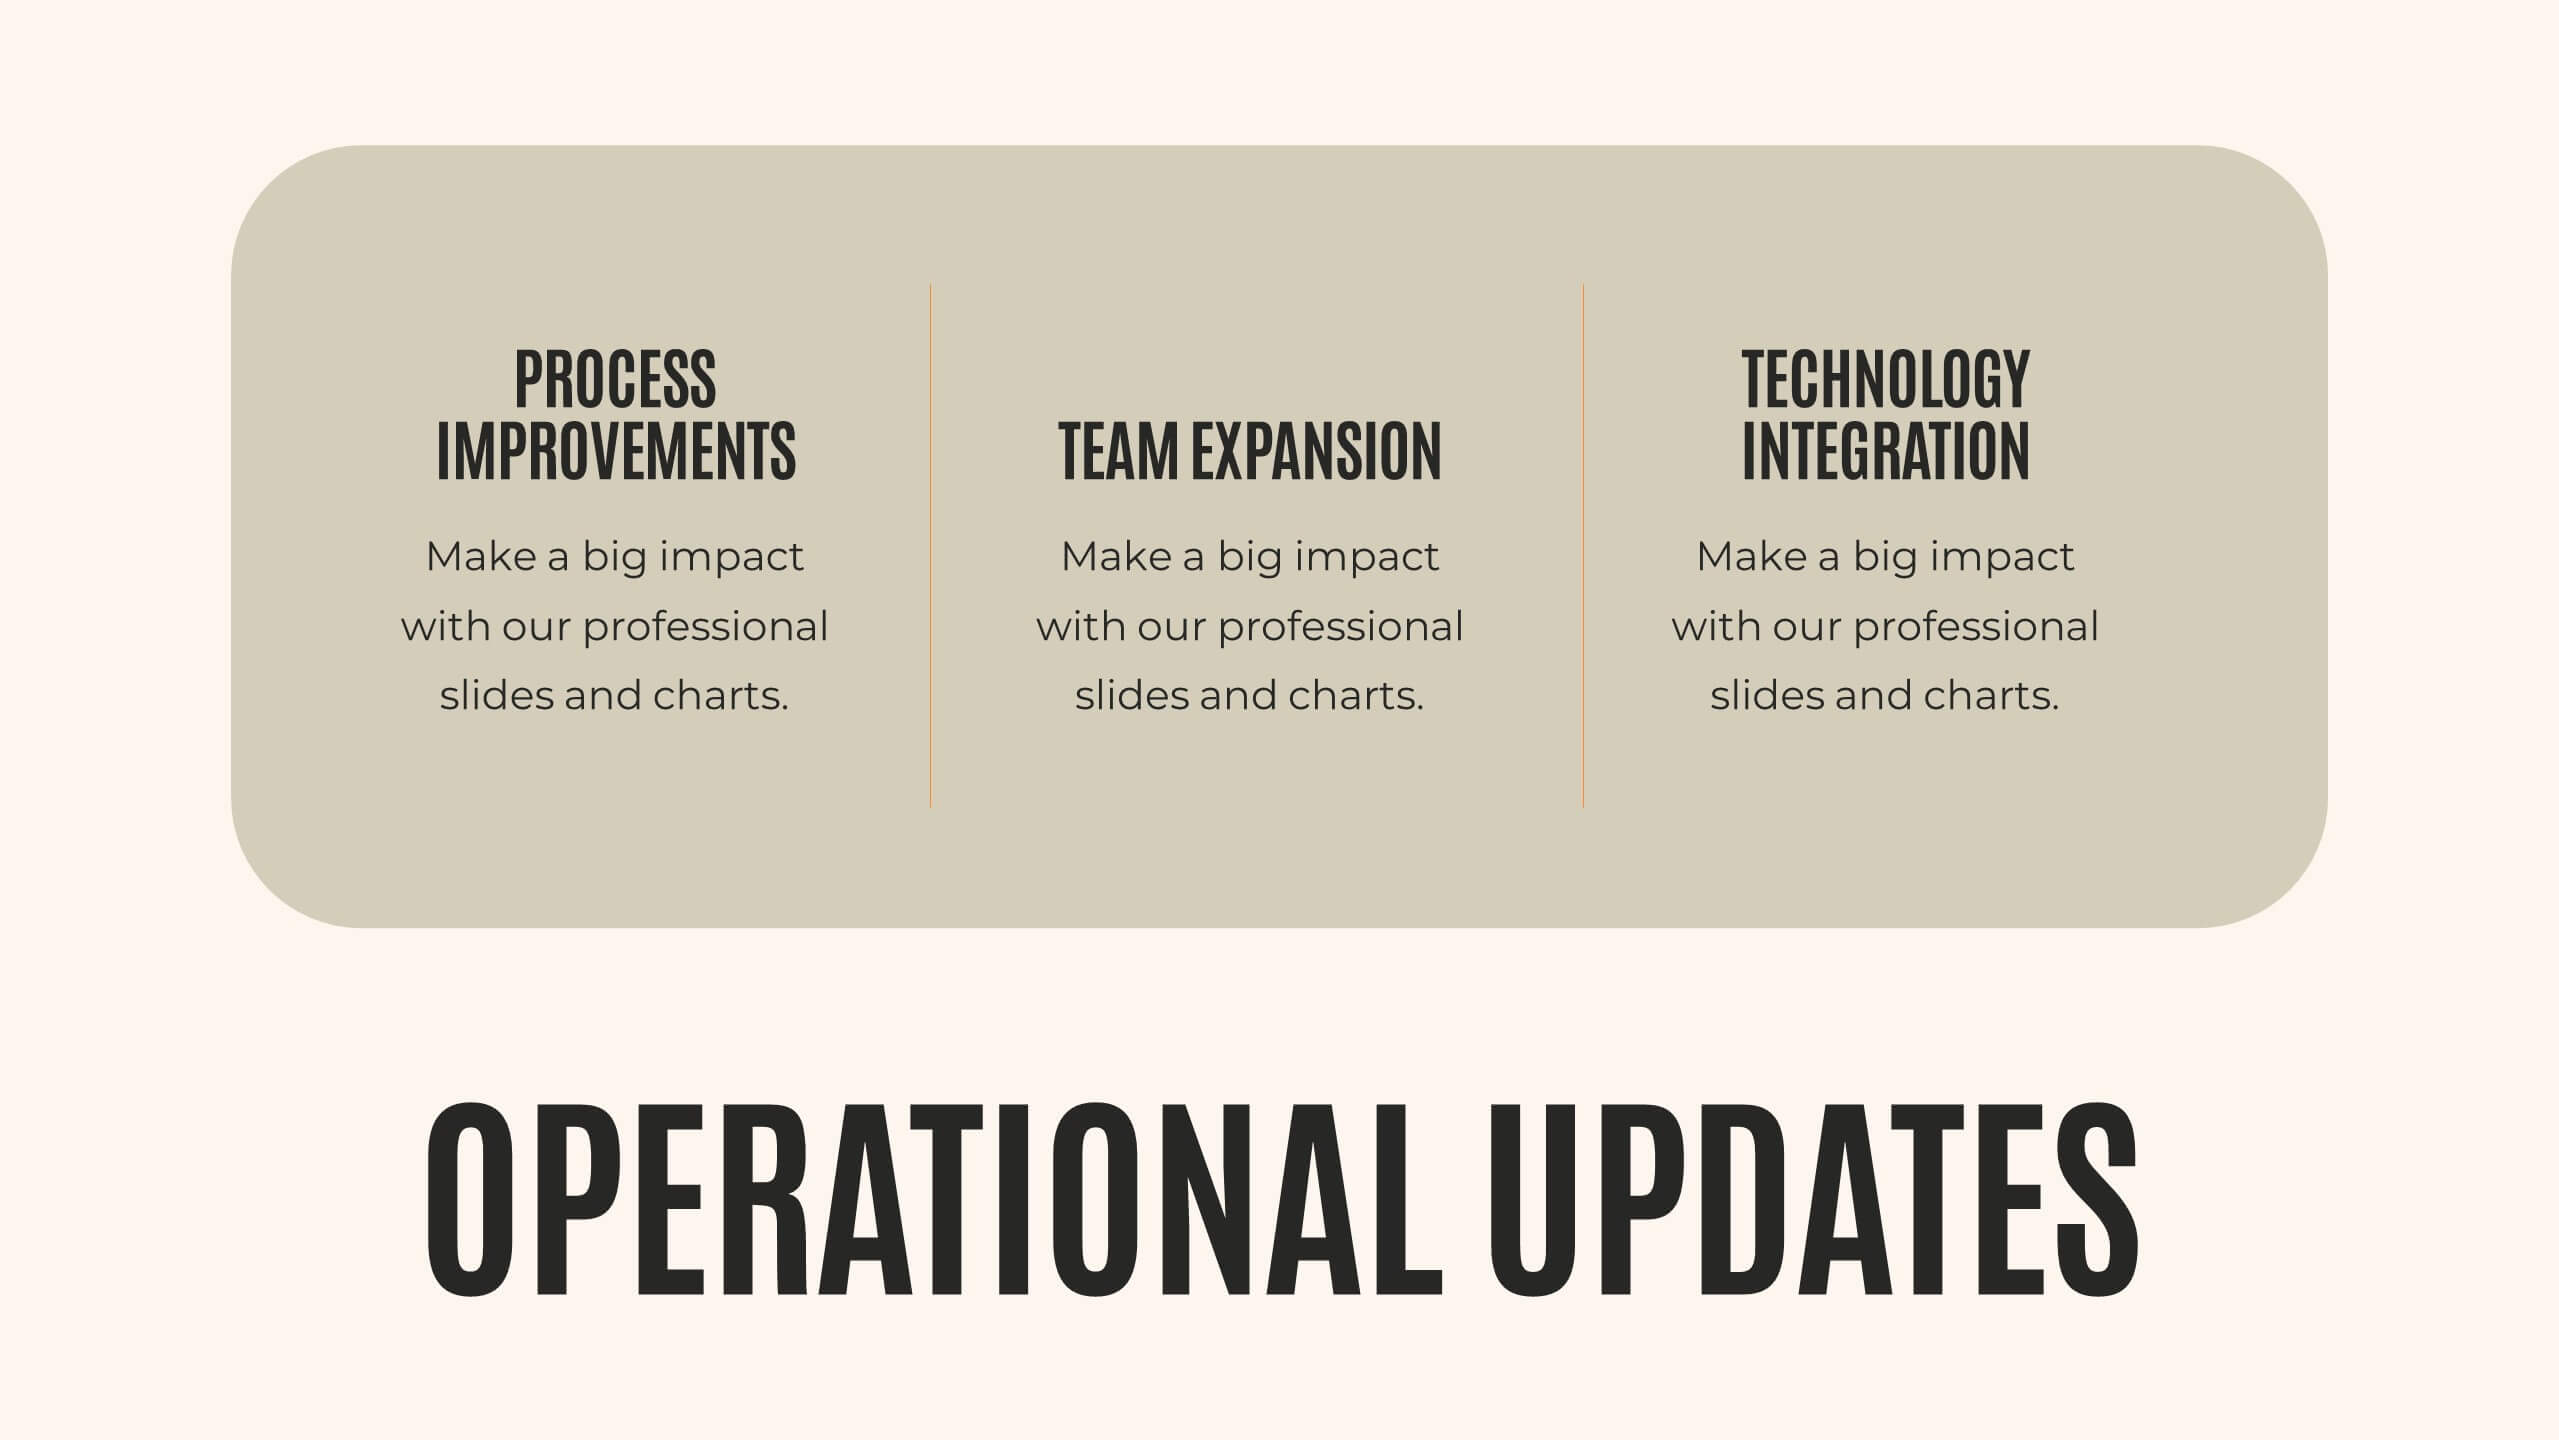
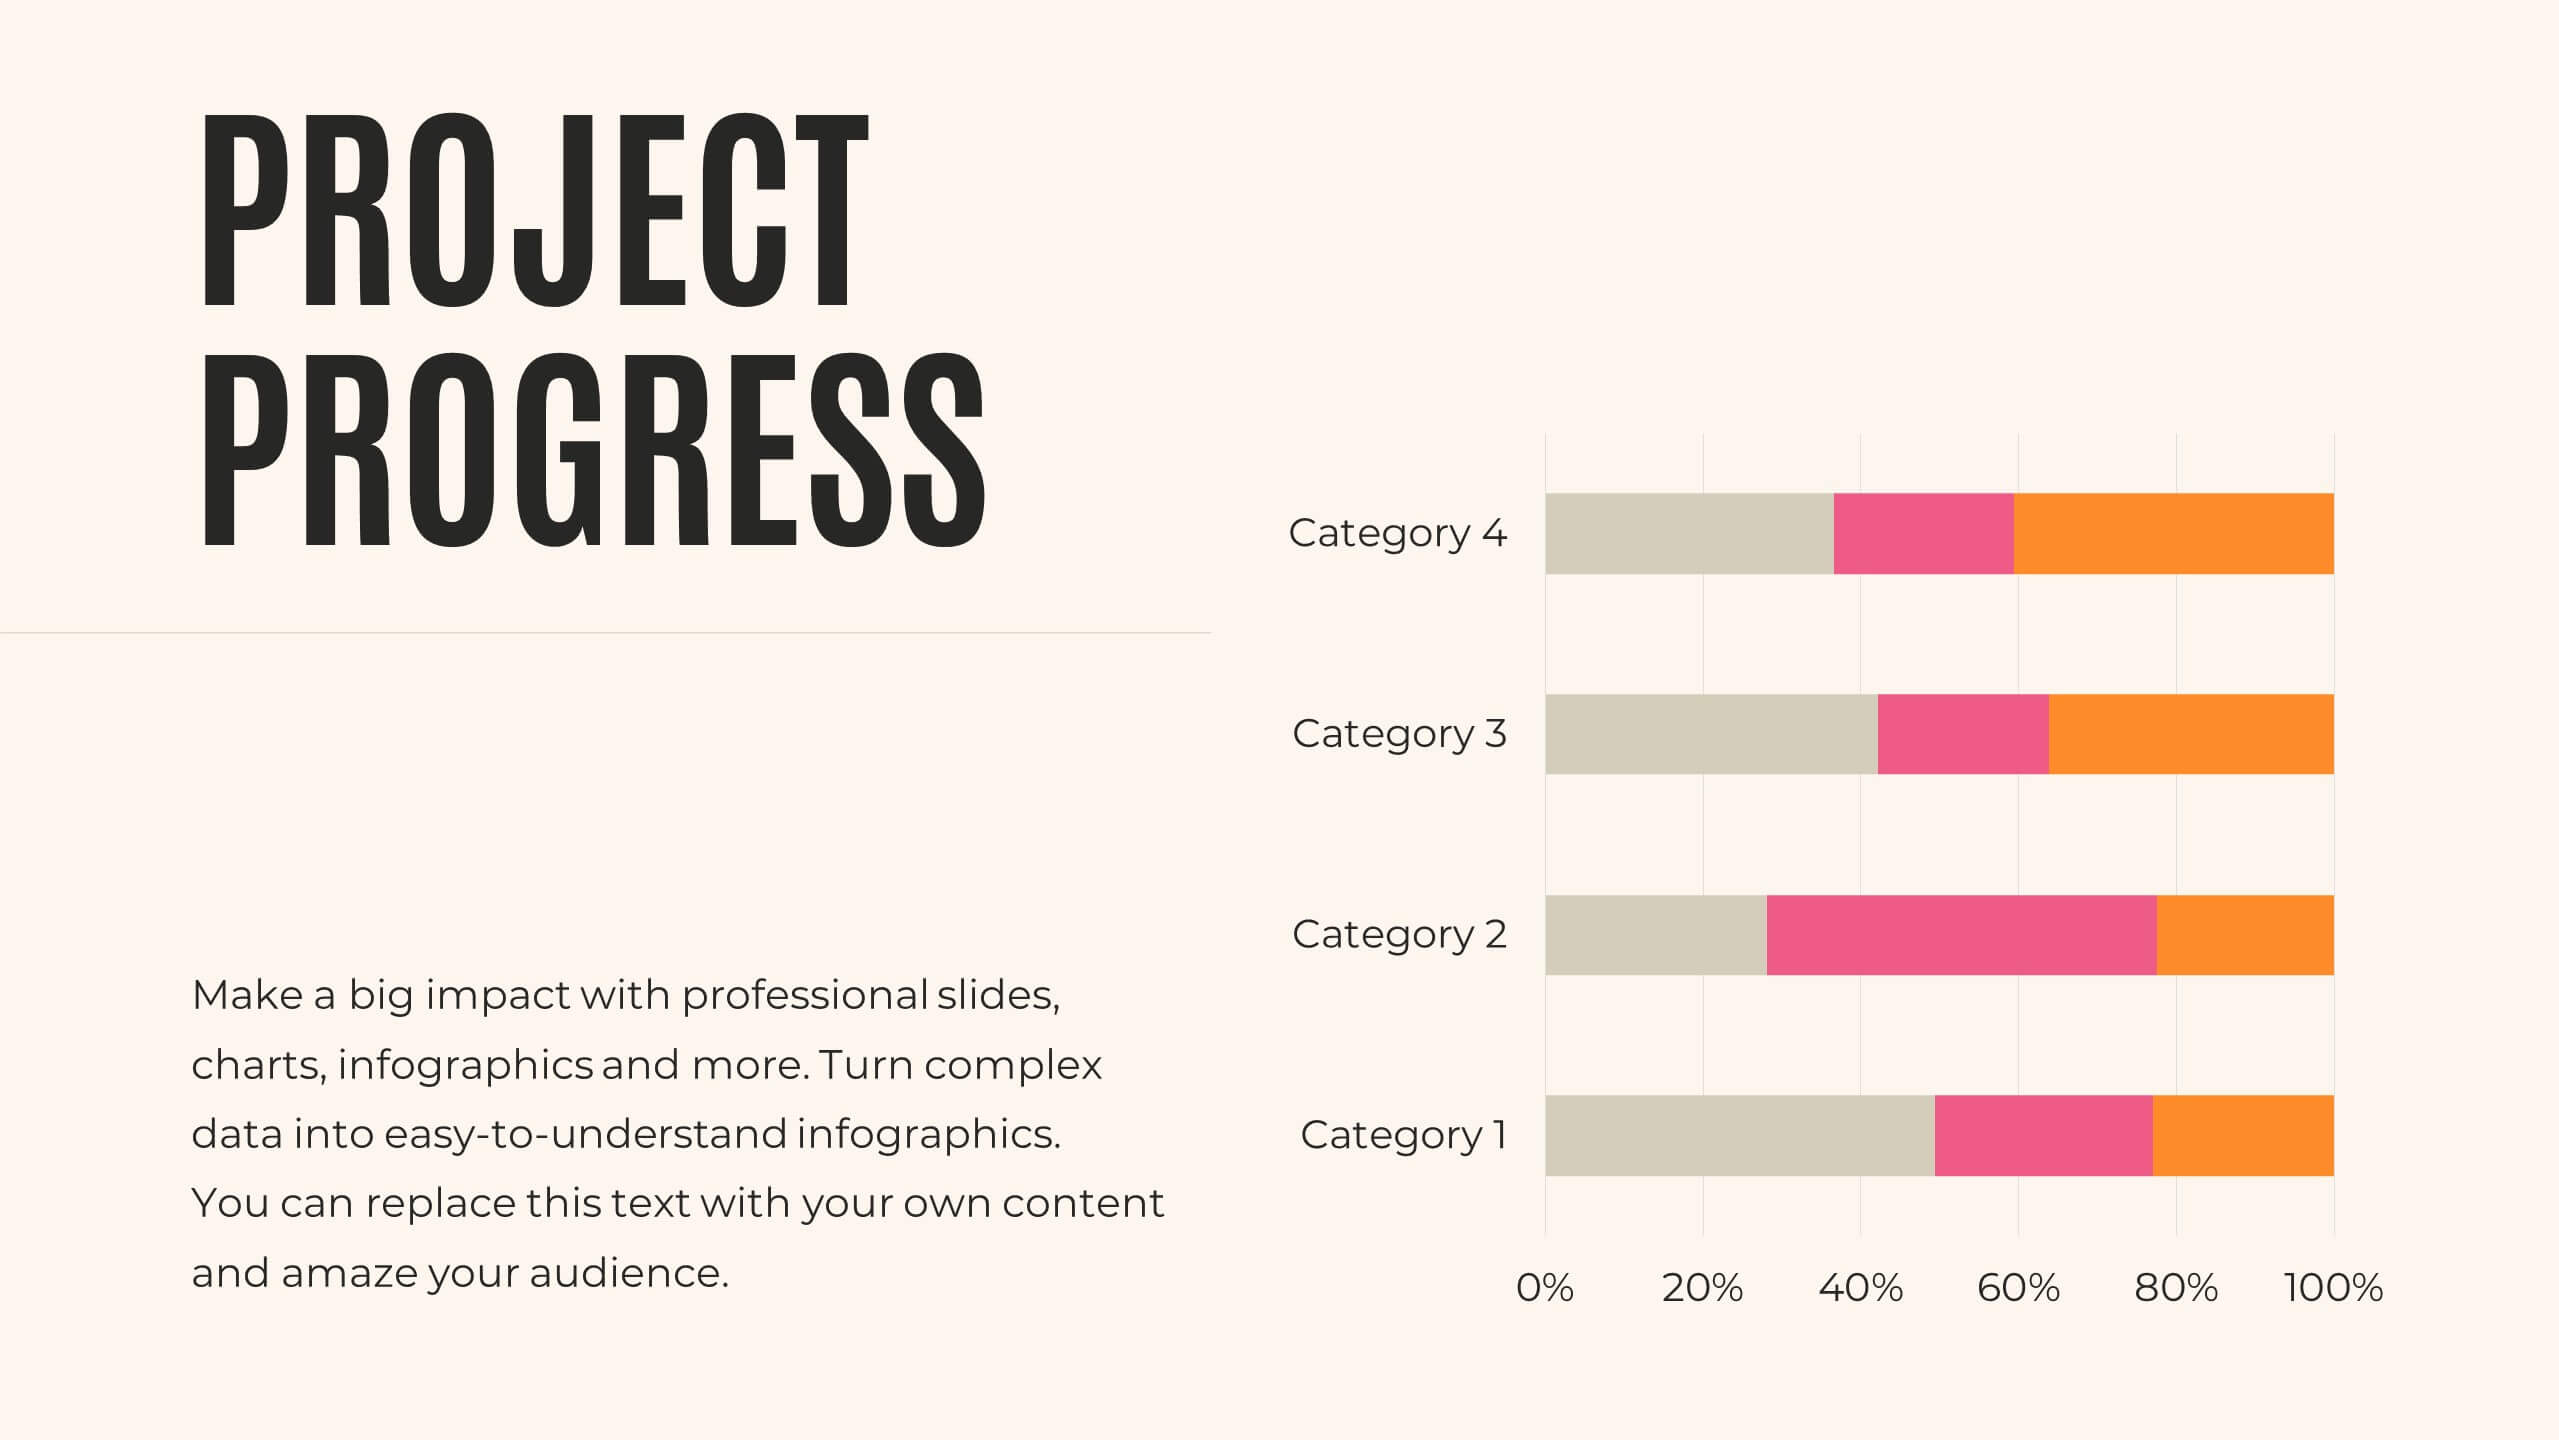
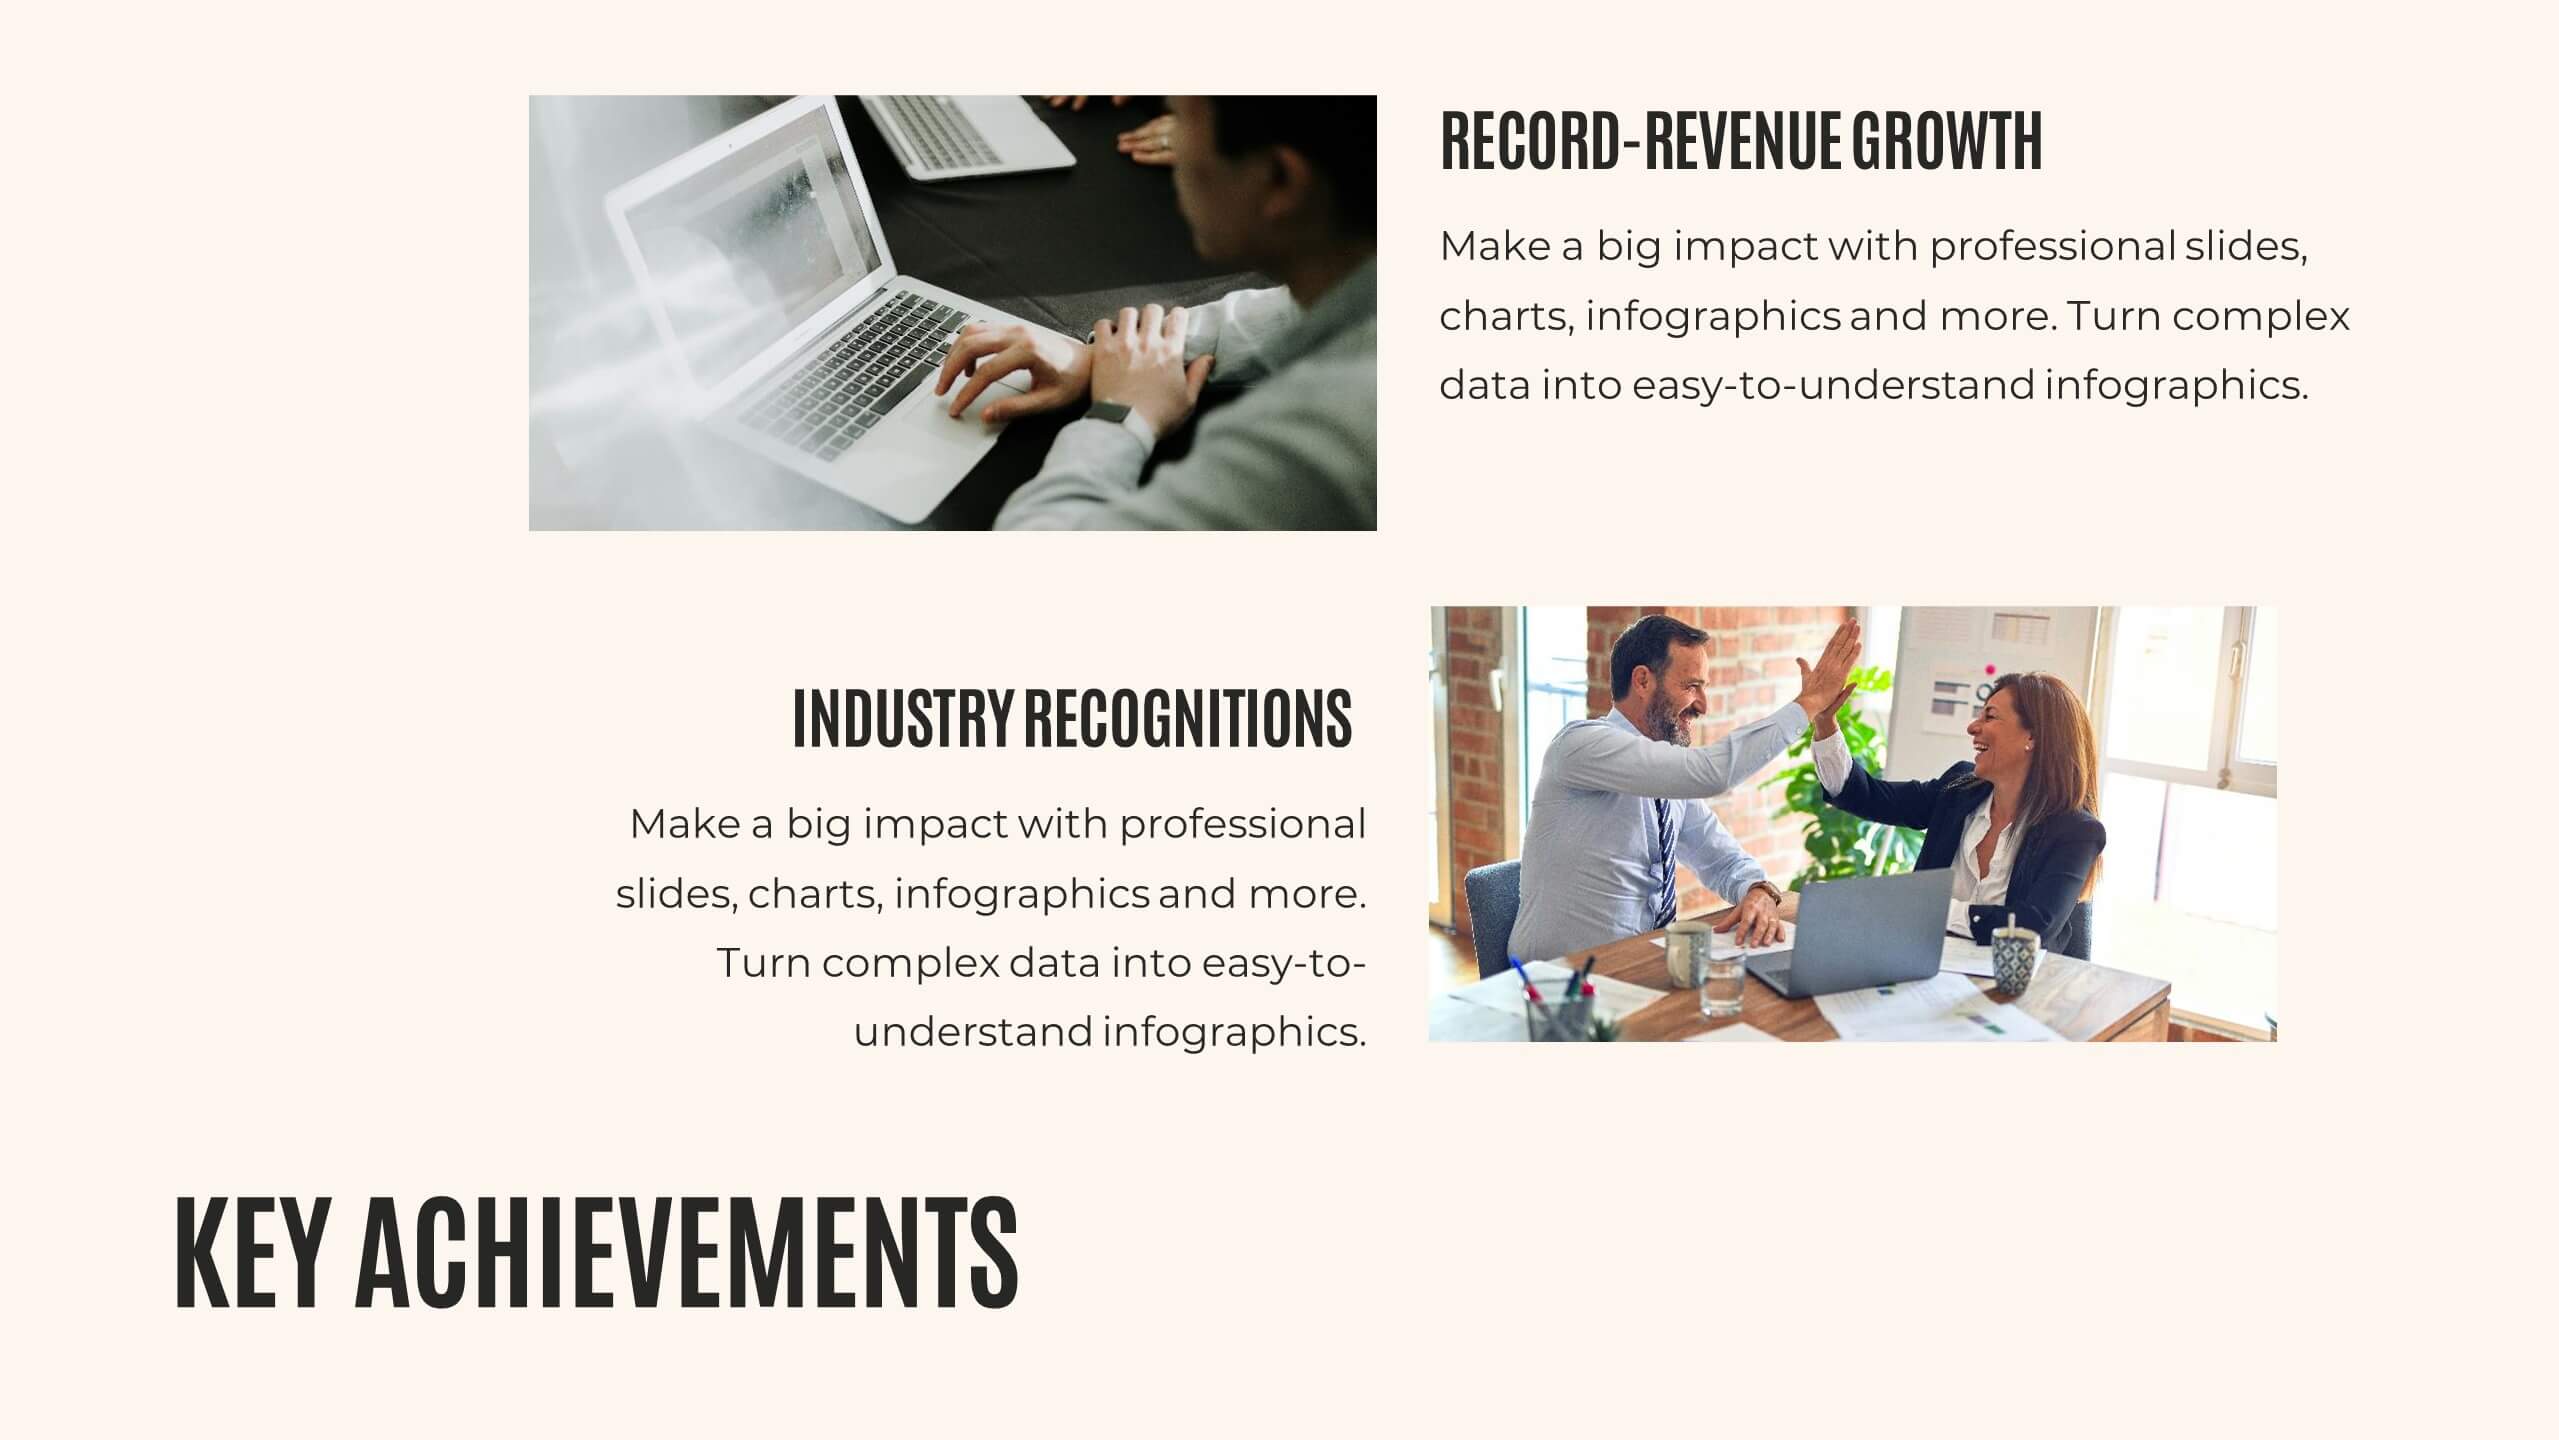
Present your annual report with clarity and impact! This template covers agenda, key highlights, financial summary, sales performance, and project progress. Ideal for detailing achievements, insights, and future priorities. Compatible with PowerPoint, Keynote, and Google Slides, it ensures your data is visually compelling and easy to understand. Showcase your success effortlessly!


5 slides
Types of Vaccine Infographics
Vaccines are biological substances that stimulate the body's immune system to develop immunity against specific diseases. These vertical infographics provide essential information about different types of vaccines. This infographic serves as a valuable educational resource to raise awareness about vaccines and their role in preventing infectious diseases. The infographic is organized into clear sections, each representing a category of vaccines. Each vaccine category is accompanied by illustrations or icons that represent the type of vaccine being discussed. Compatible with Powerpoint, Keynote, and Google Slides.


4 slides
Performance Metrics Dashboard Visual
Track performance at a glance with the Performance Metrics Dashboard Visual Presentation. This clean and professional slide layout features a combination of line charts and circular progress visuals to help showcase trends, percentages, and progress toward goals. Ideal for business updates, KPI reviews, and operational reports. Fully editable in PowerPoint, Keynote, and Google Slides for seamless customization.


3 slides
Spider Diagram for Concept Mapping Presentation
Visualize complex data relationships with clarity using the Spider Diagram for Concept Mapping Presentation. This template is perfect for comparing multiple variables across categories, making it ideal for performance reviews, strategic analysis, and brainstorming sessions. Fully editable and compatible with PowerPoint, Keynote, and Google Slides.


5 slides
Online Education Training Presentation
Present your digital learning programs with this Online Education Training Presentation. The visual layout highlights a central computer screen connected to key e-learning components, making it perfect for explaining course structures, virtual classroom tools, or distance learning workflows. Designed for trainers, educators, or edtech professionals. Fully editable in PowerPoint, Keynote, and Google Slides.


6 slides
Business Structure Outline Presentation
Visualize your company’s framework with this modern business structure slide. Perfect for showcasing team roles, departments, or organizational functions, it helps simplify complex relationships into a clear overview. Easily editable in Canva, PowerPoint, and Google Slides—ideal for presentations, planning sessions, or onboarding new employees with a professional, easy-to-follow design.