


Features
- 5 Unique slides
- Fully editable and easy to edit in Microsoft Powerpoint, Keynote and Google Slides
- 16:9 widescreen layout
- Clean and professional designs
- Export to JPG, PDF or send by email


Do you have any questions?
Recommend


8 slides
Professional Title Slide Presentation
Start your presentation with impact using a bold, modern cover design that captures attention instantly. Perfect for introducing reports, creative projects, or business pitches, this layout combines professional typography with clean visuals for a polished first impression. Fully editable in PowerPoint, Keynote, and Google Slides for seamless customization.


4 slides
Ishikawa Diagram for Process Review Presentation
Visualize cause-and-effect relationships with the Ishikawa Diagram for Process Review Presentation. Also known as a fishbone diagram, this template is perfect for identifying potential root causes during quality control or team brainstorming sessions. Easily editable in Canva, PowerPoint, and Google Slides to match your workflow and style.


7 slides
Target Market Infographic Presentation Template
A target market Infographic is a visual representation of a specific group of consumers that a business has determined to be the focus of its marketing efforts. This infographic is designed to understand the demographics, behaviors, and motivations of the potential consumers. This infographic can be used to show the size and growth potential of the target market, and how it compares to other market segments. This template is designed to display your information in the form of charts, graphs, or other data visualizations, and is accompanied by written descriptions of your data and insights.


26 slides
Denice Presentation Template
Denice is a creative template with a bold and professional look. This template has a chic, modern aesthetic that grabs attention and makes an impact on your audience. The colors are soft nudes which help keep the look clean and easy to read. The soft nudes are sure to catch your readers' attention without being overwhelming. The graphs, timelines and charts make this template perfect for promotional campaigns. In addition to its professional look, Denice also comes loaded with features and tools to help you reach your audience. Save time and effort by choosing the Denice template.


5 slides
Business SWOT Infographics
Dive deep into organizational analysis with our business SWOT infographics. Crafted in engaging shades of blue and pink, this collection is an essential tool for businesses aiming to uncover their strengths, weaknesses, and threats. This template, brimming with creative graphics and icons, is specifically designed for business strategists, educational instructors, and company executives who are keen to present SWOT analysis with clarity. Compatible with Powerpoint, keynote, and Google Slides. Its vertical, creative styling makes complex information digestible, fostering understanding and strategic thinking in your business planning sessions.


6 slides
Spider Diagram for Concept Mapping
Map complex relationships with ease using the Spider Diagram for Concept Mapping Presentation. This slide features a central radial chart connected to six surrounding nodes—each paired with editable titles, icons, and detailed text sections. Perfect for visualizing project scopes, idea clustering, strategic alignment, or team functions. Customize colors, icons, and text directly in PowerPoint, Keynote, or Google Slides. The clean, professional layout ensures clear communication across all types of presentations.


4 slides
Effective Leadership Tips Presentation
Lead with clarity and confidence using this clean, modern presentation design. Perfect for sharing management insights, motivational principles, and communication strategies, it helps visualize ideas that inspire stronger teams and better decision-making. Fully editable and compatible with PowerPoint, Keynote, and Google Slides for effortless professional customization.


6 slides
Cyber Security Jobs Infographics
The "Cyber Security Jobs" infographic template, designed for PowerPoint, Keynote, and Google Slides, is a vital tool for career counselors, educational institutions, and cyber security professionals. This modern and informative template is specifically crafted to highlight career opportunities and pathways in the field of cyber security. Featuring key elements such as various job roles in cyber security, skill requirements, and career growth opportunities, the template is structured to provide a comprehensive overview of the industry. Its layout is ideal for presenting the diverse range of careers available in cyber security, making it an invaluable resource for career guidance and professional development presentations. The design is tech-themed with a color scheme that includes shades of blue, black, and gray. This not only gives the template a professional and engaging look but also reflects the technological and security aspects of the field. Whether it's used in job fairs, educational seminars, or corporate training sessions, this template ensures that information about cyber security jobs is presented clearly, effectively, and attractively.


4 slides
Customer Market Segmentation Analysis Presentation
Understand your audience with clear and effective segmentation analysis. This Customer Market Segmentation Analysis template provides a professional visual representation of audience groups, helping businesses target the right demographics. Ideal for marketers, business strategists, and sales teams. Fully editable and compatible with PowerPoint, Keynote, and Google Slides for seamless customization.


6 slides
Territorial Analysis of US Regions Presentation
Present clear regional insights with this Territorial Analysis of US Regions template. Ideal for market segmentation, sales reporting, or demographic studies. Each region is color-coded for quick comparison and fully editable to match your data. Compatible with PowerPoint, Keynote, and Google Slides—perfect for marketers, strategists, or analysts.


10 slides
Startup Pitch Deck Presentation
Make your big idea impossible to ignore with a sleek, investor-ready design that tells your startup’s story with clarity and confidence. This presentation helps you outline your vision, market potential, and business strategy in a compelling way. Fully compatible with PowerPoint, Keynote, and Google Slides for effortless customization.


6 slides
Business Case Study and ROI Breakdown Presentation
Communicate your business impact clearly with the Business Case Study and ROI Breakdown Presentation. Featuring layered building-block visuals, this template is ideal for illustrating return on investment, strategic value, or project outcomes. Perfect for executive briefings and stakeholder presentations. Fully editable in PowerPoint, Keynote, and Google Slides.


20 slides
Astralisque Sales Proposal Presentation
This Sales Proposal Presentation is designed to help businesses outline their sales strategies with a bold and dynamic style. Covering key elements such as competitive analysis, objectives, pricing strategy, and sales performance metrics, it ensures a professional look. Fully customizable and compatible with PowerPoint, Keynote, and Google Slides.


6 slides
Fishbone Diagram
A fishbone diagram, also known as a cause-and-effect diagram or an Ishikawa diagram, is a visual tool used to identify and analyze the potential causes of a problem or an effect. This infographic template is designed to help you explore and understand the root causes of an issue by visually mapping out various contributing factors. This cause-and-effect diagram, provides a structured approach to identify and categorize the various factors contributing to a specific outcome. This template is fully customizable and compatible with Powerpoint, Keynote, and Google Slides making it easy to input your information.


7 slides
Mind Map Infographic Presentation Template
A mind map is a diagram that allows you to visualize how related ideas and concepts are connected to one another. It is especially good for brainstorming, planning and organizing. A mind map allows you to organize information in a way that shows your thinking process and gives you the opportunity for deeper understanding. This template will help others understand how you think about a particular subject or topic. Use this template to "brainstorm" a topic, and create an interesting mind map. You can also use it to share your ideas with others, or to visually organize your thoughts.


22 slides
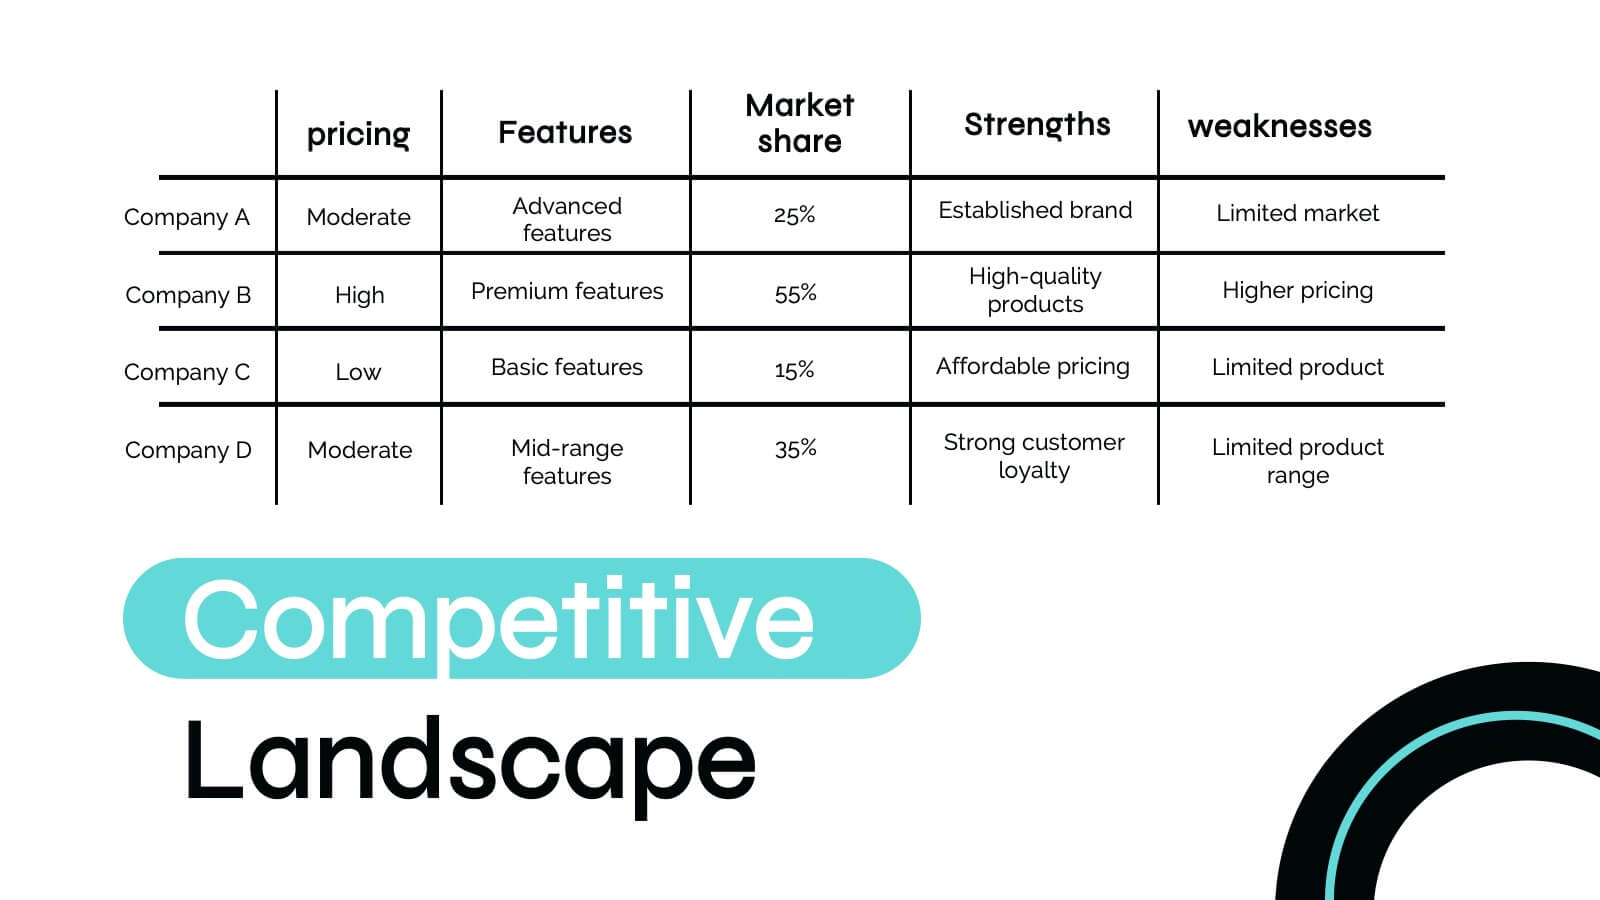
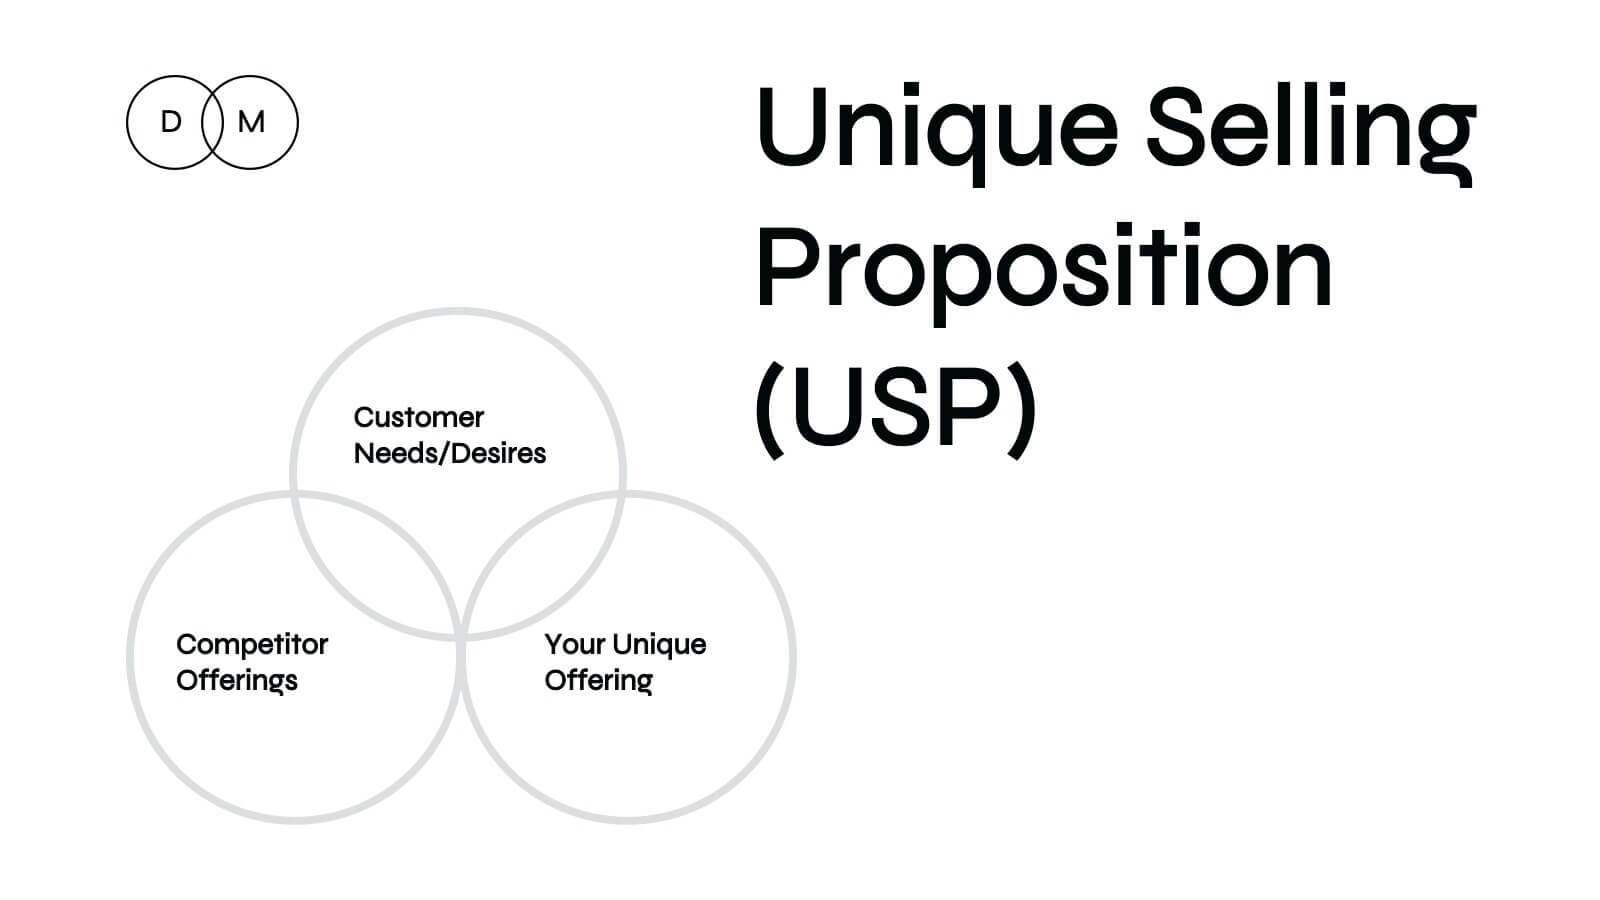
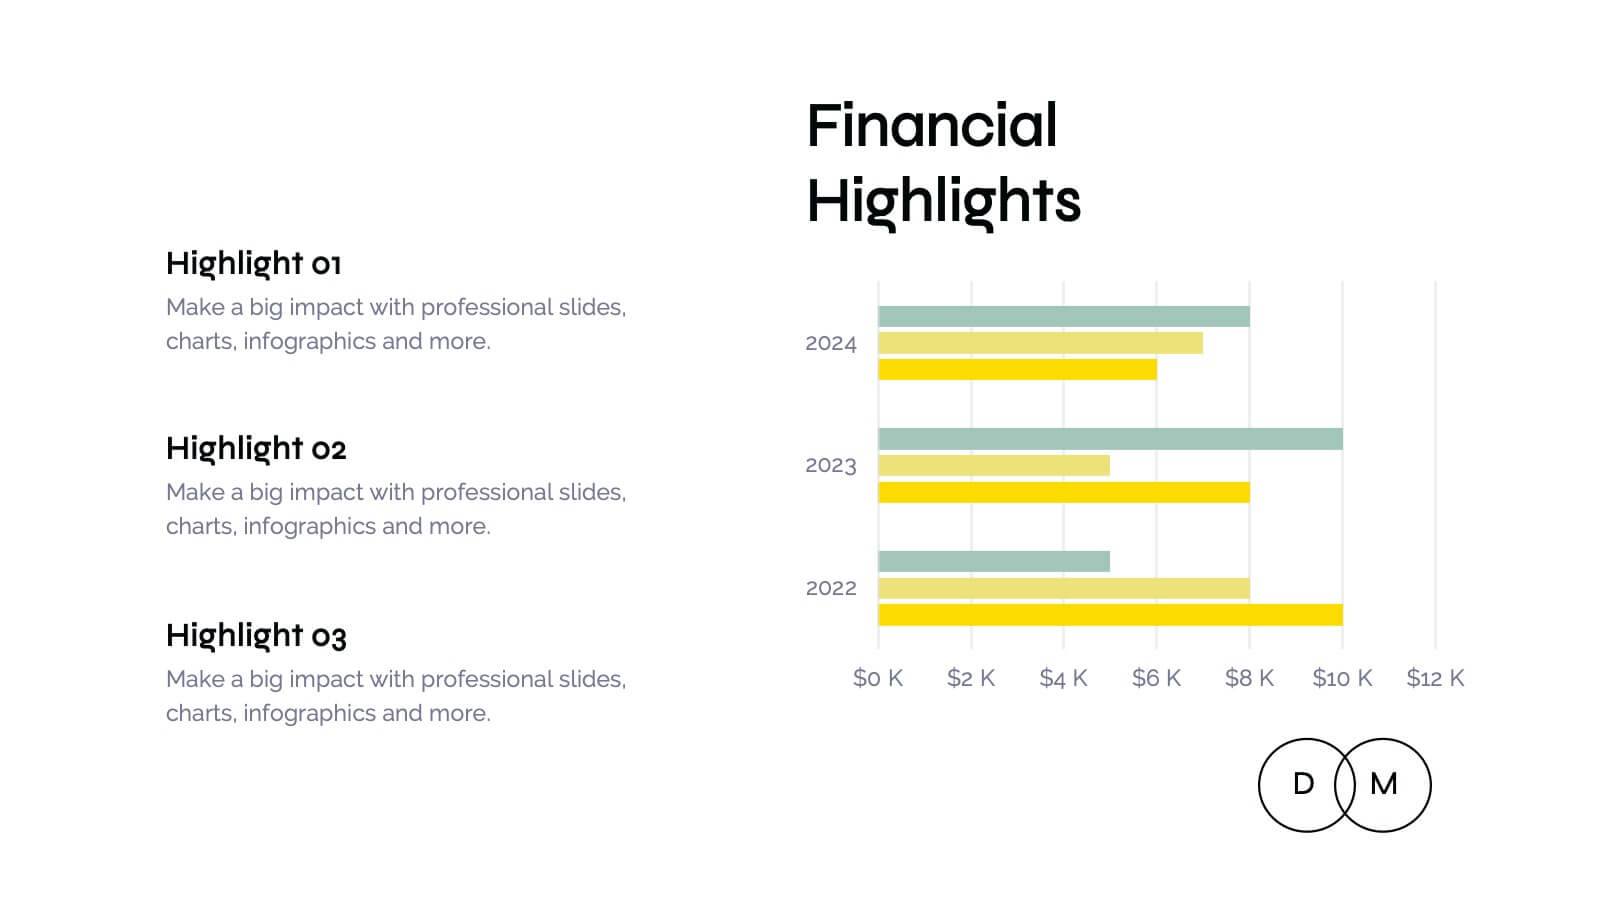
Hercules Digital Marketing Strategy Plan Presentation
Ignite your next marketing presentation with this bold, dynamic template that showcases every key element of your marketing strategy! From company history and target audience insights to competitive landscape analysis, this design makes presenting your marketing message a breeze. Perfect for professionals, it’s fully compatible with PowerPoint, Keynote, and Google Slides for seamless usage across platforms.


8 slides
Annual Highlights and Key Achievements Presentation
Showcase your biggest wins with this award-themed highlights slide. Featuring colorful trophy icons, it’s perfect for summarizing yearly accomplishments or milestones. Each section is clearly labeled to spotlight key points. Fully editable and compatible with PowerPoint, Keynote, and Google Slides—ideal for business recaps, team recognition, or performance reviews.