


Features
- 26 Unique slides
- Fully editable and easy to edit in Microsoft Powerpoint, Keynote and Google Slides
- 16:9 widescreen layout
- Clean and professional designs
- Export to JPG, PDF or send by email.


Do you have any questions?
Recommend


21 slides
Sol Photography Portfolio Template Presentation
Showcase your creative work with this vibrant photography portfolio presentation template. It features sections for introductions, project descriptions, and accolades, making it perfect for photographers looking to display their style and collaborations. Compatible with PowerPoint, Google Slides, and Keynote, this template is designed to impress viewers with its dynamic layout and bright color scheme.


4 slides
Strategic Takeaways and Final Points Presentation
Summarize key insights and final thoughts with this clean, icon-based layout. Ideal for wrapping up business reviews, strategy decks, or executive briefings, each section includes room for concise summaries and visuals. Easily customizable in PowerPoint, Keynote, and Google Slides to match your brand and presentation goals.
22 slides
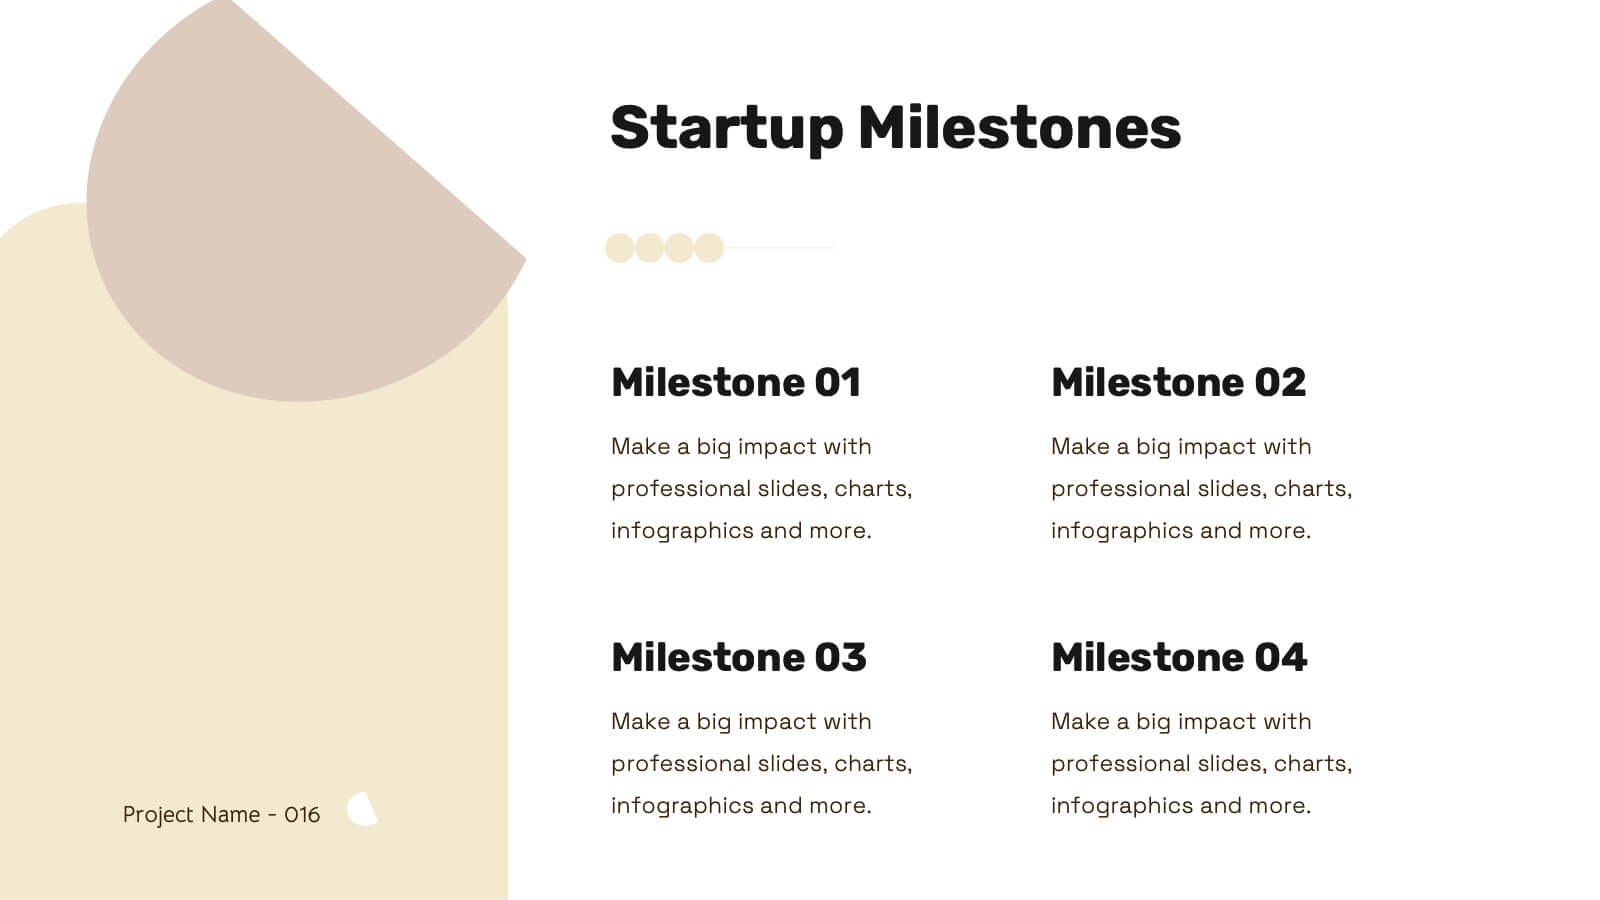
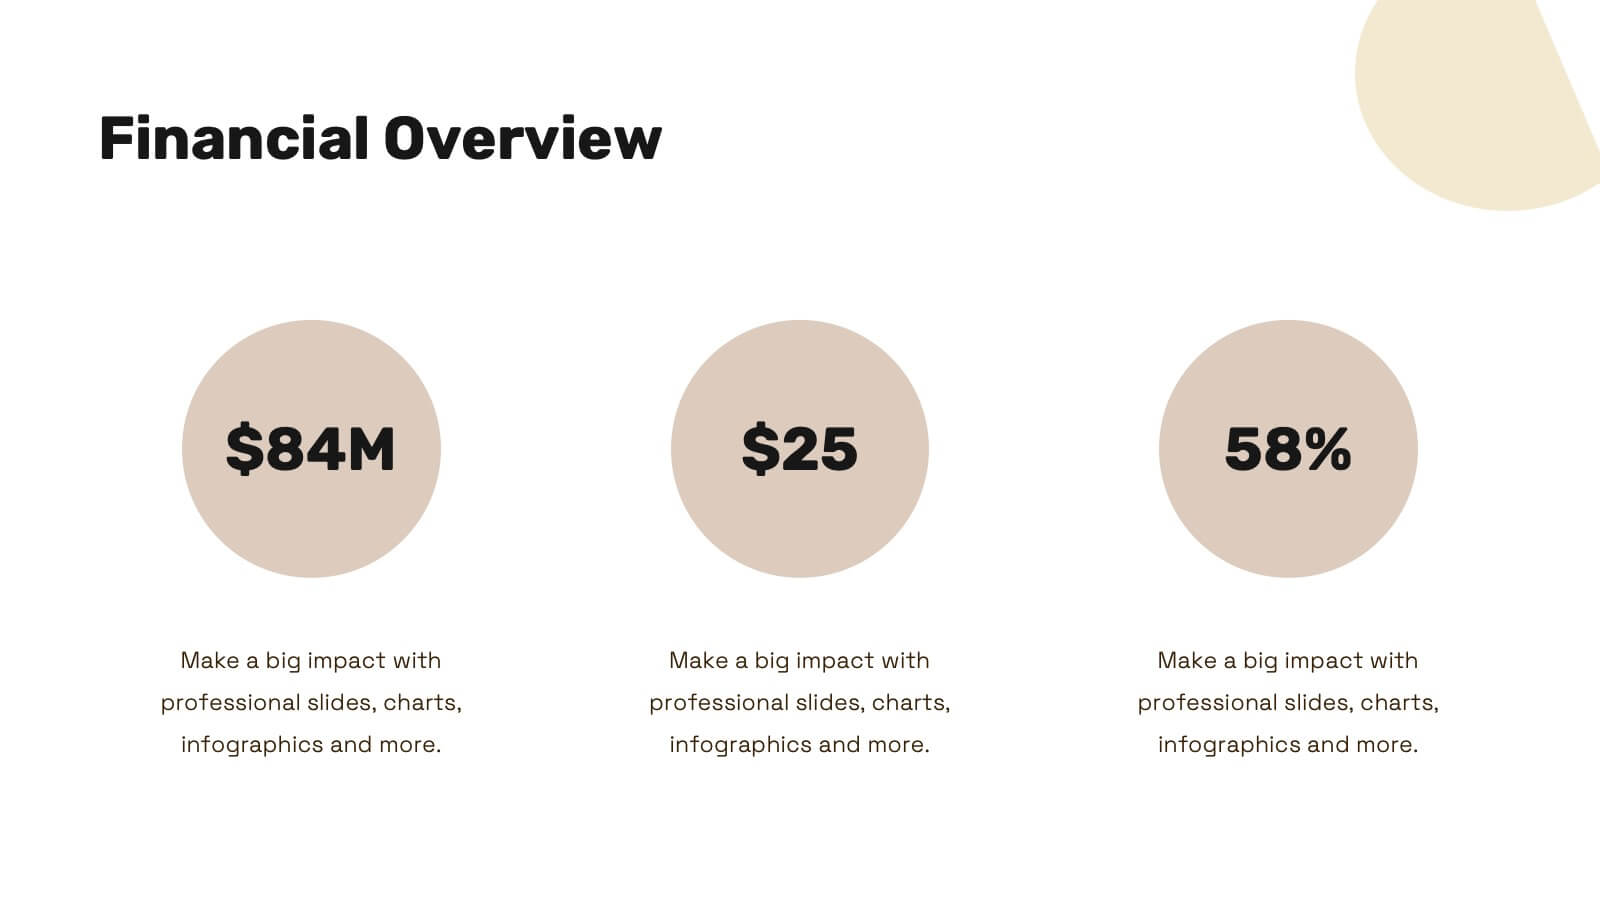
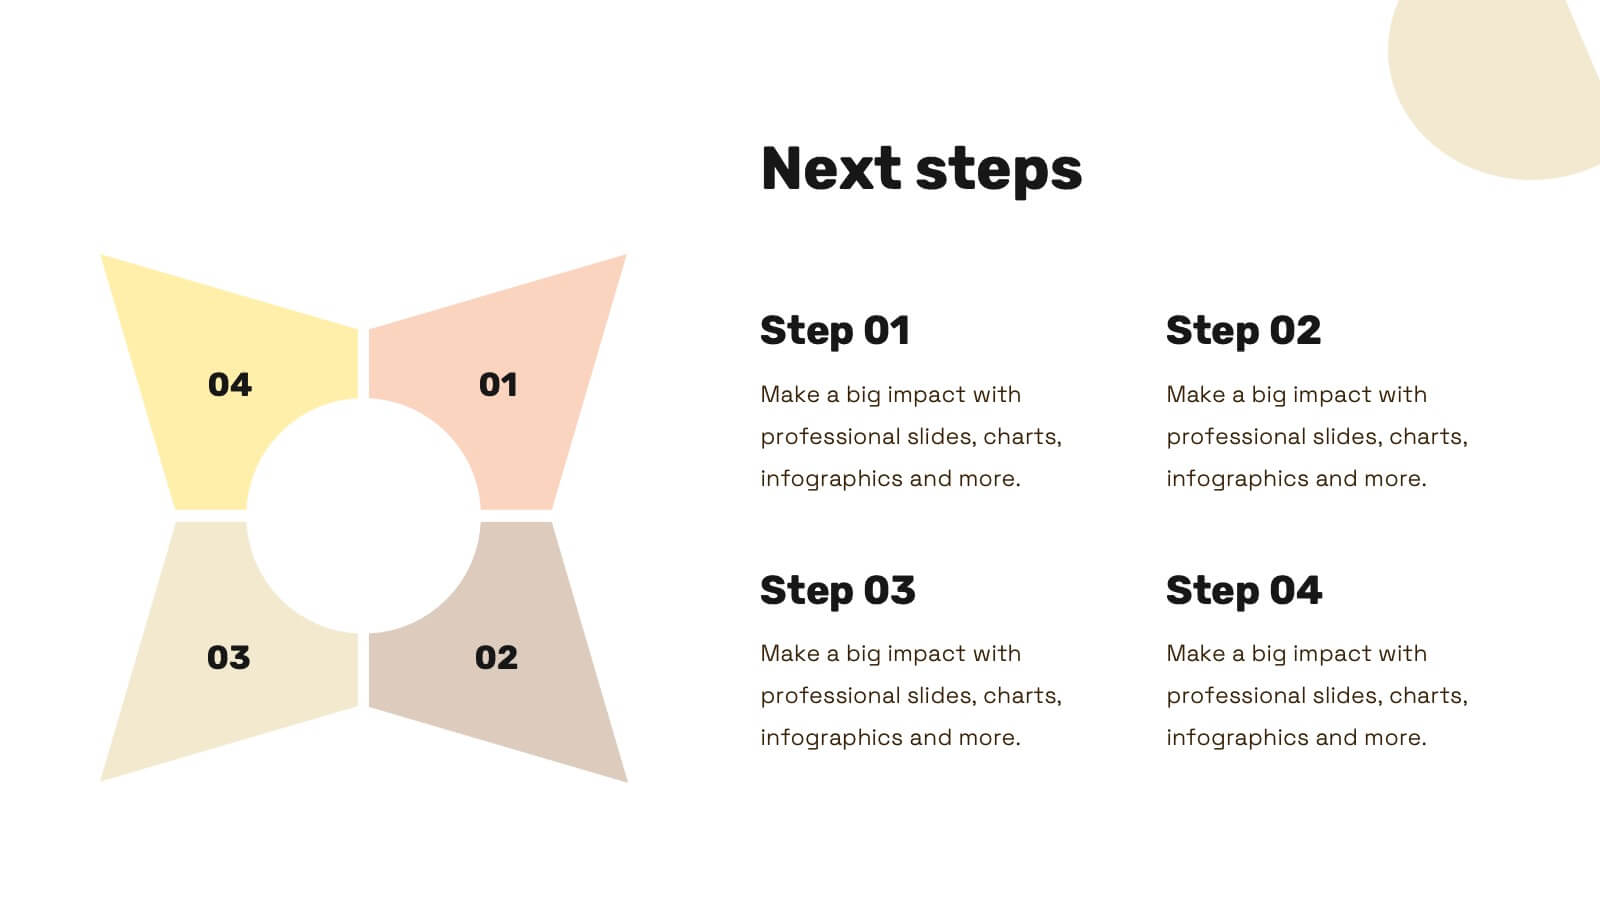
Nova Startup Funding Proposal Presentation
Craft an impressive startup funding proposal with this elegant template. It includes sections for mission, vision, market analysis, business model, and financial overview. Ideal for clear and professional presentations. Fully compatible with PowerPoint, Keynote, and Google Slides for easy customization.


5 slides
New Product Innovation Plan Presentation
Bring your ideas to market with confidence using this clear and engaging presentation. Designed to showcase every stage of product development, it helps visualize innovation steps, research insights, and launch strategies with impact. Fully editable and compatible with PowerPoint, Keynote, and Google Slides for effortless customization and professional results.


6 slides
Data Table Format Presentation
Bring clarity to your data with a clean, modern layout that helps your audience compare details at a glance. This presentation is perfect for pricing, feature breakdowns, or structured business insights, keeping information organized and easy to read. Fully compatible with PowerPoint, Keynote, and Google Slides.


6 slides
Clear Roadmap and Action Strategy Presentation
Present your strategic roadmap with clarity using this arrow-step diagram. Ideal for visualizing processes, workflows, or goal-driven action plans. The curved sequence highlights five progressive steps with icons and color coding. Fully customizable in PowerPoint, Keynote, or Google Slides—perfect for business strategy meetings, project planning, or milestone tracking.


23 slides
Ethelin Digital Strategy Presentation
The digital strategy presentation template is designed to showcase your company's goals, market analysis, and strategic initiatives. Featuring slides for SWOT analysis, performance metrics, and action plans, it’s perfect for business planning and stakeholder engagement. Fully customizable and compatible with PowerPoint, Keynote, and Google Slides.


5 slides
Modern Business Pitch Presentation
Stand out in any meeting with a sharp, minimalist design that brings your business story to life. This presentation is perfect for outlining goals, showcasing data, and pitching ideas with confidence. Fully editable and compatible with PowerPoint, Keynote, and Google Slides for easy, professional customization.


23 slides
Solarae Investor Pitch Presentation
This Investor Pitch Deck Presentation is designed to impress potential investors with a modern, professional layout. Covering key topics like company overview, financials, competitive landscape, and milestones, it's fully customizable and easy to edit in PowerPoint, Keynote, and Google Slides. Perfect for startups seeking funding opportunities.


7 slides
Housing Investment Strategy Presentation
Visualize housing strategies with this clean, key-focused layout. Featuring a central house-and-key icon flanked by six sections, this slide is perfect for outlining investment stages, market insights, or project milestones. Fully editable in Canva, PowerPoint, and Google Slides—ideal for real estate professionals, developers, or analysts presenting actionable housing strategies.


5 slides
Problem-Solving and Risk Navigation Presentation
Navigate uncertainty with clarity using the Problem-Solving and Risk Navigation presentation. This slide features a winding, color-coded path that visually represents each step in a complex decision-making process—from initial analysis to final action. Each of the five stages is marked with an arrow and an icon for intuitive storytelling. Ideal for strategy meetings, risk management workshops, or project reviews. Fully editable in PowerPoint, Keynote, and Google Slides.


4 slides
Vision Statement Development Framework Presentation
Define and refine your company’s future with the Vision Statement Development Framework. This clean, step-by-step infographic guides you through creating a focused and inspiring vision statement. Ideal for strategic sessions, leadership presentations, and goal-setting workshops. Fully editable in PowerPoint, Canva, and Google Slides for seamless customization.


5 slides
Visual Decision-Making with Harvey Balls Presentation
Simplify complex evaluations with this Harvey Ball comparison chart. Ideal for product comparisons, feature assessments, or decision-making matrices, this slide presents up to 6 items and 4 features with intuitive visual cues. Fully editable in PowerPoint, Keynote, or Google Slides, it’s perfect for business, marketing, and strategy teams seeking clear and compelling insights.


21 slides
Dewspire Project Management Plan Presentation
Streamline your project planning process with this visually striking and organized presentation template. Perfectly designed to communicate every stage of your project management, it features sections for problem analysis, objectives, and the scope of work. The timeline, budget breakdown, and resource allocation slides ensure your plans are both clear and actionable. Highlight team expertise with dedicated meet the team layouts and showcase your commitment to quality through evaluation criteria and risk management plans. Ideal for team presentations or client proposals, this template supports PowerPoint, Google Slides, and Keynote, offering full customization for seamless adaptability. Deliver your project vision with confidence and precision!


4 slides
Digital Payment and Card Services Presentation
Step into the world of contactless commerce with this clean, modern slide design. It’s built to help you present how digital payment systems and card-based services are transforming transactions in today’s economy. Perfect for fintech updates, product walkthroughs, or training decks. Fully compatible with PowerPoint, Keynote, and Google Slides.


6 slides
Modern Travel Infographic
Explore your story like a globe waiting to be spun, using this clean visual layout to highlight key destinations, ideas, or data points in a modern, travel-inspired flow. It’s perfect for simplifying complex information with style. Fully customizable and compatible with PowerPoint, Keynote, and Google Slides.


26 slides
Saam Presentation Template
Are you looking for a way to make your food presentation more fun and yummy-looking? Well, look no further! Our Saam food presentation template is just what you need. It's packed full of fun graphics and pictures of your food that will make your presentation look super tasty. And the best part? You can customize the photo layouts and charts to make your presentation look exactly how you want it with all the important information. So whether you're presenting your new restaurant to your investor, or showing your friends what you cooked for dinner this week, this template has got you covered.