


Features
- 6 Unique slides
- Fully editable and easy to edit in Microsoft Powerpoint, Keynote and Google Slides
- 16:9 widescreen layout
- Clean and professional designs
- Export to JPG, PDF or send by email


Do you have any questions?
Recommend


7 slides
McKinsey 7S Model Strategy Presentation
Bring clarity to complex organizational relationships with a clean, structured layout that highlights how key elements connect and influence performance. This presentation helps you explain core components, identify alignment gaps, and guide strategic decision-making with confidence. Easy to customize and fully compatible with PowerPoint, Keynote, and Google Slides.


5 slides
African Continent Map Slide Presentation
Visualize your data across Africa with a modern, easy-to-read map design that highlights regional trends and insights. Perfect for showcasing demographics, market distribution, or project reach, this template combines clarity and impact. Fully compatible with PowerPoint, Keynote, and Google Slides for smooth customization and presentation flexibility.


26 slides
Operational Efficiency Tips Purple Presentation
Optimize your team's workflow and showcase your strategies for improved performance with this operational efficiency template. The vibrant purples and dynamic design invite viewers into a world where streamlined processes and clear objectives lead to success. Lay out the steps of your action plan, from the CEO's vision to the team's execution, with a variety of slides designed for clear communication. Charts and diagrams turn complex data into easy-to-follow visuals, while mockups provide a real-world view of your tools and platforms. Tailored for use in popular presentation software, this set of slides is an excellent aid for managers and consultants aiming to present plans that boost productivity and cut down waste. It’s all about making the complex simple and achieving more with less, helping your audience see the path to a leaner and more effective operation.


4 slides
Decision Analysis Framework Presentation
Make every choice smarter with this structured and visually balanced template designed to showcase options, outcomes, and key insights. Ideal for strategy meetings or data-driven reports, it helps you present decisions with confidence and clarity. Fully editable and compatible with PowerPoint, Keynote, and Google Slides for seamless customization.


10 slides
Conceptual Mind Map for Projects
Illuminate your strategy with the Conceptual Mind Map for Projects Presentation. Designed in the shape of a lightbulb, this diagram visually connects five key project concepts to a central idea, perfect for presenting innovation, team workflows, or business planning. Easily editable in PowerPoint, Keynote, or Google Slides to suit any industry or audience.


5 slides
Meal Plan and Nutrition Guide Presentation
Simplify your nutrition strategy with the Meal Plan and Nutrition Guide Presentation. This visually engaging circular layout lets you outline five key nutrition pillars or daily meals with icons and editable titles. Ideal for dietitians, wellness coaches, or health brands. Compatible with PowerPoint, Canva, and Google Slides for seamless customization.


7 slides
Thank You Card Infographic
Celebrate the art of gratitude with this sophisticated collection, perfectly blending contemporary design with a personal touch. Each layout is crafted with aesthetic finesse, featuring subtle color palettes, elegant typography, and thoughtful placement of visual elements that enhance the warmth of your message. Offering a variety of designs from minimalist to richly textured backgrounds, this collection provides a unique backdrop for expressing thanks. Customize these cards for any occasion, whether it's professional gratitude towards colleagues and clients, or personal appreciation for friends and family. Ideal for both digital expressions and printed notes, this set ensures your message of thanks is received with the sentiment it’s intended. It’s a wonderful way to convey appreciation and leave a memorable impression on its recipients.


5 slides
SWOT Analysis Infographics
SWOT analysis is a strategic planning tool used to assess the strengths, weaknesses, opportunities, and threats of an individual, organization, or project. These infographics are powerful visual tools that allow you to present comprehensive SWOT analysis in a clear and impactful way. Whether preparing a business presentation, strategic planning session, or educational material, this template provides a visually engaging format to showcase the key aspects of a SWOT analysis. The customizable features of the template allow you to tailor it to your specific industry ensuring that your SWOT analysis is presented in a concise, and impactful manner.


5 slides
SEO Optimization Infographics
The goal of SEO optimization is to attract more organic traffic to a website by improving its search engine ranking for relevant keywords and phrases. These Infographics are visual representations that show the steps, techniques, and best practices for improving a website's ranking in search engine results pages. These allow you to provide a quick and easy-to-understand overview of SEO concepts and strategies, including keyword research, on-page optimization, link building, and technical SEO. These are valuable resources for anyone looking to improve their website's search engine ranking and increase organic traffic.


5 slides
Types of Natural Disasters Infographics
Immerse in the dynamic realm of nature with our types of natural disasters infographics. Utilizing an earthy color scheme of blue, tan, and red, this template plunges viewers into the heart of environmental extremities. It's an invaluable resource for educators, students, and environmentalists. Compatible with Powerpoint, Keynote, and Google Slides. The design, brimming with creative vigor, incorporates striking graphics and icons, offering a vivid exploration of the various forces that shape our planet. This compilation doesn't just inform but captivates, turning statistics and data into compelling storytelling.


12 slides
Editable Chart Presentation
Present your data with impact using the Editable Chart Presentation. This versatile slide set includes colorful bar and line charts designed for performance metrics, sales growth, or budget comparisons. Easily swap out values and labels to match your story. Fully editable in PowerPoint, Keynote, Google Slides, and Canva.


7 slides
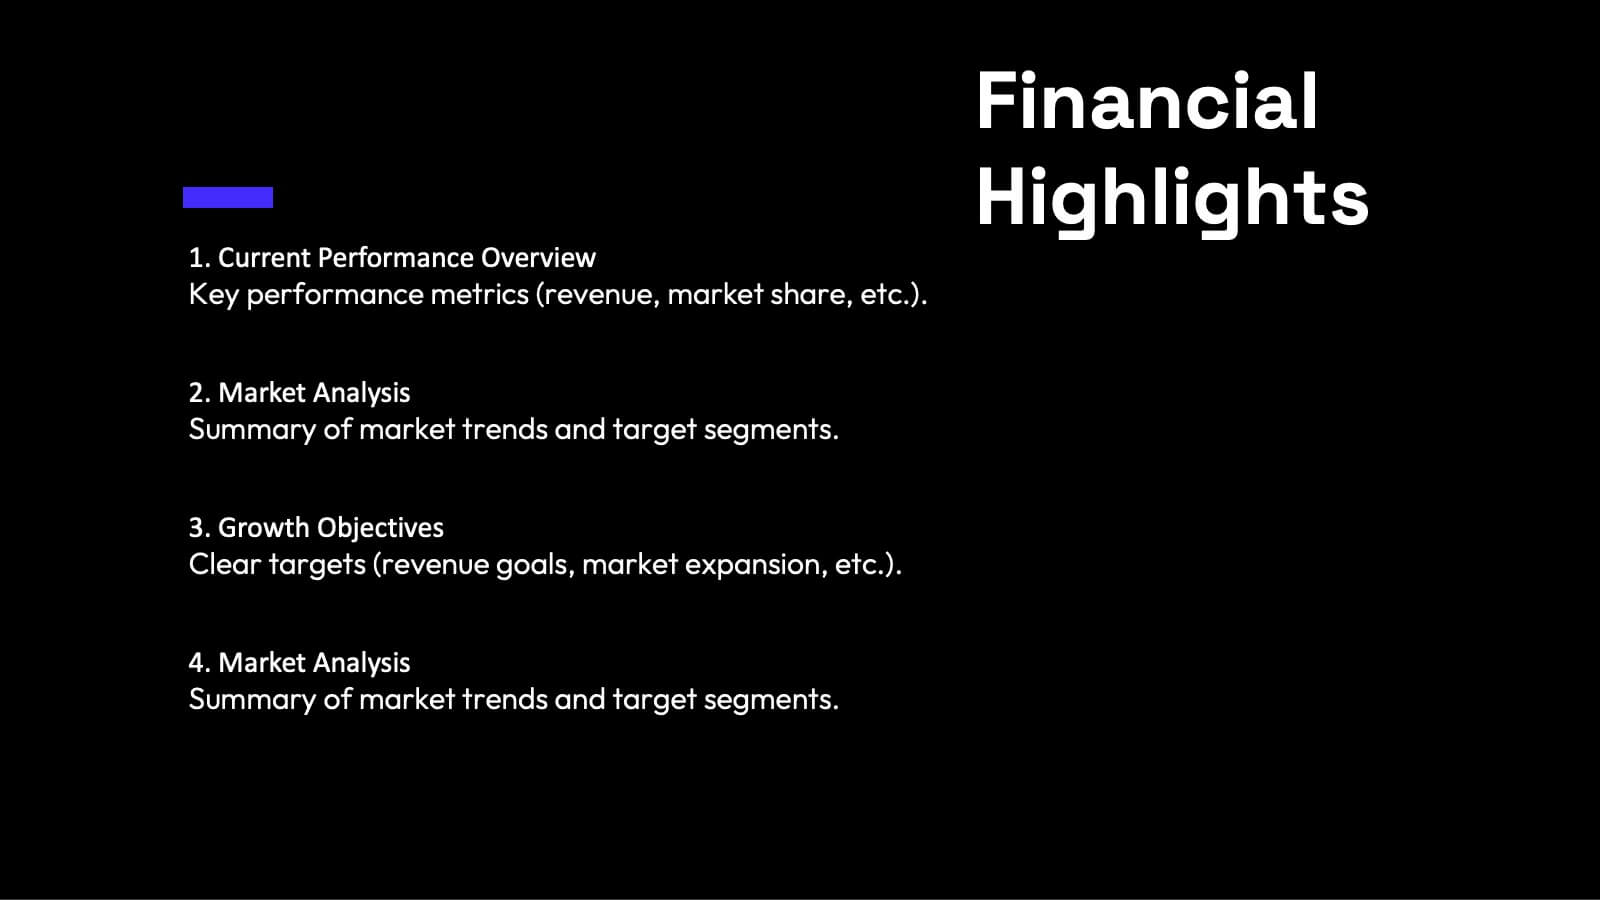
Finance Infographic Presentation Template
Finance is a field that deals with the study of investments and the management of money. Finance Infographics are visual representations of financial information, data, and concepts. This template uses charts, graphs, diagrams, and illustrations to help explain complex financial information in a simple and easy-to-understand way. This Finance Infographic can cover a range of topics including budgeting, investments, expenses, and market analysis, among others. This is the perfect template to use for businesses, financial organizations, and educators to help people understand financial concepts.


20 slides
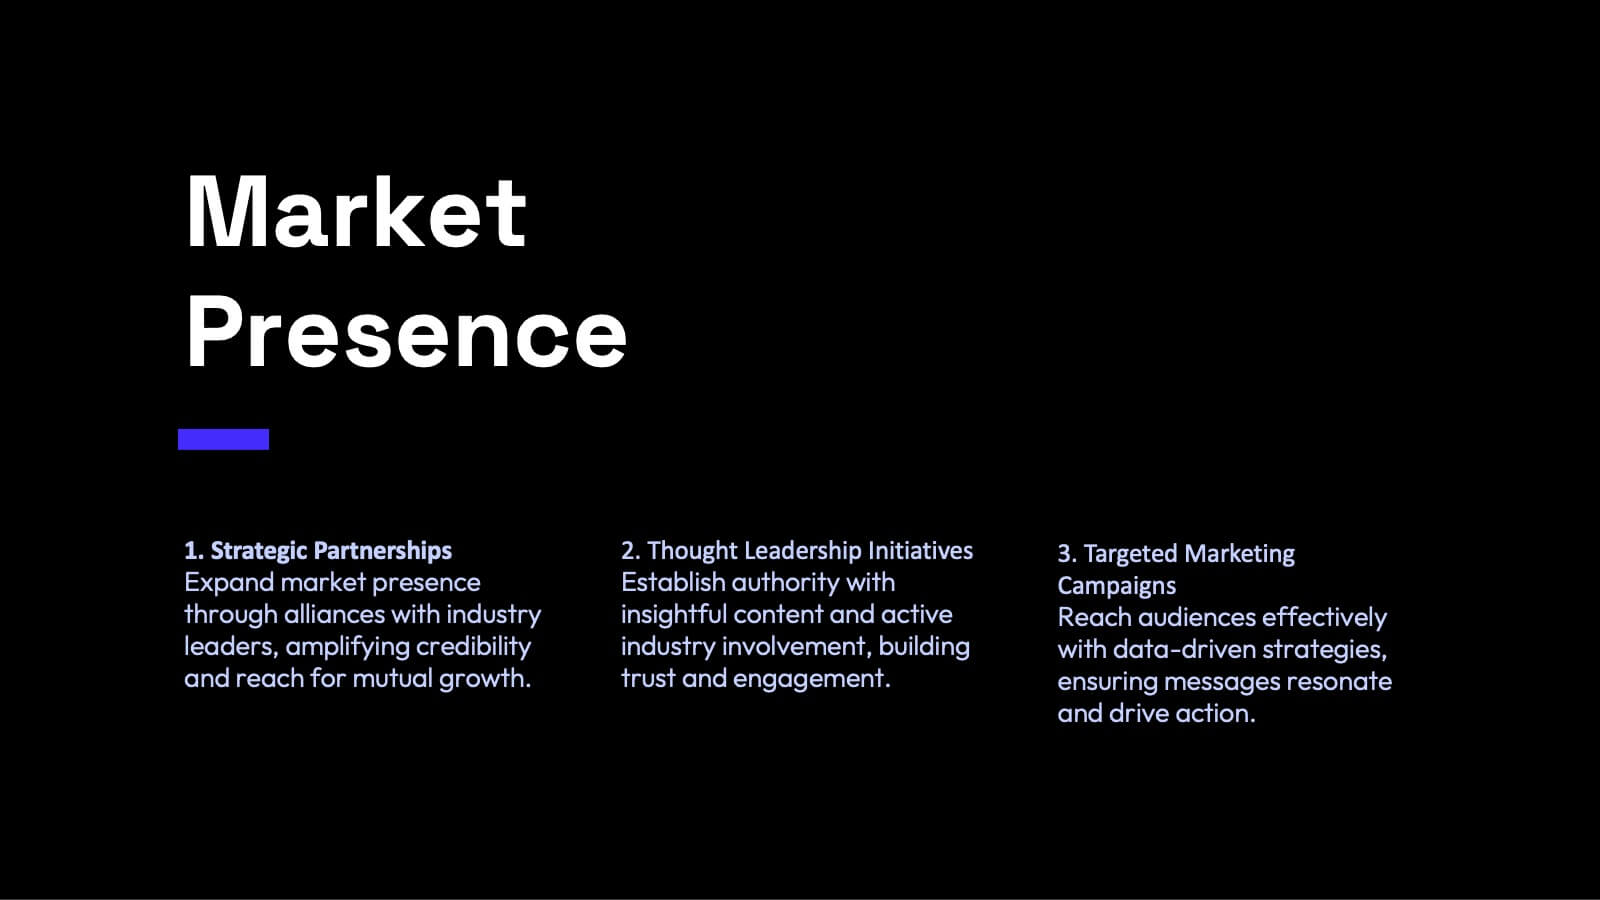
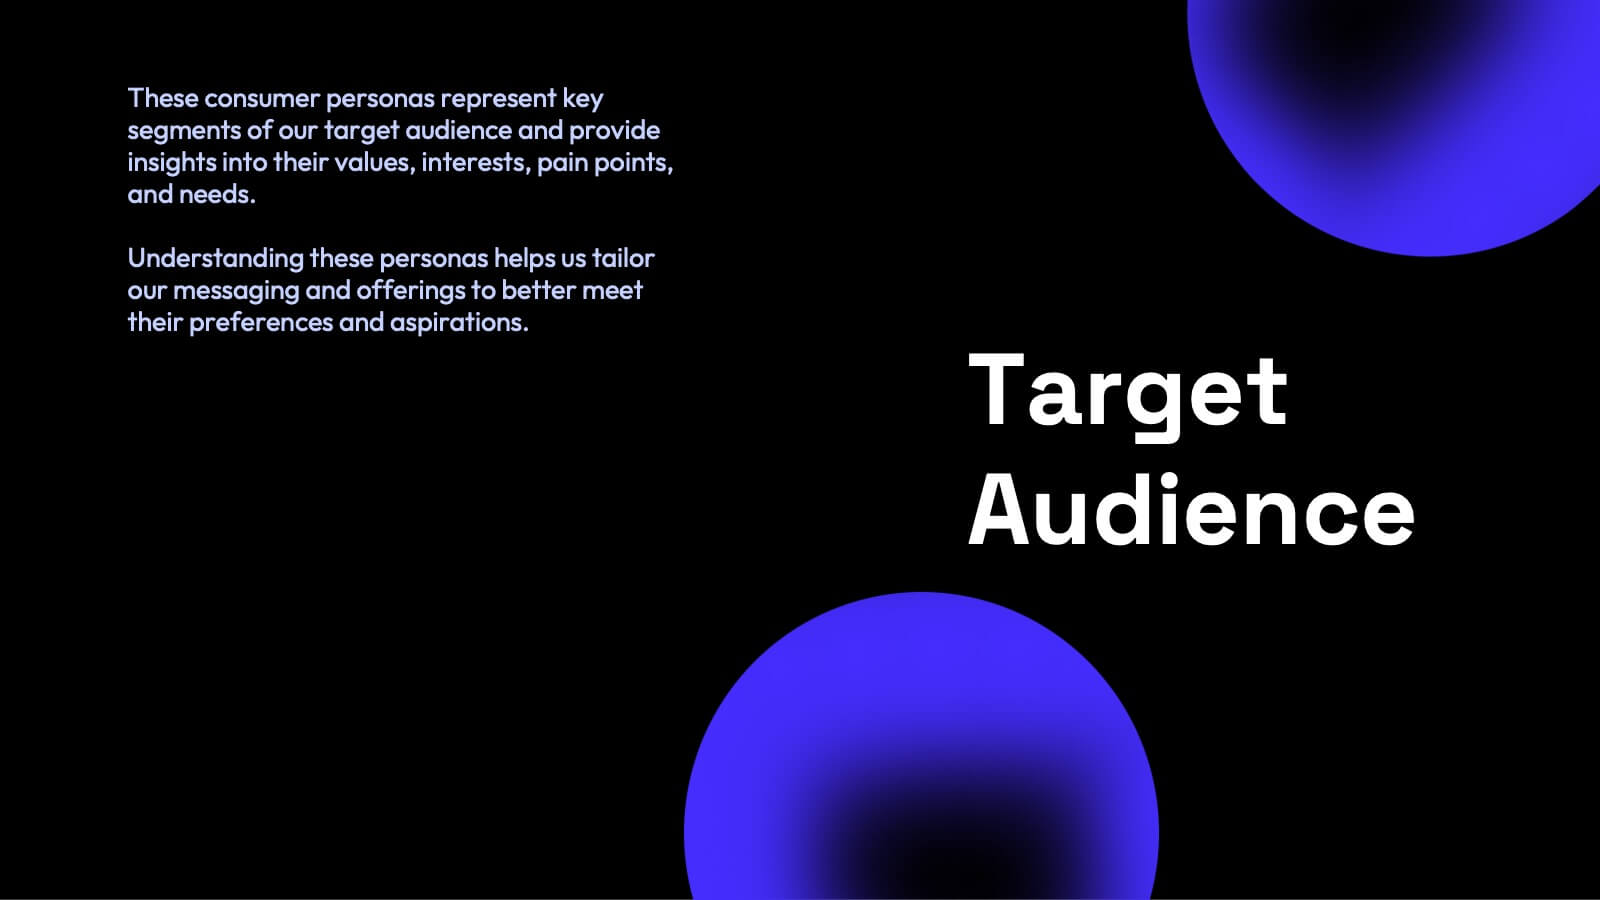
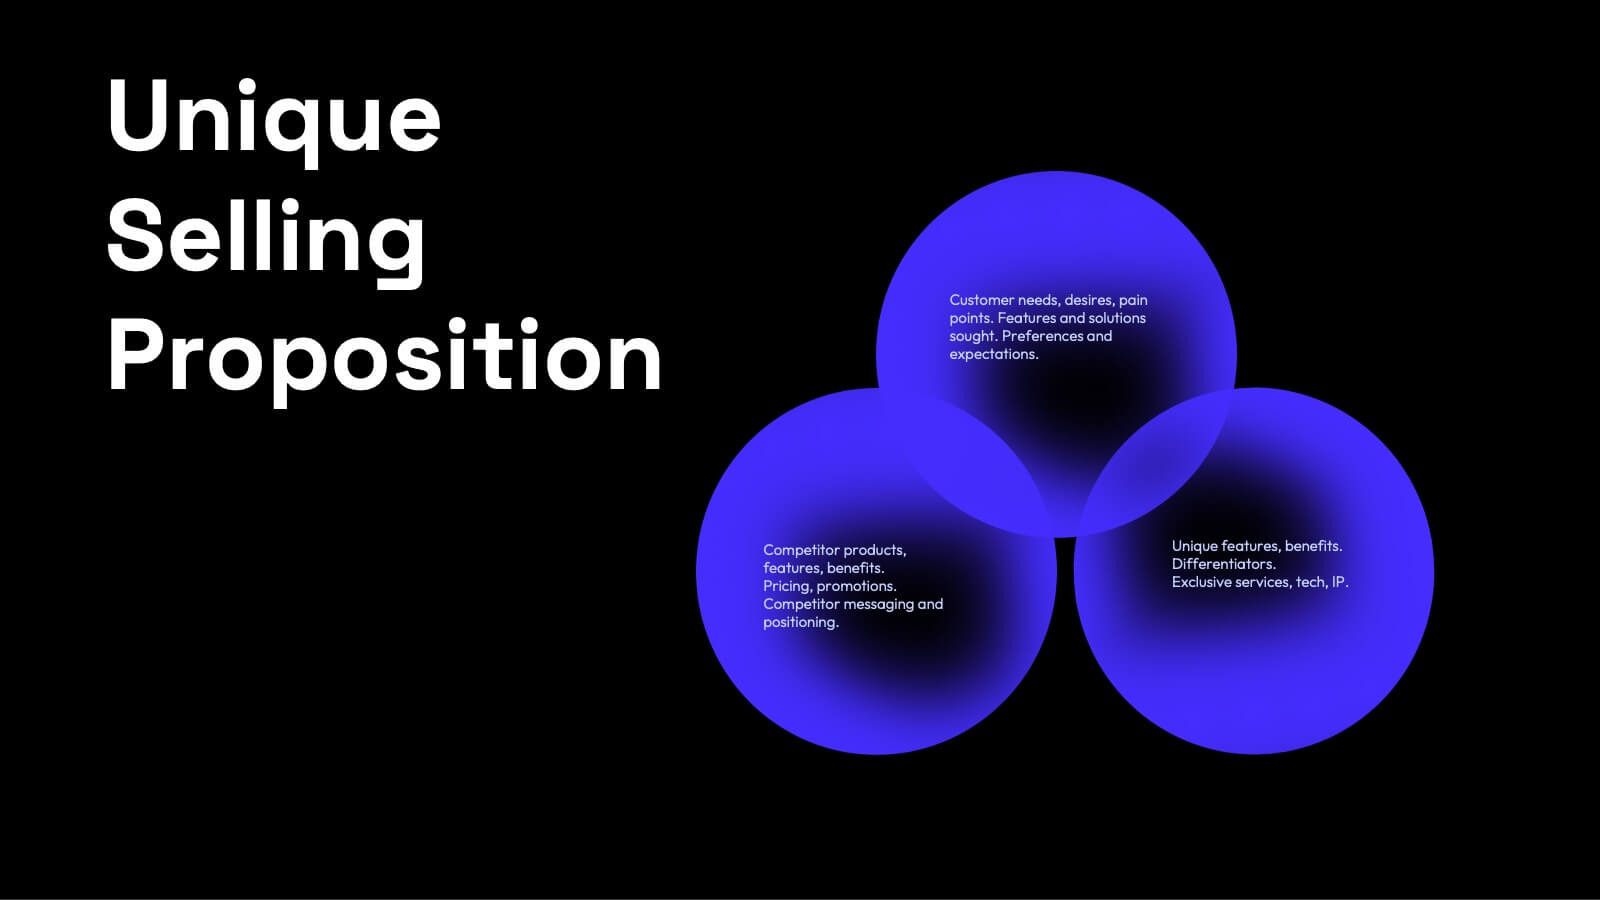
Apex Content Marketing Pitch Deck Presentation
Ignite your marketing strategy with this captivating pitch deck! Perfect for showcasing content marketing plans, it features slides on company history, target audience, and unique selling propositions. Make a lasting impression with sleek, modern designs and compelling content. Compatible with PowerPoint, Keynote, and Google Slides for a smooth presentation experience on any platform.


4 slides
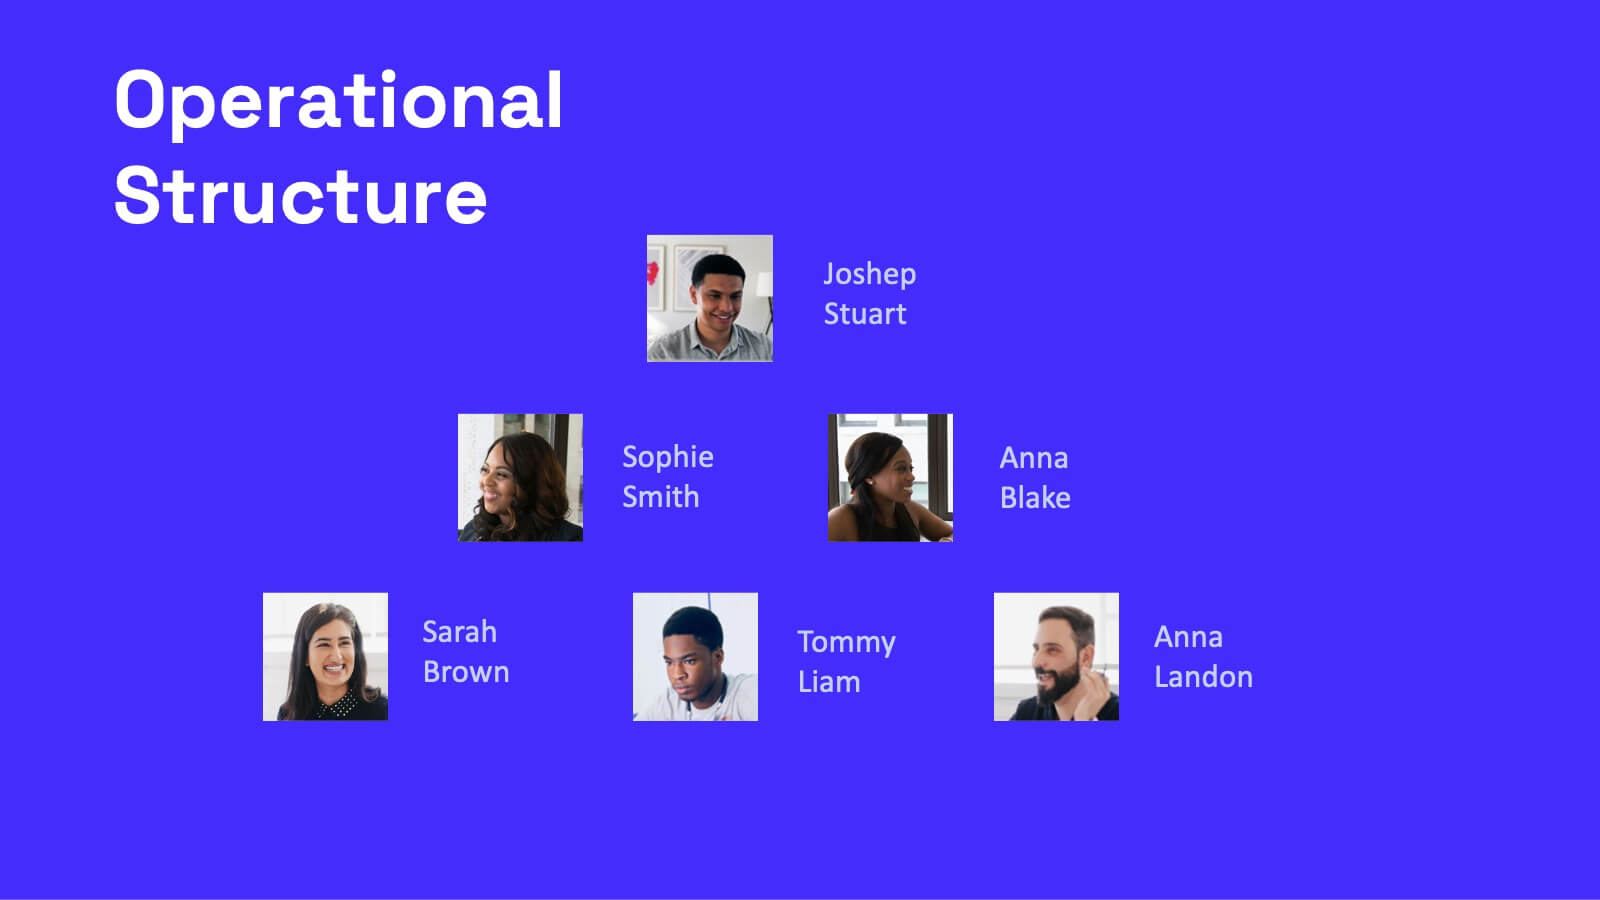
Organizational Hierarchy Diagram Presentation
Clearly map out your company’s structure with this modern organizational hierarchy slide. Designed for clarity, it displays multiple team roles and reporting lines using intuitive icons and connector lines. Ideal for onboarding, strategy, or HR decks. Fully customizable in Canva, PowerPoint, or Google Slides for seamless integration into any presentation.


4 slides
Market Expansion Planning with Blue Ocean Presentation
Visualize your growth journey with this two-step strategic layout. Ideal for presenting current positioning and future market opportunities using Blue Ocean thinking. Each step is illustrated with bold icons and color-coded nodes. Fully editable in PowerPoint, Keynote, and Google Slides—perfect for business development, strategy sessions, and executive presentations.


8 slides
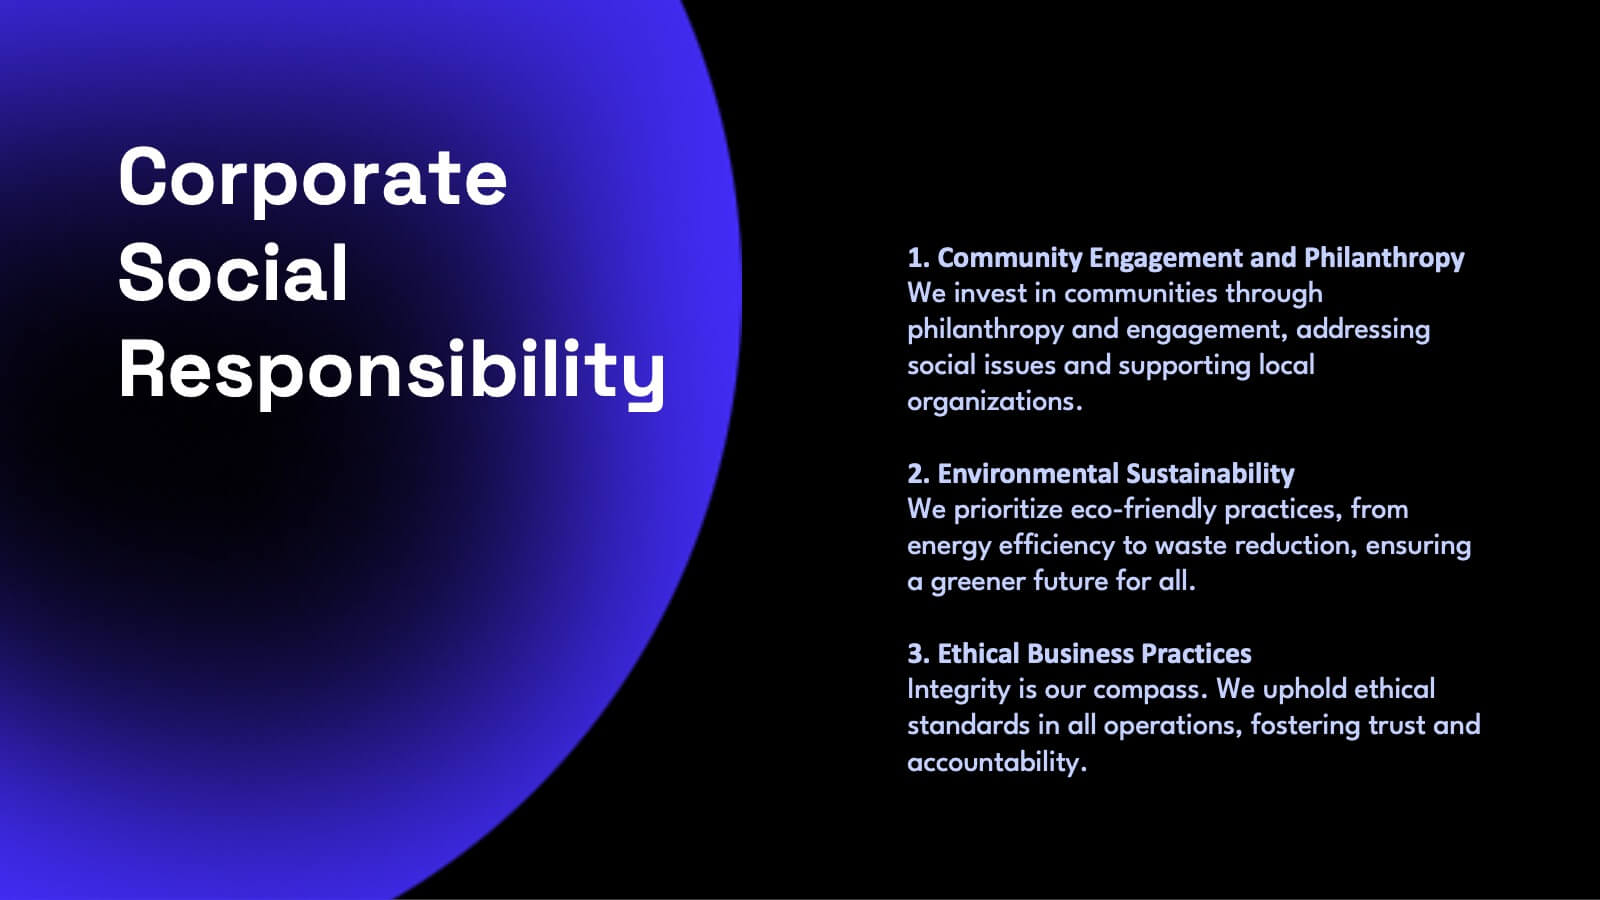
Eco-Friendly Business Practices Presentation
The "Eco-Friendly Business Practices" presentation template is thoughtfully designed to showcase sustainable business practices. Each section of the template features a labeled bin, representing different aspects or initiatives within a company's eco-friendly approach. The clear, colorful representations facilitate easy understanding and effective communication of key environmental strategies. This template is perfect for businesses looking to highlight their commitment to sustainability, discuss green policies, or outline specific recycling or waste reduction methods. It's especially useful for presentations aimed at stakeholders interested in corporate responsibility and environmental stewardship.


21 slides
Kelpie Project Timeline Presentation
This sleek project plan template is perfect for outlining deliverables, timeline, budget breakdown, and risk management. Its modern design ensures clarity and professionalism, making it ideal for team or business presentations. Compatible with PowerPoint, Keynote, and Google Slides, it offers flexibility and ease for showcasing your project's key elements.