


Features
- 7 Unique slides
- Fully editable and easy to edit in Microsoft Powerpoint, Keynote and Google Slides
- 16:9 widescreen layout
- Clean and professional designs
- Export to JPG, PDF or send by email


Do you have any questions?
Recommend


6 slides
Customer Feedback Infographic
Customer feedback refers to the opinions, comments, suggestions, and insights provided by customers about their experiences with a product, service, or company. This infographic template visually presents key insights and strategies for collecting and utilizing customer feedback effectively. This infographic will help you provide essential information for businesses to understand how customers perceive their offerings and how they can improve to better meet customer needs and expectations. The visual elements and a well-structured design will make the presentation engaging and accessible.


4 slides
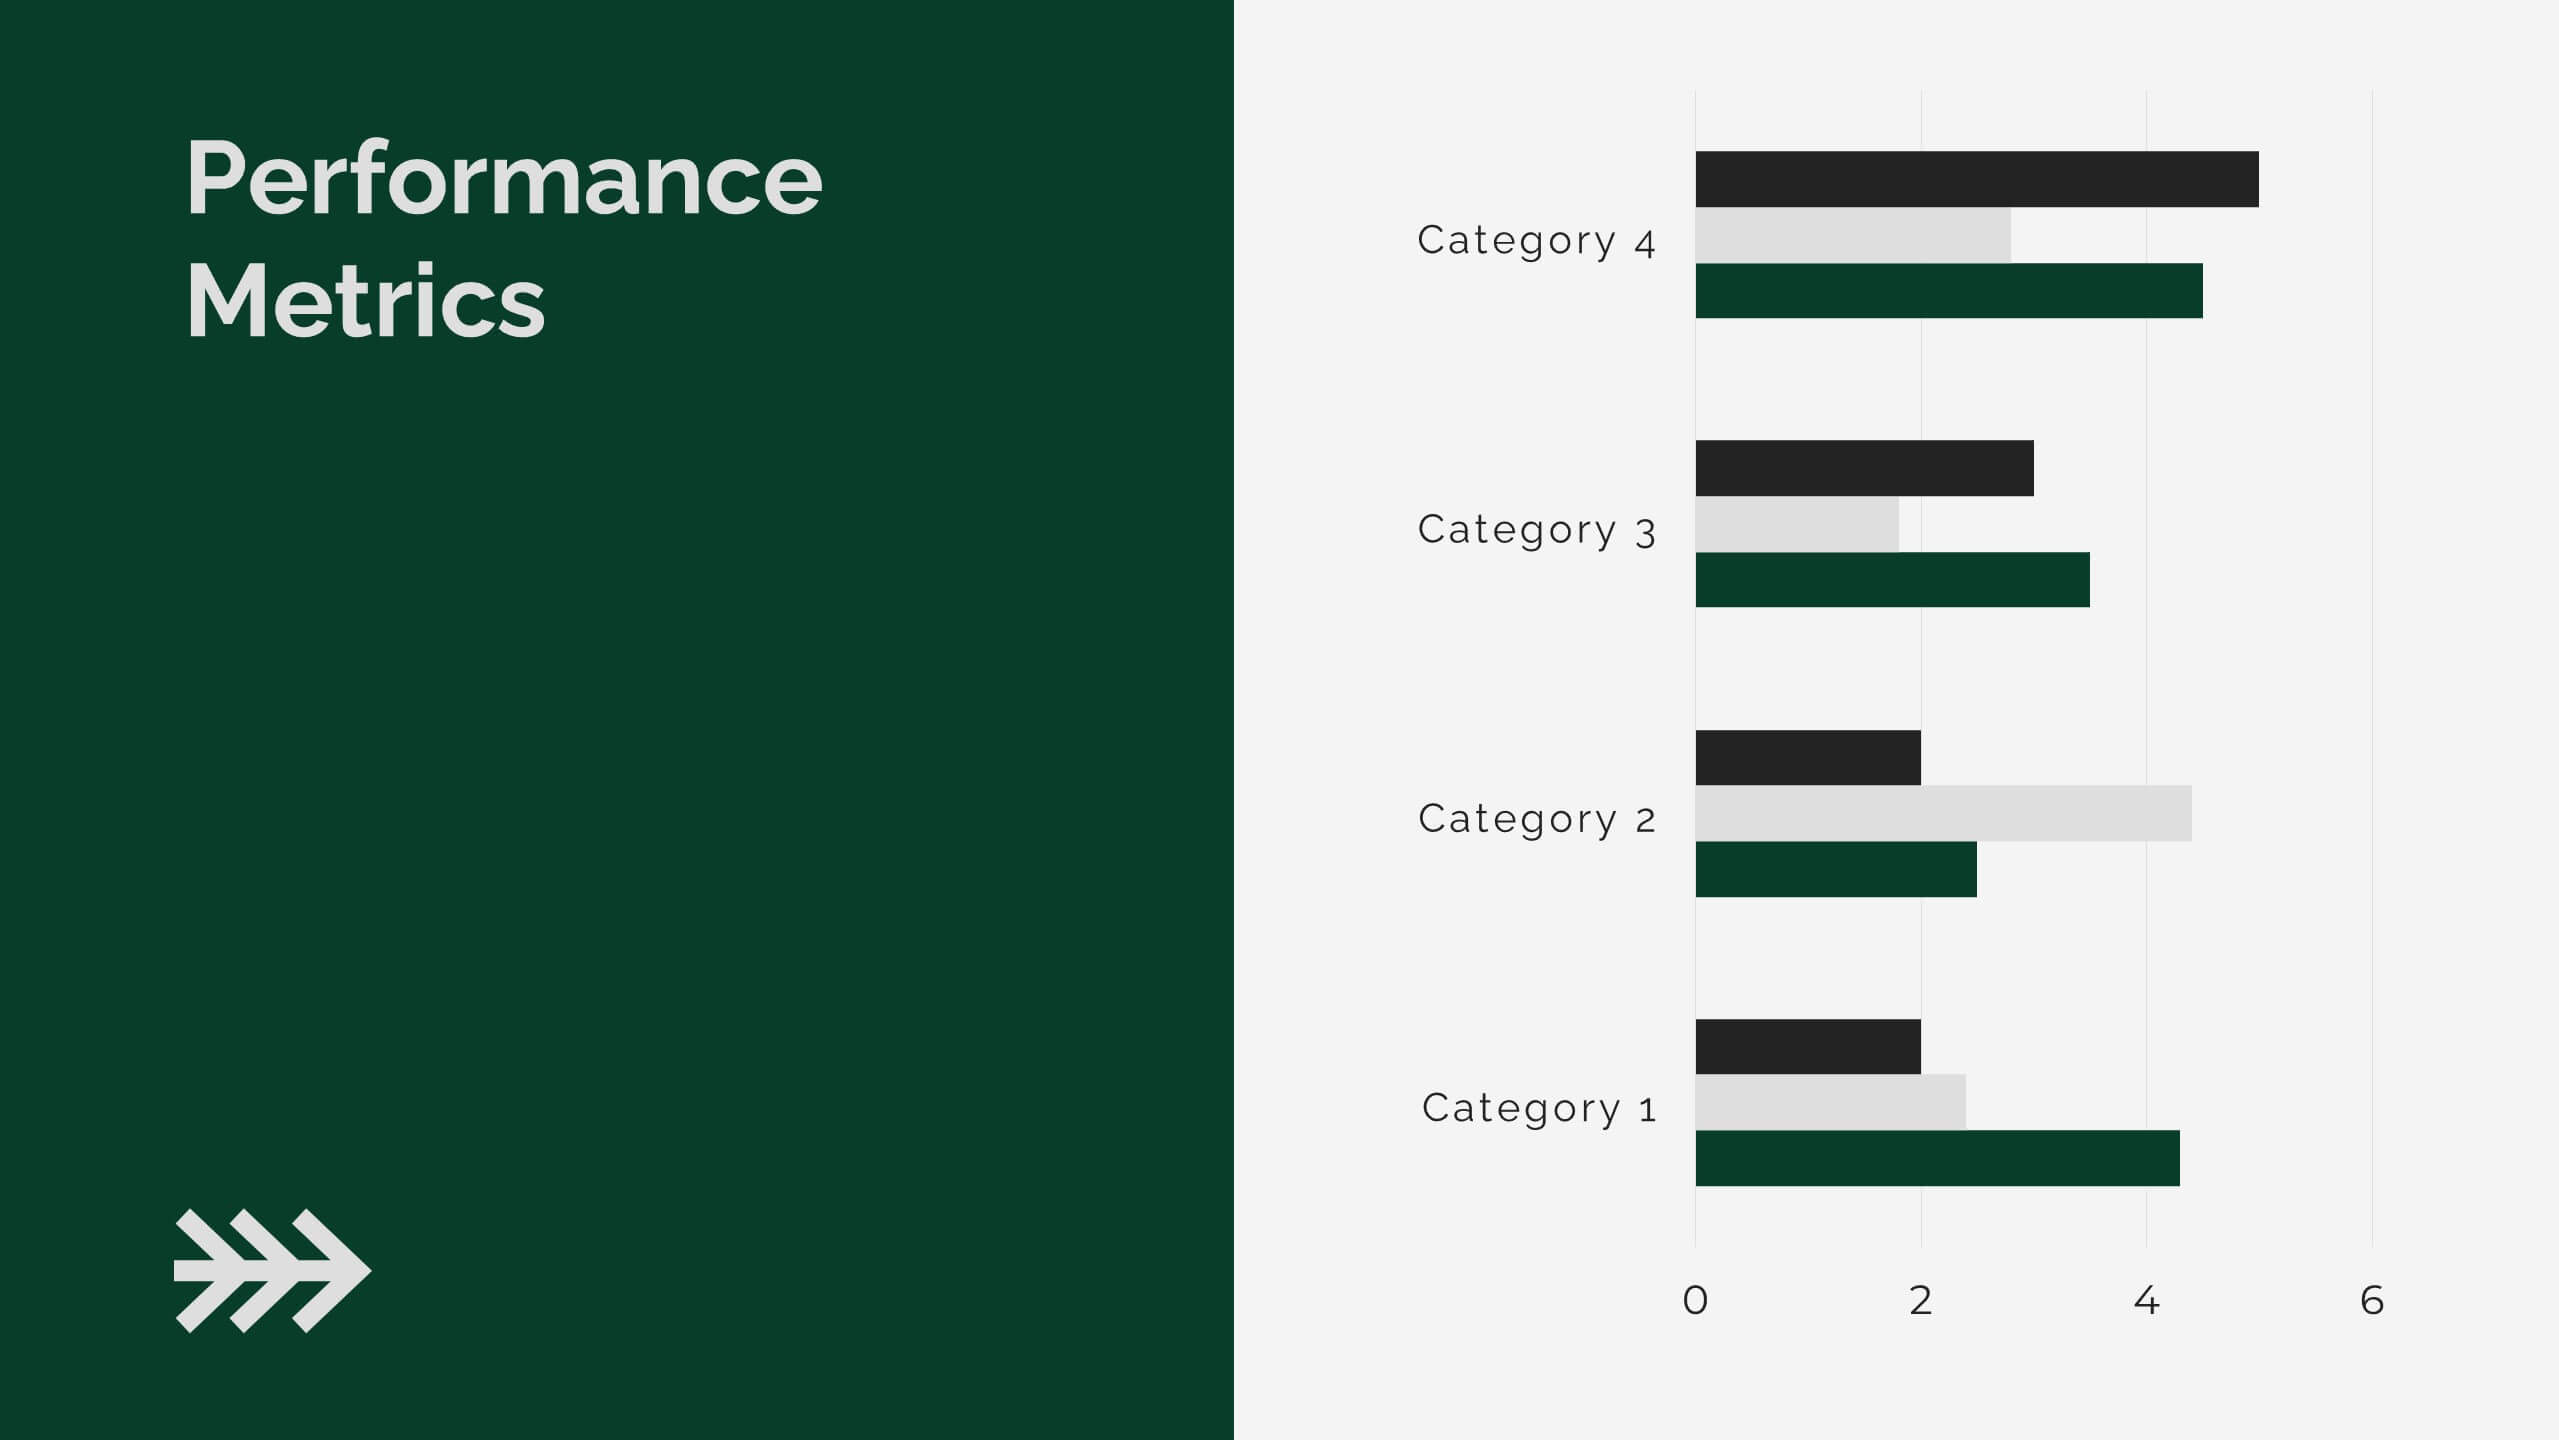
Athlete Performance Metrics Presentation
Track and display key performance data with this Athlete Performance Metrics slide. Featuring a semi-circular layout with sports icons, percentages, and editable text areas, this template helps visualize stats clearly. Ideal for coaching reports or sports analysis. Compatible with PowerPoint, Keynote, and Google Slides for easy customization and use.


26 slides
Salus Rebranding Project Plan Presentation
This rebranding project plan template offers a clear framework for presenting brand identity transformation. Covering brand values, identity components, target audience, positioning, and guidelines, it’s ideal for companies refreshing their brand. Compatible with PowerPoint, Keynote, and Google Slides, it ensures a streamlined, professional presentation of your rebranding strategy.


5 slides
Workforce Alignment Strategy Presentation
Energize your strategy conversations with a clean, modern layout that makes team alignment feel clear, structured, and actionable. This presentation helps you break down goals, track priorities, and visualize key initiatives in a simple, intuitive flow. Ideal for planning sessions and leadership updates. Fully compatible with PowerPoint, Keynote, and Google Slides.


5 slides
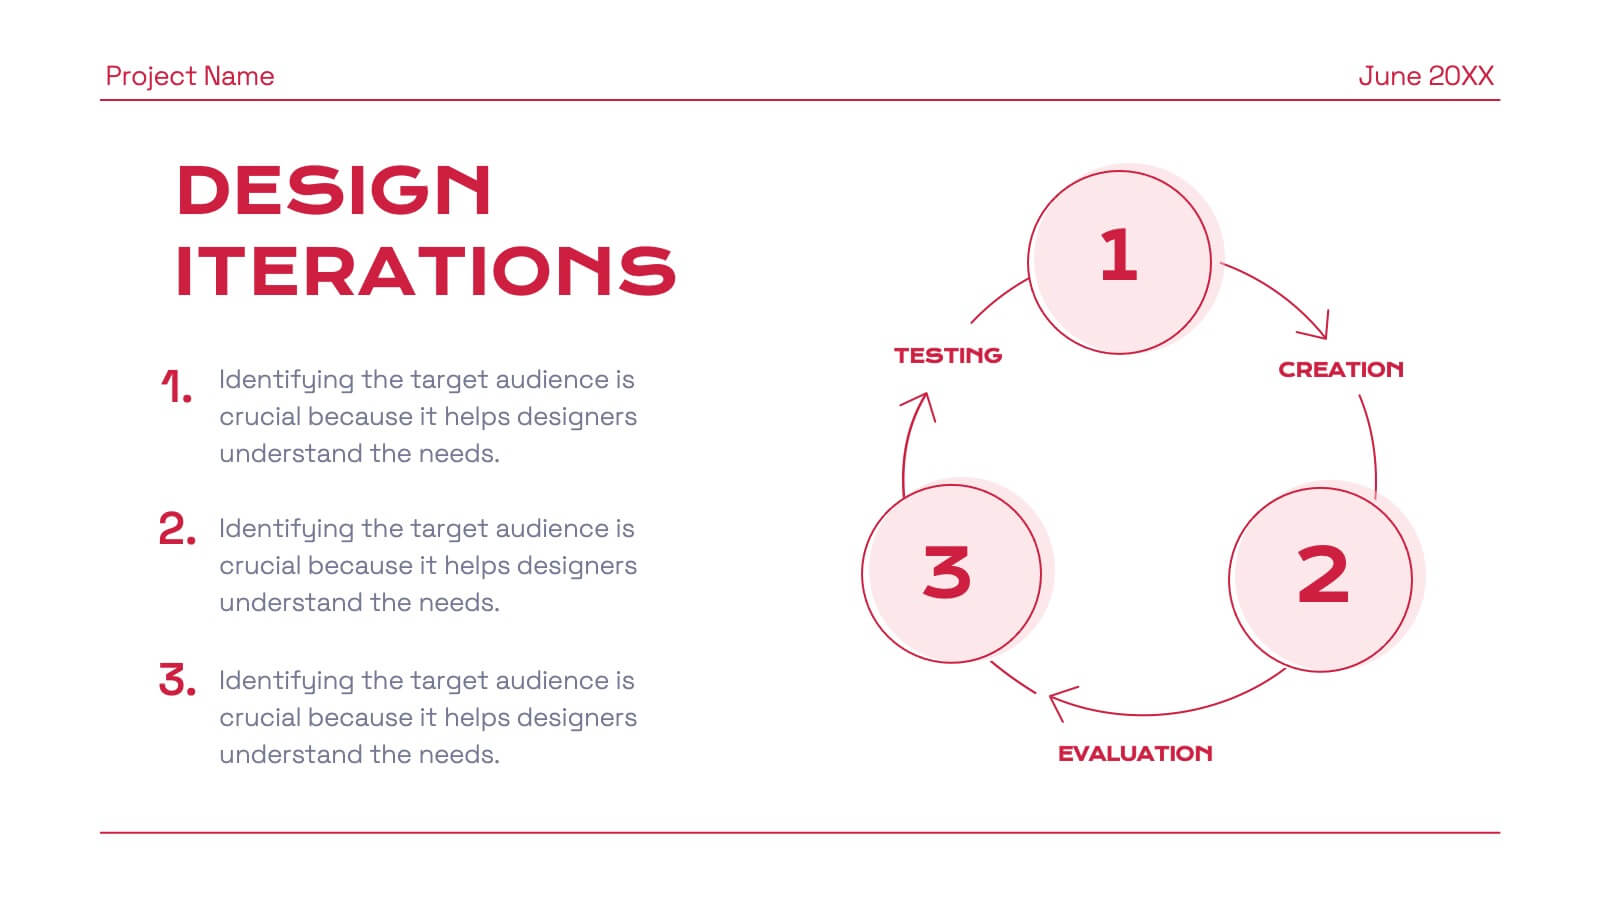
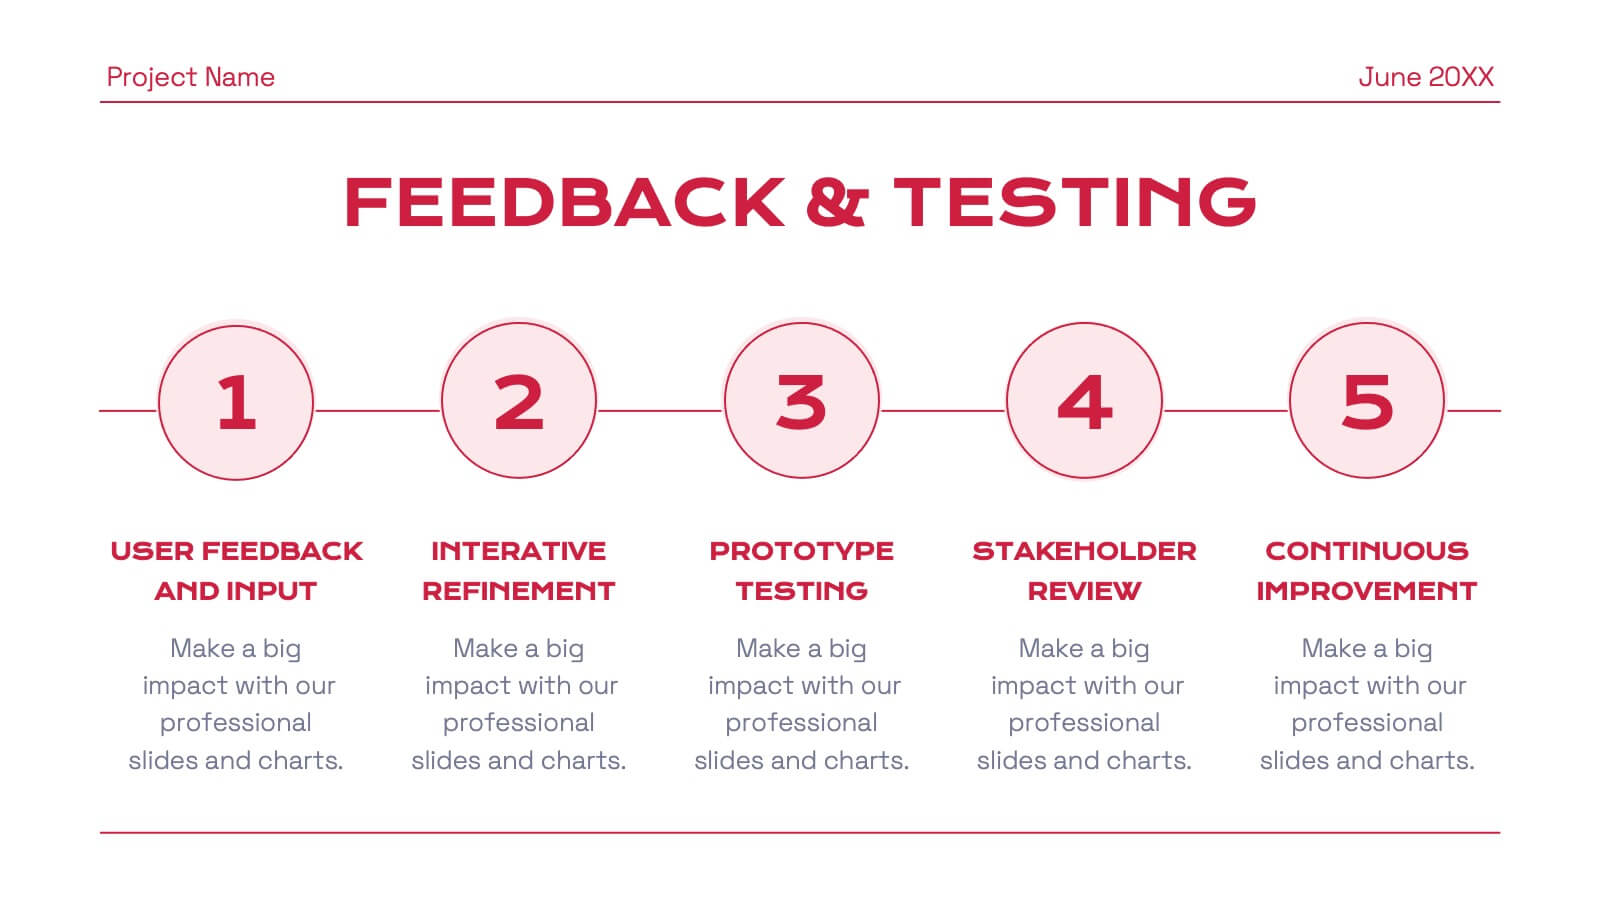
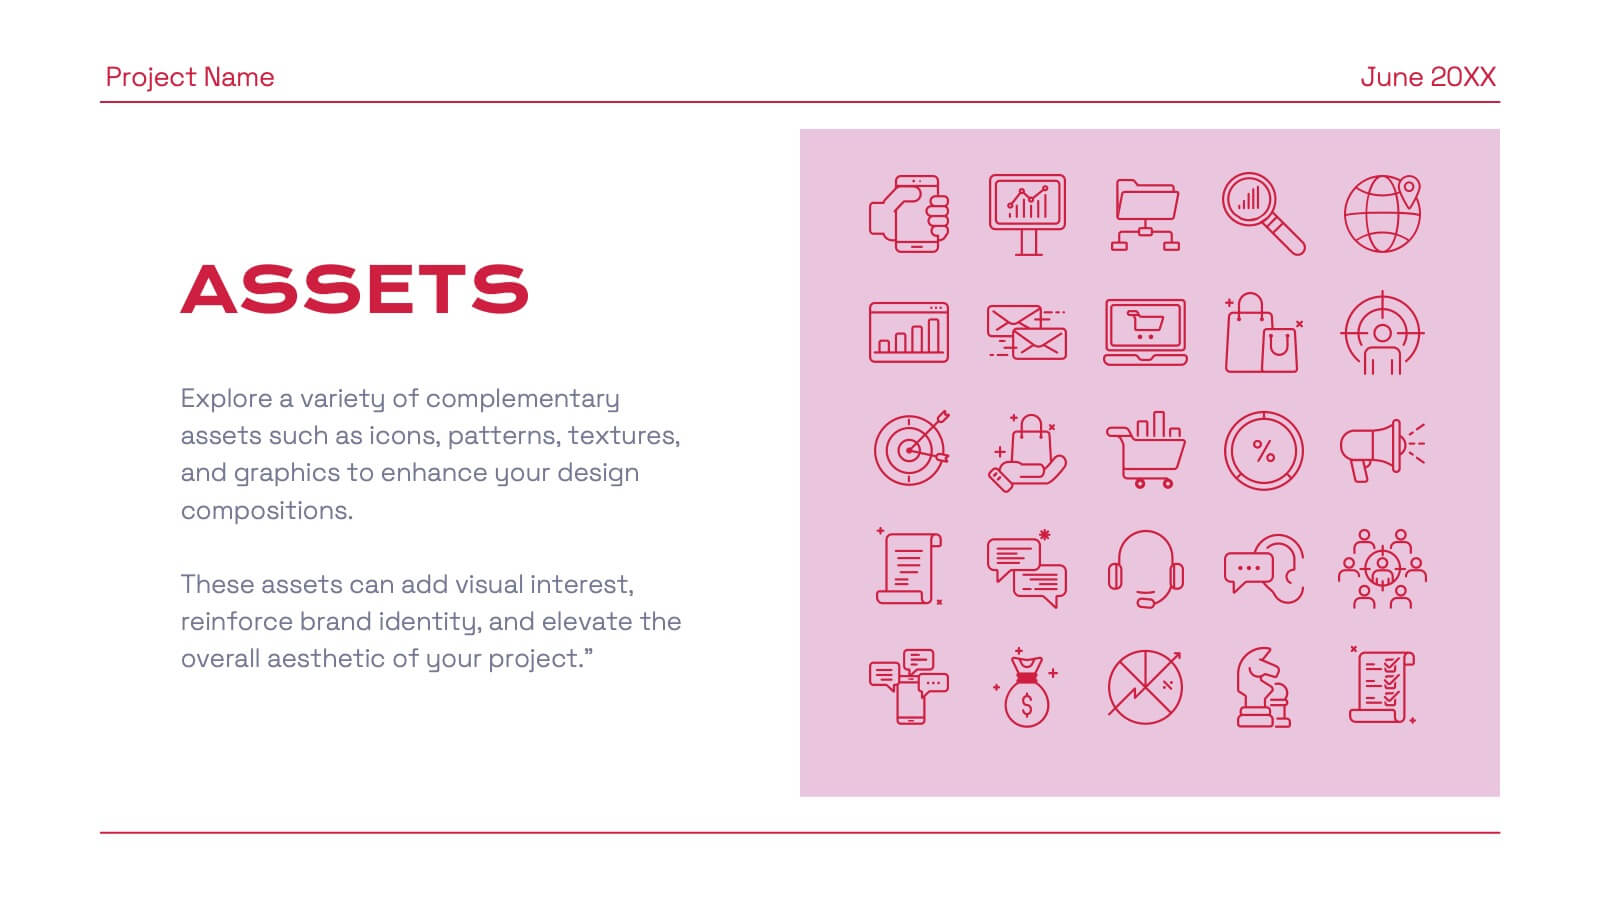
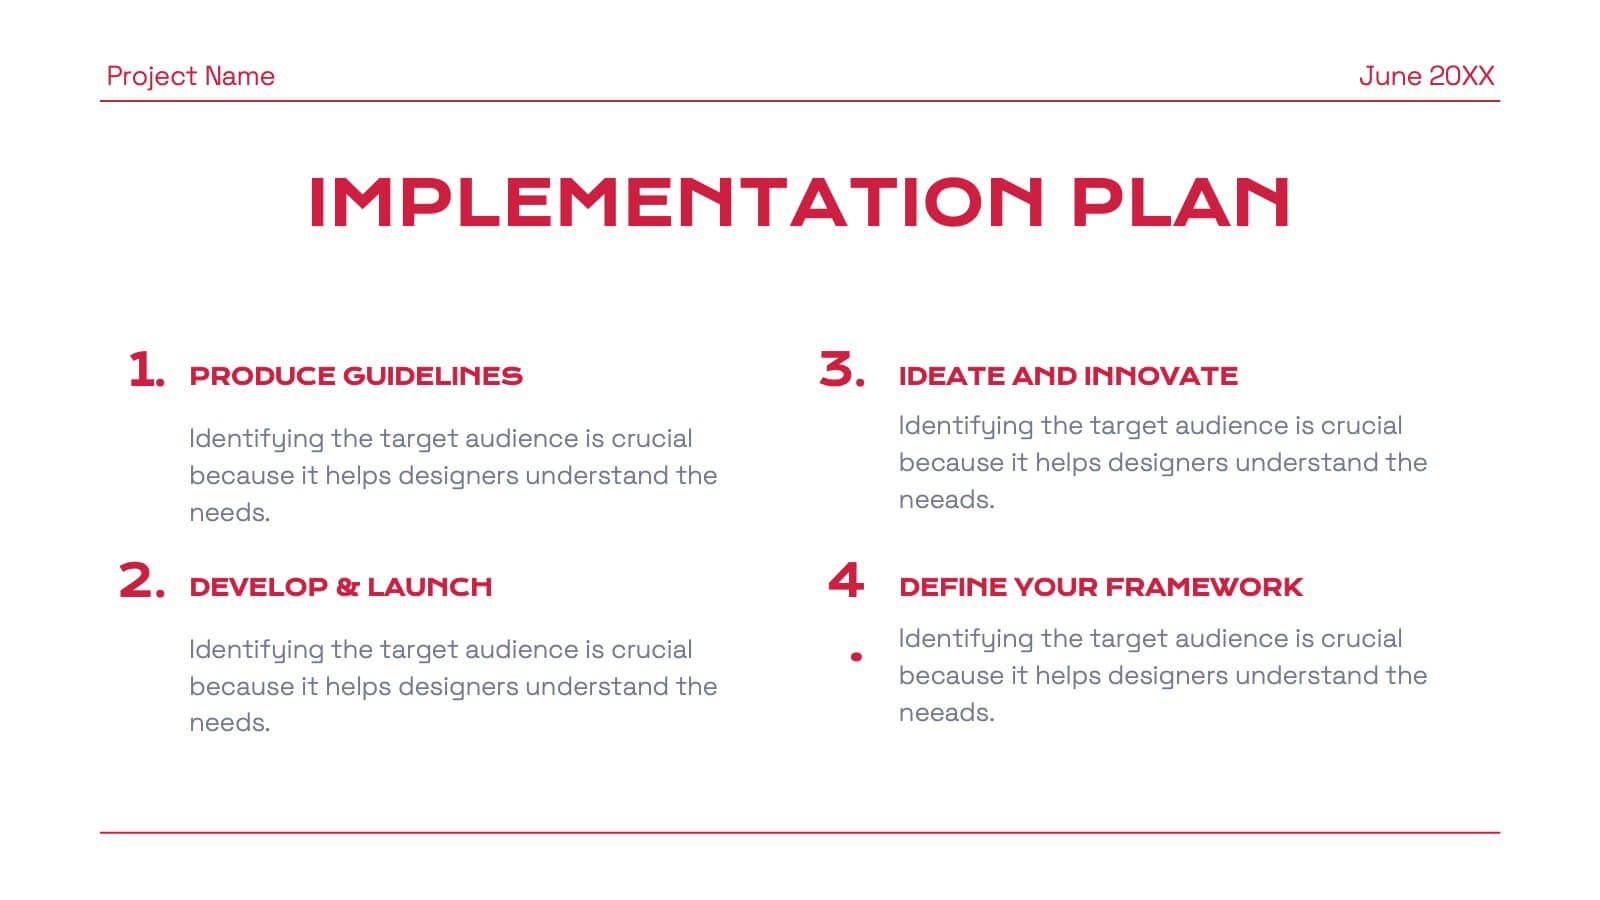
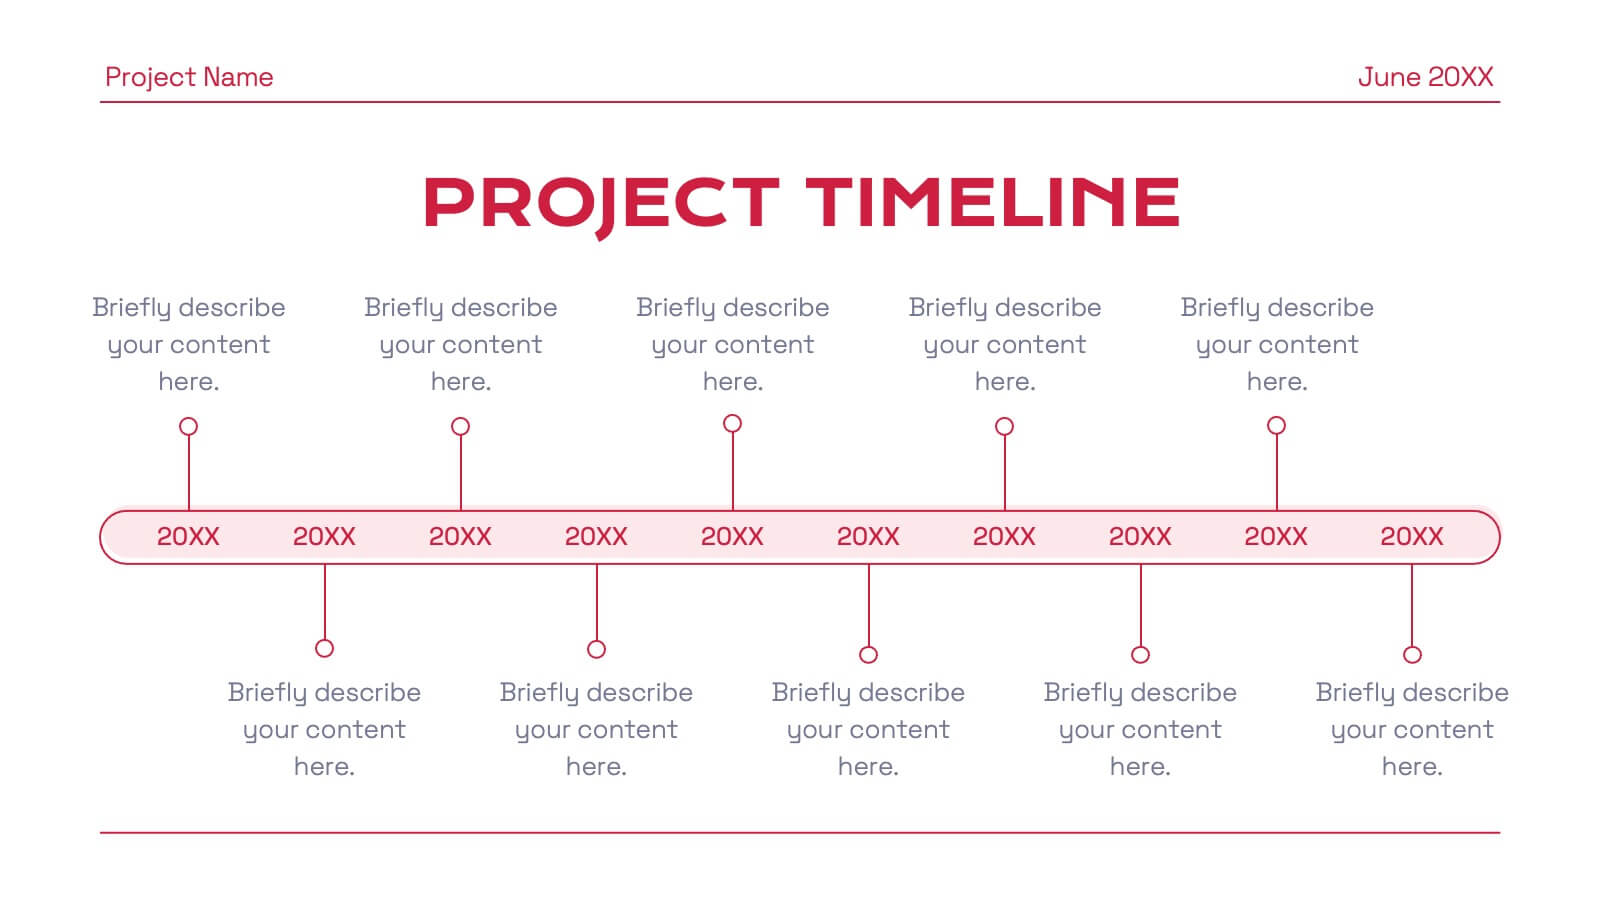
Innovation Framework Presentation
Turn bold ideas into structured success with this engaging presentation design. Perfect for mapping creative processes, innovation systems, and project development stages, it helps present ideas clearly and visually. Fully editable and easy to customize, this presentation is compatible with PowerPoint, Keynote, and Google Slides for effortless use.


7 slides
Population United States Map Infographic Presentation
The United States is located in North America and is comprised of 50 states and the District of Columbia. This template is a stylish and attractive way to showcase your data on a map. It is compatible with Powerpoint, Keynote and Google Slides, making it easily customized and adjusted according to your needs, and for different presentations or reports. This United States Map is the perfect visual for presentations on geography, history, and political science! There are various icons where you can input your data, and statistics. This template can be used for your next map project!


5 slides
Insurance Specialities Infographics
Insurance Specialties refer to specific areas of the insurance industry that require specialized knowledge, expertise, and training. These Infographic templates are visually appealing and informative presentation tools that can be used by insurance companies, brokers, or agents to showcase their unique services and specialties. This template includes a range of customizable graphics, charts, and icons that can be edited to match your brand. With this template, you can clearly and effectively communicate the various types of insurance you offer, such as life, health, property, or liability insurance.


20 slides
Faelight Project Proposal Presentation
A professional project proposal template for showcasing company overview, objectives, scope of work, timelines, and budget breakdowns. Includes sections for client testimonials, pricing structures, and risk mitigation strategies. Fully customizable for various industries and ideal for pitching new projects. Compatible with PowerPoint, Keynote, and Google Slides for seamless presentations.


2 slides
Creative Gratitude Slide Presentation
Express gratitude in style with this creative thank-you slide template! Featuring bold typography and modern geometric elements, this design adds a unique touch to your presentations. Ideal for business pitches, creative projects, and professional meetings. Fully customizable and compatible with PowerPoint, Keynote, and Google Slides for effortless personalization.


7 slides
SEO Optimization Infographic Presentation
Search engine optimization (SEO) is the practice of optimizing websites and digital content to rank higher in search engine result pages. Use this template to lay out the basics of optimization, including best practices and examples, as well as a checklist for everything you need to know. This template is perfect to show your audience a step by step process of SEO. It includes a great space to enter data, knowledge and helpful tips with a simple design and bright colors. This can be used in an article, presentation or even a blog post to give your audience all the information needed about SEO.


8 slides
Health and Safety Training
Create impactful safety briefings with this visual slide designed around a caution-sign layout. Perfect for outlining training modules, compliance steps, or workplace hazard procedures, it presents four key points using icons and color-coded elements. Fully customizable in PowerPoint, Keynote, and Google Slides.


7 slides
Annual Summary Infographic
Revitalize your year-end reports with our expertly designed Infographic Templates! Tailored for professionals keen on showcasing annual achievements and insights, this collection offers a dynamic array of layouts that cater to varied presentation needs. From streamlined bar graphs and intricate circle diagrams to engaging icon lists, these templates are engineered to translate complex annual data into digestible, visually appealing content. Customize colors, fonts, and text to mirror your organization’s branding, ensuring a consistent and professional appearance across all communications. Compatible with PowerPoint, Google Slides, and Keynote, our templates simplify the creation of presentations that not only inform but inspire. Ideal for executives, team leaders, and marketers, these templates are indispensable tools for illustrating yearly progress, highlighting significant outcomes, and strategizing for future success. Enhance your professional presentations and make your annual summary not just seen, but remembered.


4 slides
Work From Home Bests Practices Presentation
Bring remote work to life with a clean, modern layout that helps teams stay focused, organized, and productive. This presentation highlights key habits, routines, and strategies for working efficiently from home, offering clear visuals that simplify every point. Fully editable and compatible with PowerPoint, Keynote, and Google Slides.


34 slides
Accelerator Pitch Deck
Welcome to our Accelerator Pitch Deck presentation! This template is designed to help you create a captivating pitch deck for your startup or business to showcase your venture to potential programs or investors. With its sleek and modern design, this template will help you effectively communicate your business idea, market opportunity, growth plans, and financial projections to capture the attention of programs and investors. This template can also cover other various aspects of your business, including your problem and solution, market validation, customer acquisition, competitor analysis, milestones, team introduction, and more.


22 slides
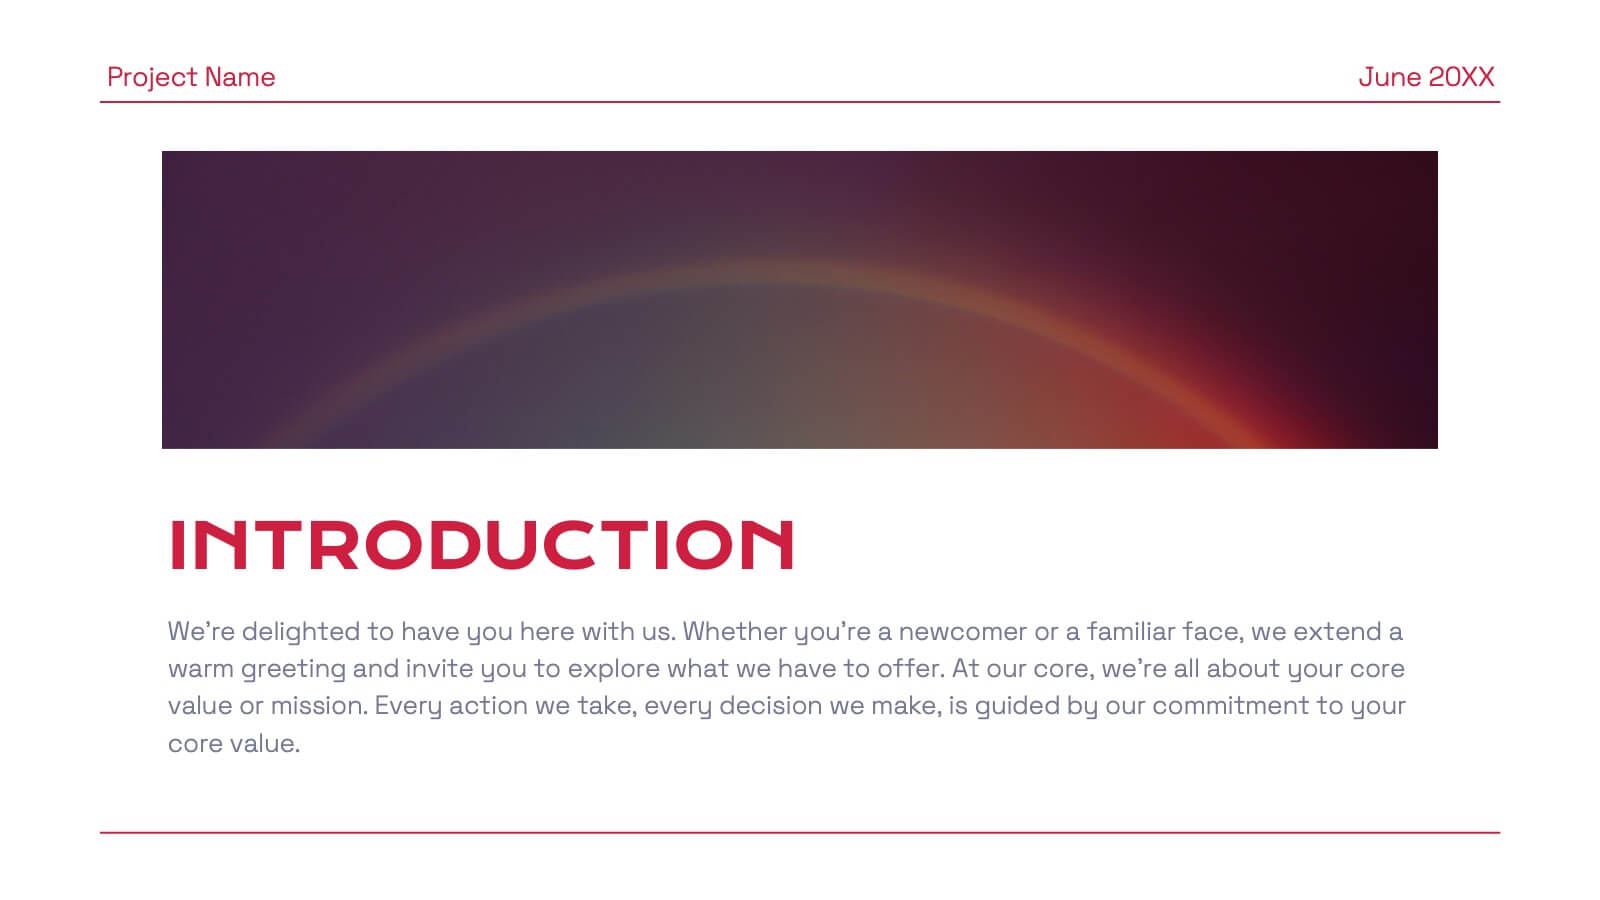
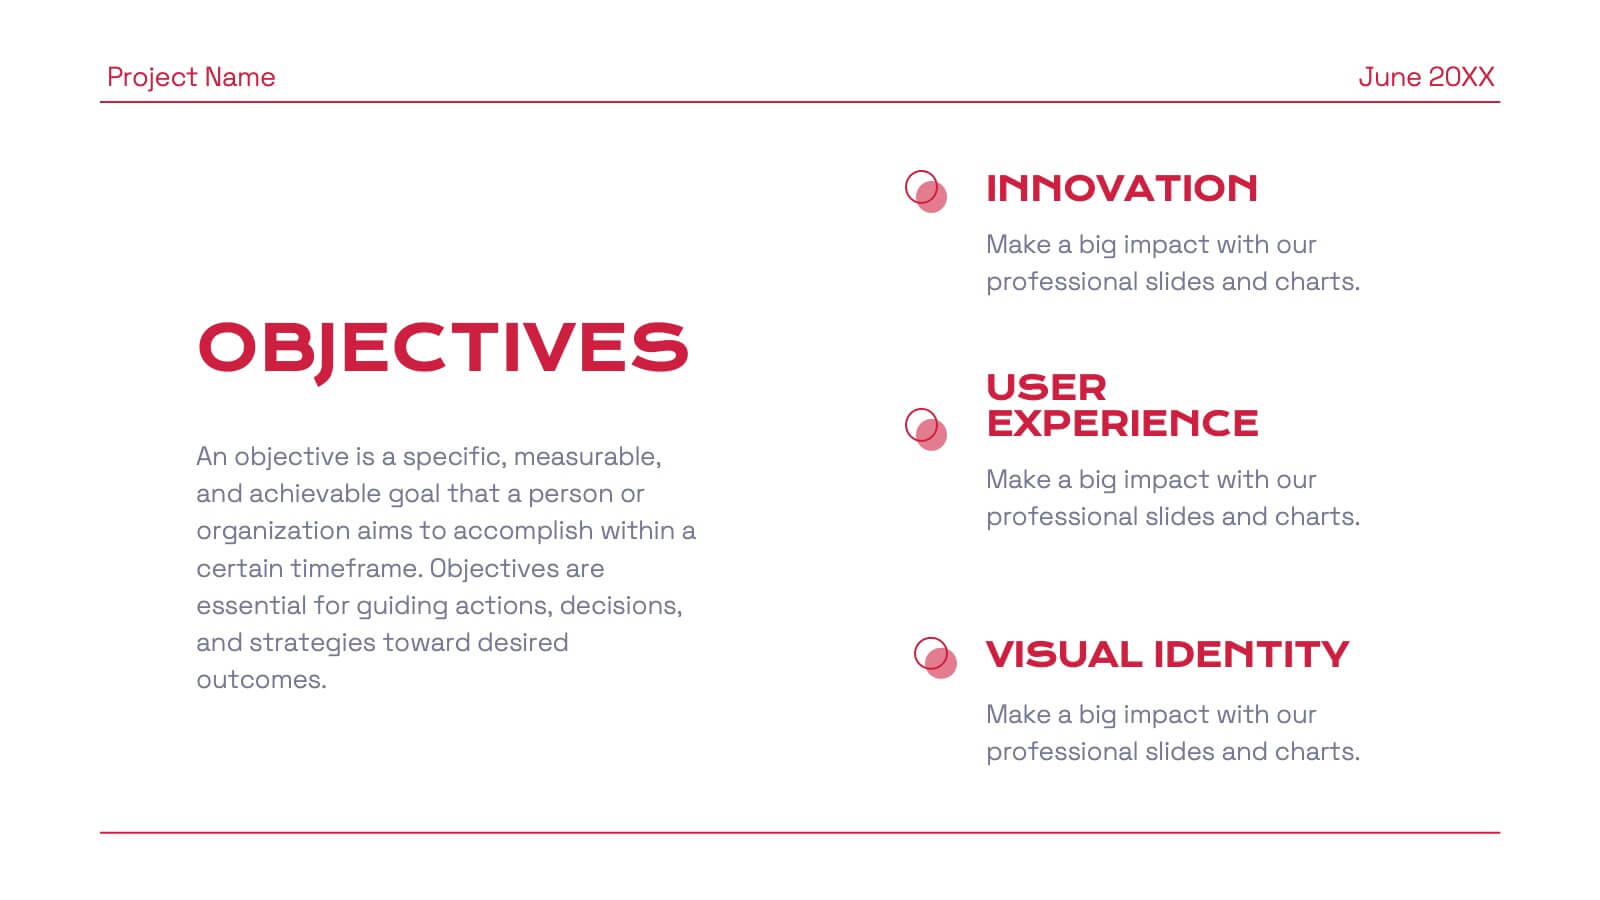
Eclipse Graphic Design Project Plan Presentation
Develop a winning marketing strategy with this dynamic template. Dive into current trends, consumer behavior, and innovative techniques. Perfect for social media, influencer marketing, and data-driven campaigns. Fully compatible with PowerPoint, Keynote, and Google Slides.


5 slides
Easy 4-Stage Development Process Presentation
Simplify complex processes with this clean, 4-step development diagram. Ideal for product lifecycles, workflows, or phased planning, this slide uses connected blocks and clear numbering to illustrate each stage. Fully editable in PowerPoint, Keynote, and Google Slides—perfect for project managers, engineers, and teams needing to communicate clear development strategies.


7 slides
Trading Cryptocurrency Infographic
The world of cryptocurrency is ever-evolving, and keeping track of trading insights is crucial. The trading cryptocurrency infographic offers a dynamic visualization of this digital currency realm. Using a vivid palette of white, red, and blue, it deciphers complex trading data into comprehensible visuals. Ideal for traders, financial analysts, and those new to the crypto market, this infographic serves as an essential guide to navigate the digital finance landscape. Its compatibility with PowerPoint, Keynote, and Google Slides ensures that presenting your trading insights has never been easier or more stylish.