


Features
- 23 Unique slides
- Fully editable and easy to edit in Microsoft Powerpoint, Keynote and Google Slides
- 16:9 widescreen layout
- Clean and professional designs
- Export to JPG, PDF or send by email


Do you have any questions?
Recommend


3 slides
Comprehensive Business Roadmap Strategy Presentation
Plan ahead with confidence using the Comprehensive Business Roadmap Strategy Presentation. This timeline-based slide is perfect for mapping out multi-quarter goals, initiatives, or project phases. Use the horizontal arrows to show overlapping tasks and strategic priorities by quarter. Ideal for project managers, team leads, and business strategists. Fully editable in PowerPoint, Keynote, Google Slides, and Canva.


22 slides
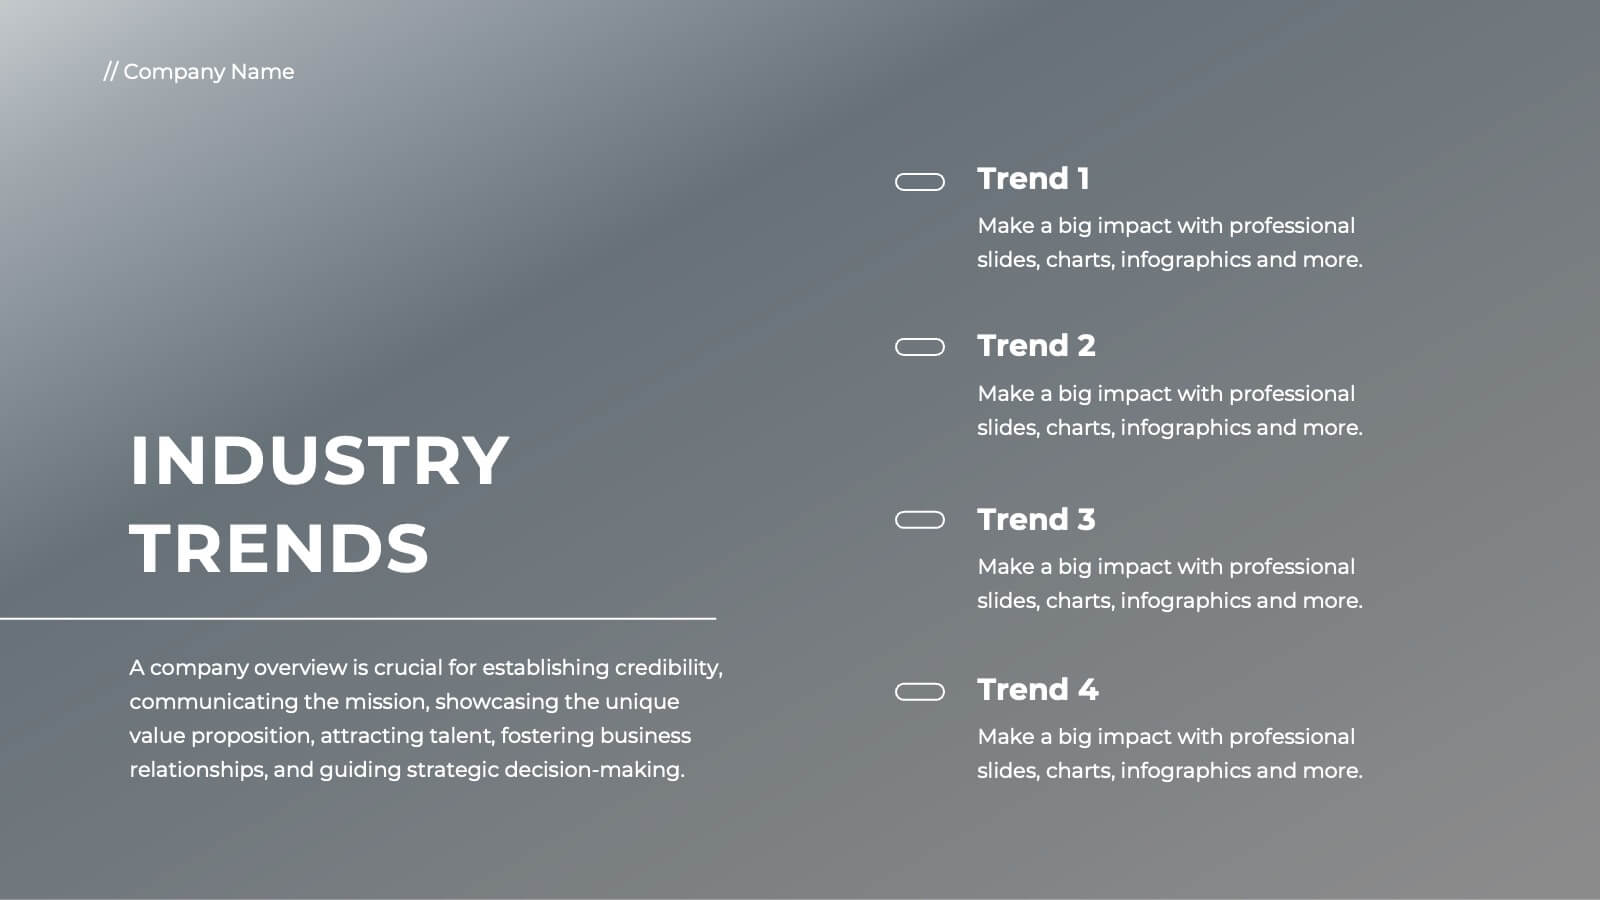
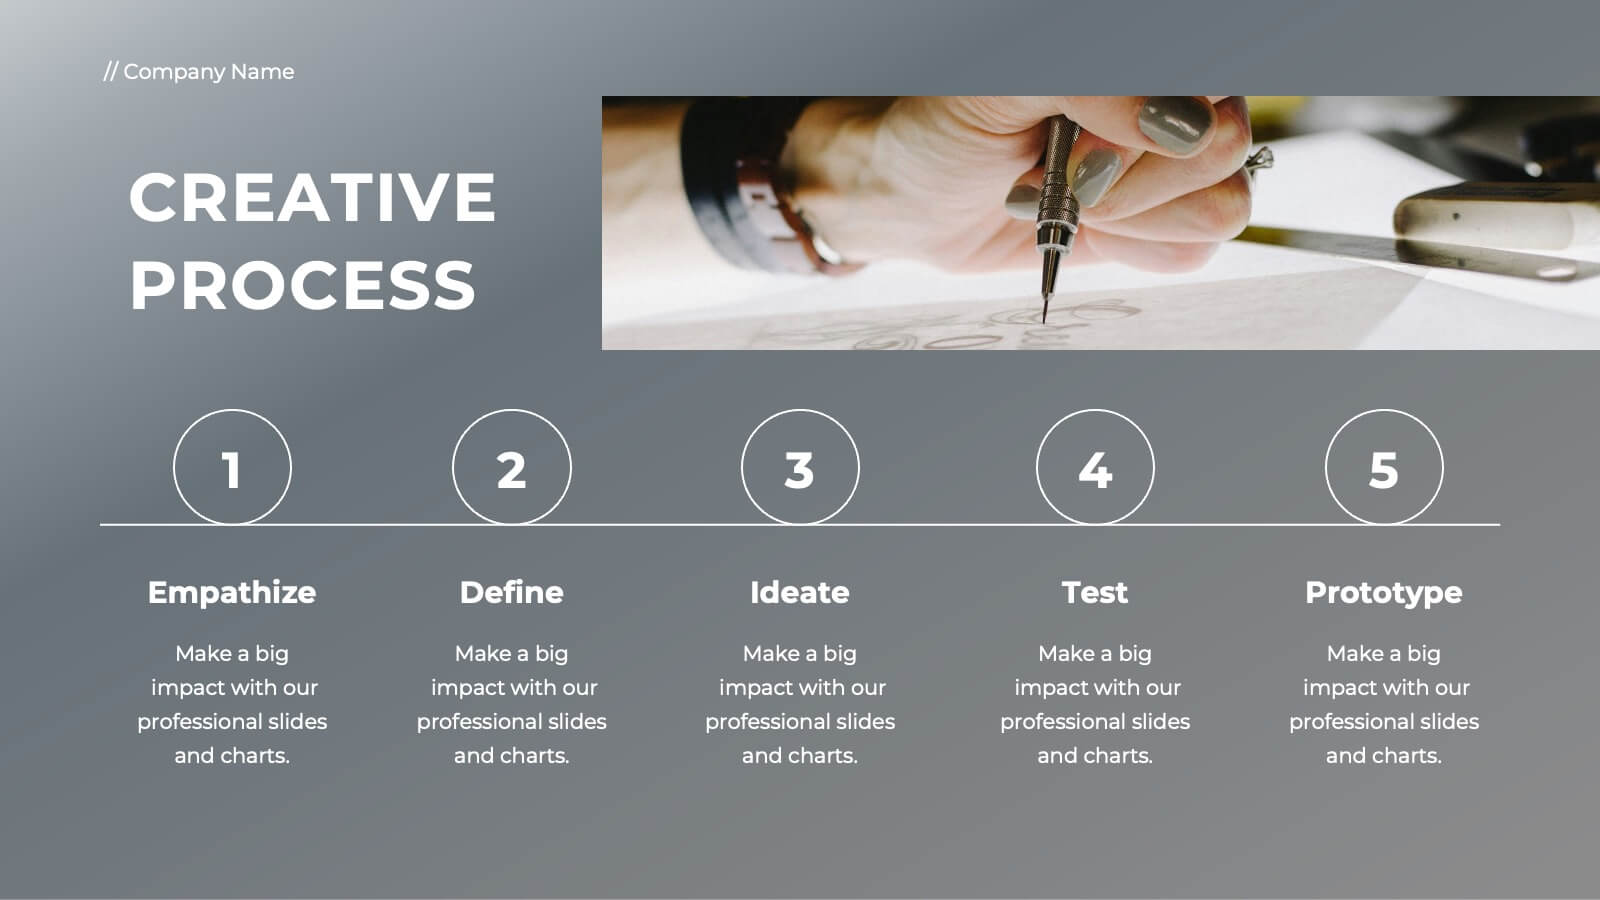
Nebulark Advertising Agency Proposal Presentation
An engaging proposal template designed for advertising agencies to showcase services, strategy, and client success stories. Features sections for mission, market analysis, creative processes, and partnership opportunities. Fully customizable and compatible with PowerPoint, Keynote, and Google Slides to craft compelling pitches and win over potential clients.


6 slides
Core Mission Vision Goals Presentation
Spark clarity and momentum with a clean, modern slide designed to showcase your organization’s purpose and future direction. This presentation highlights your core mission and vision in a visually engaging layout that keeps teams aligned and focused. Fully compatible with PowerPoint, Keynote, and Google Slides.


20 slides
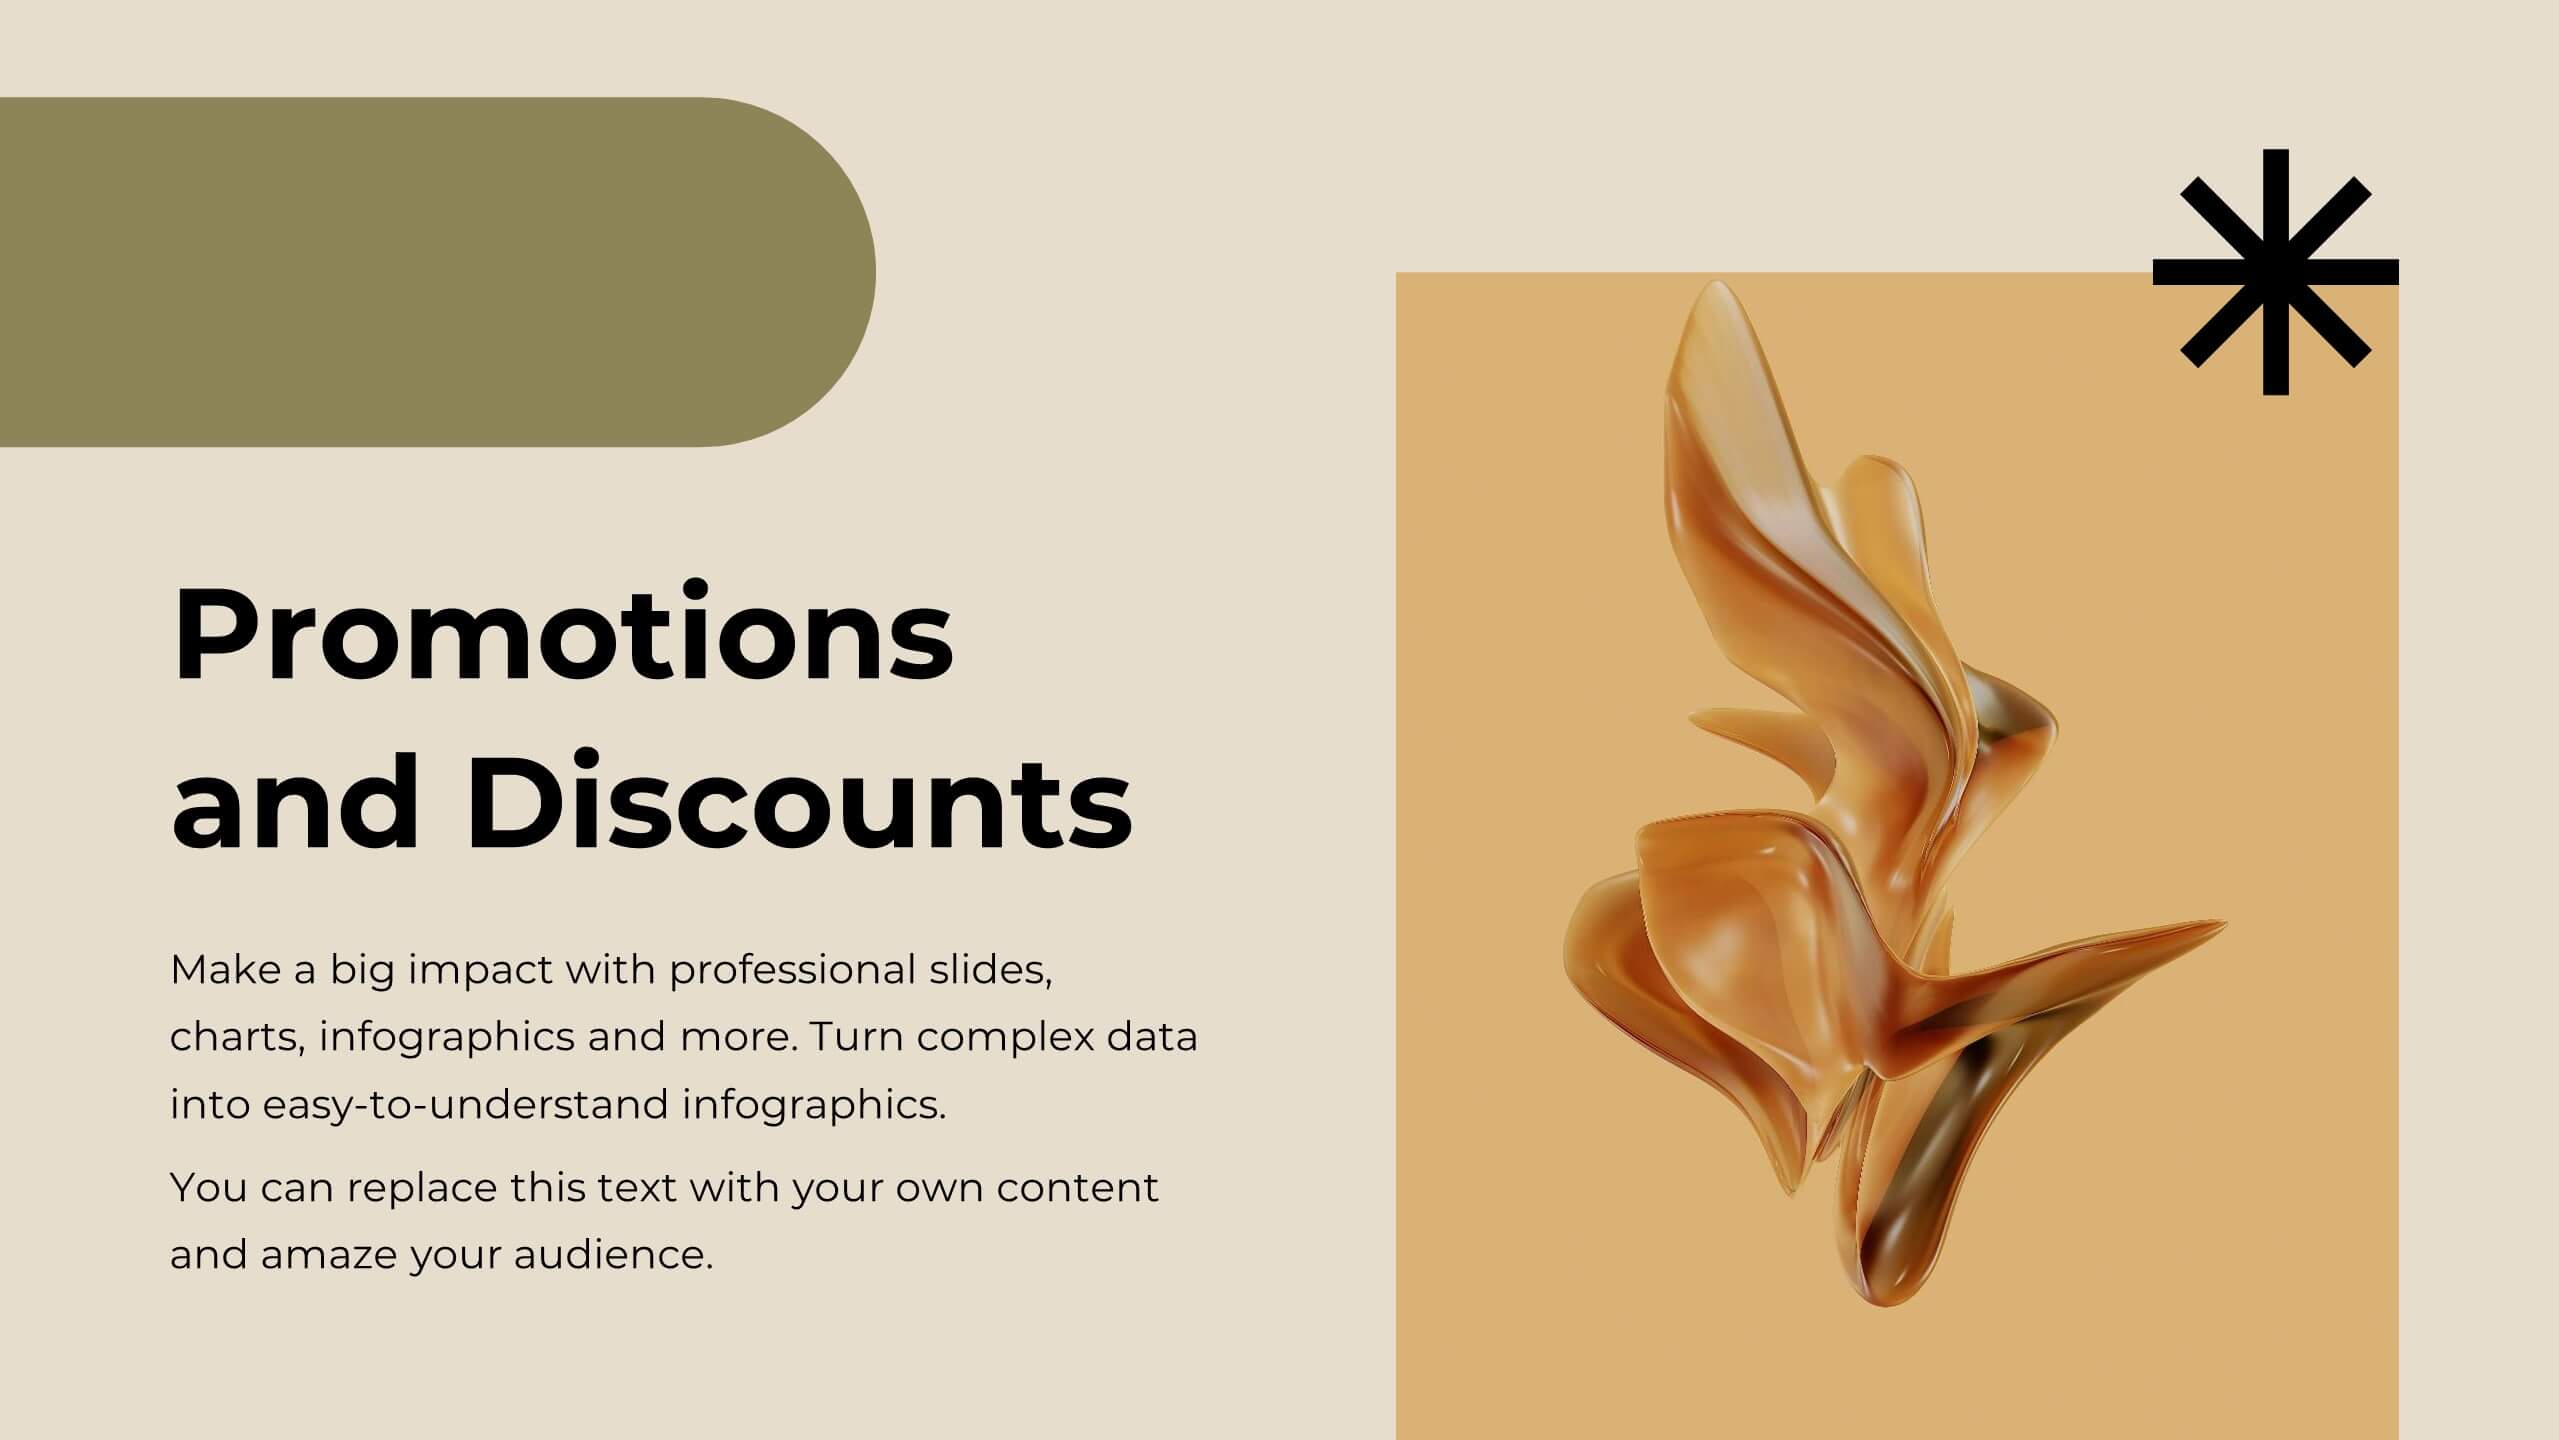
Creative Marketing Proposal Presentation
Elevate your business proposals with this sleek marketing proposal template, designed in dynamic purple tones. It comprehensively covers everything from company overview to pricing structures, making it perfect for detailing your marketing strategies effectively. Compatible with PowerPoint, Google Slides, and Keynote, it's ideal for professionals aiming to impress clients and secure projects.


23 slides
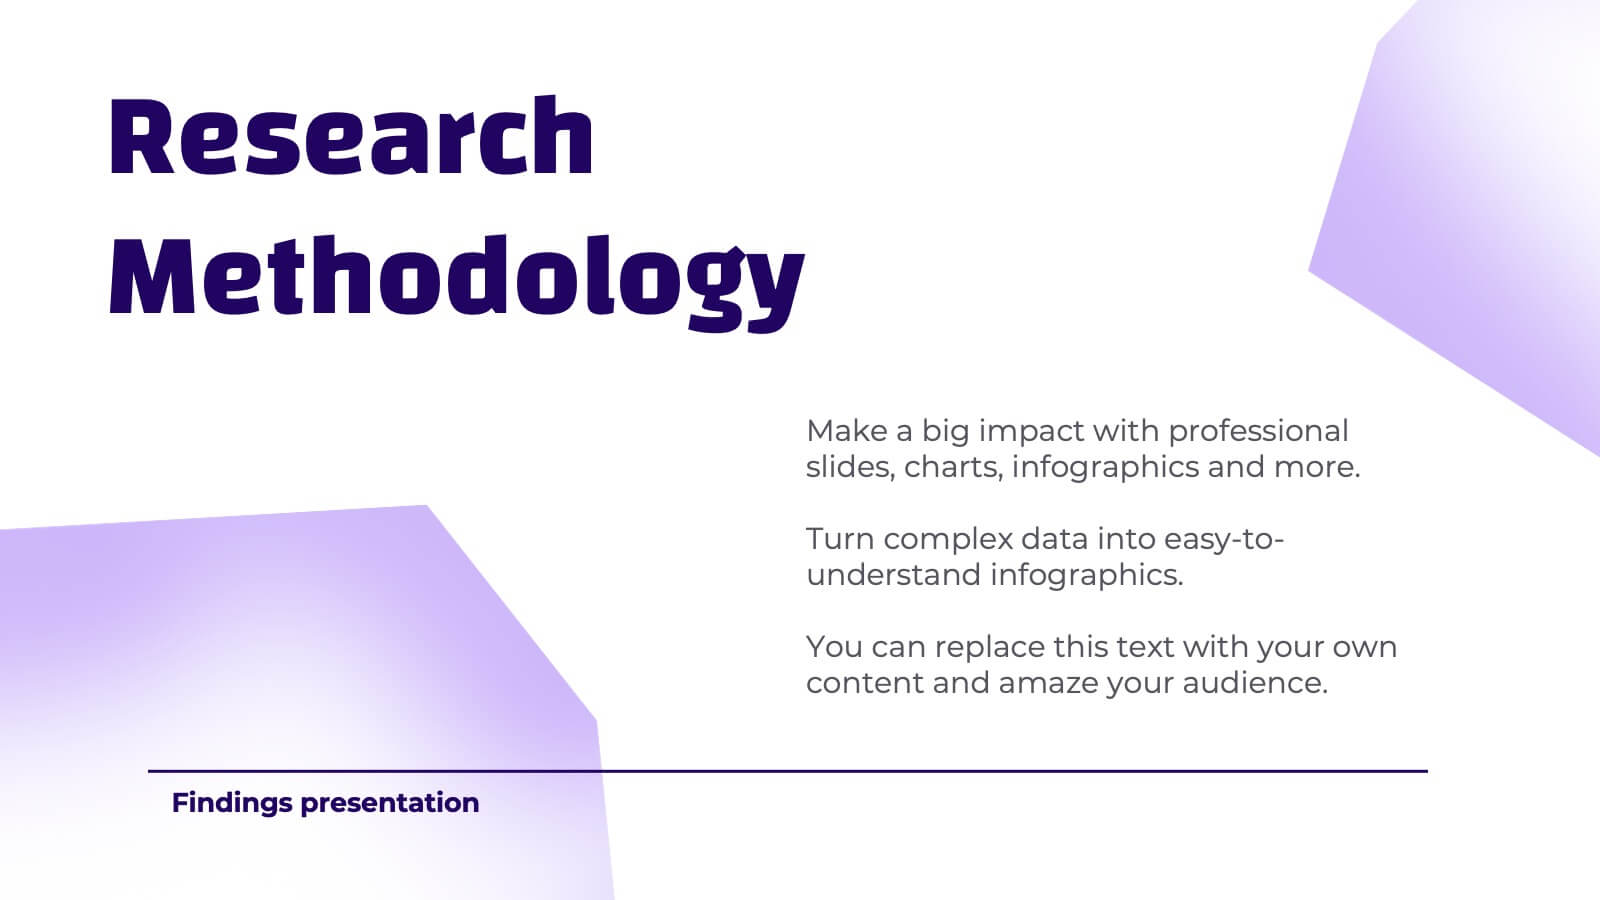
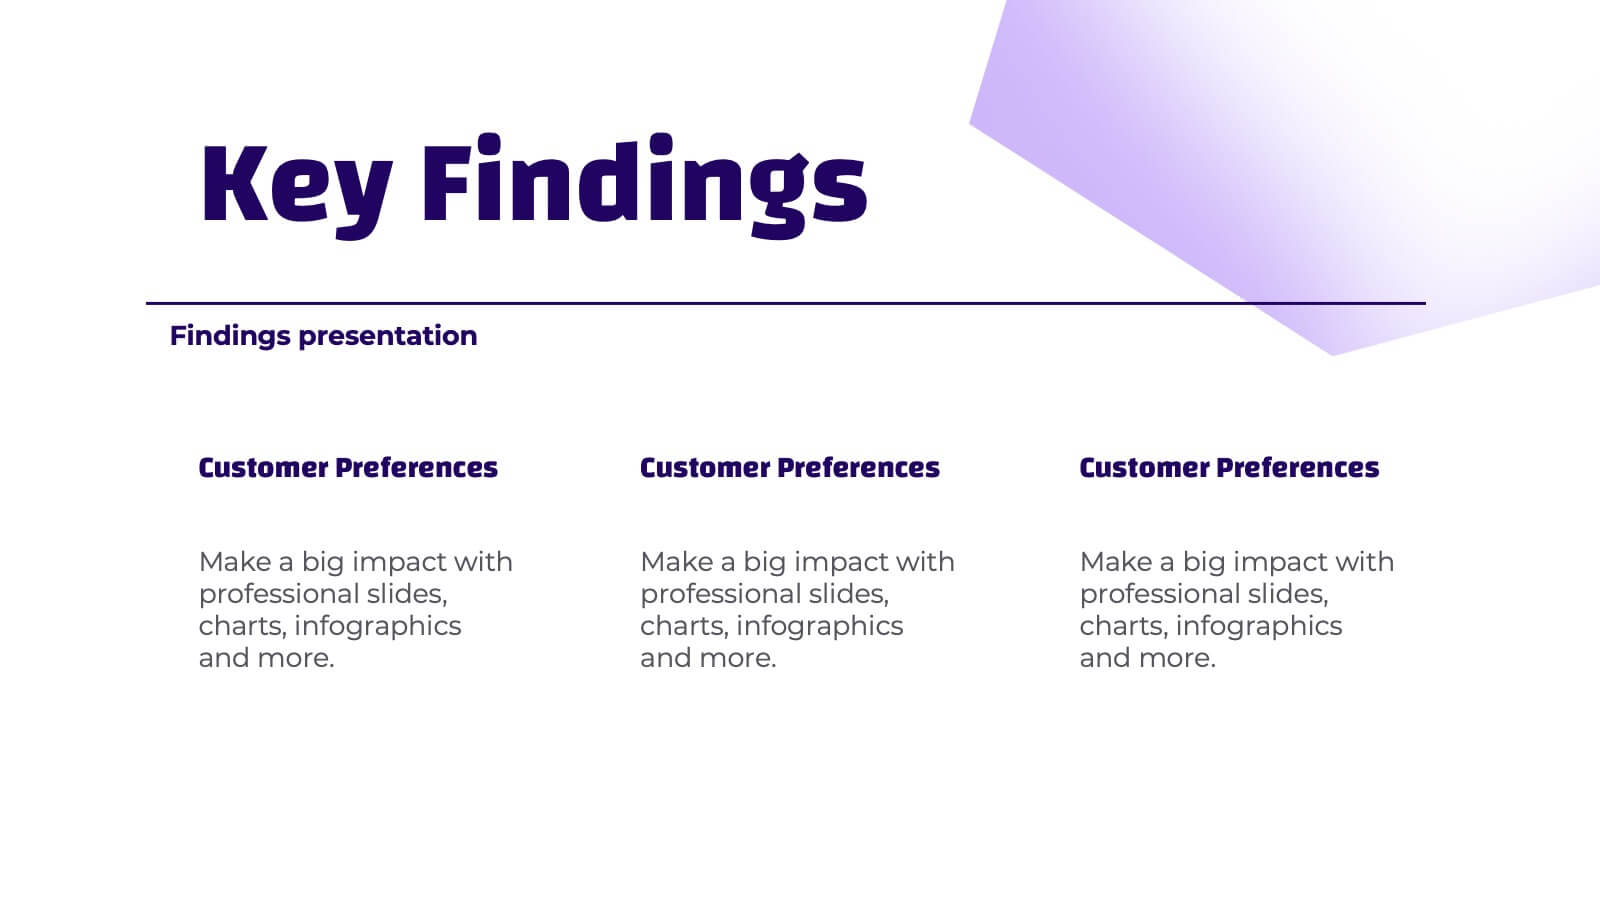
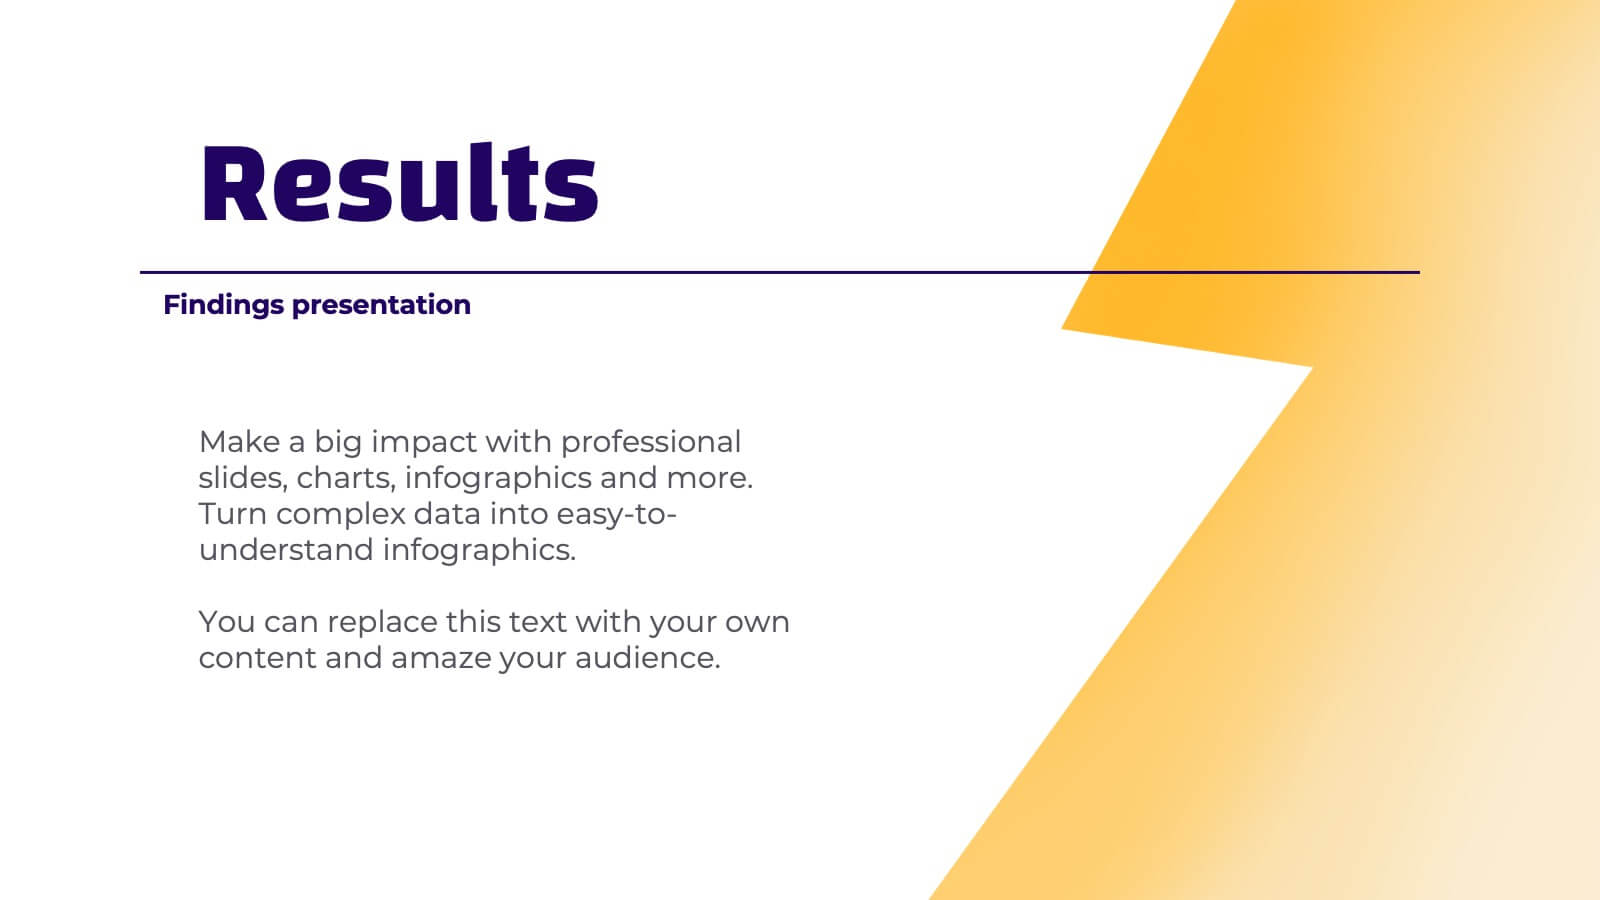
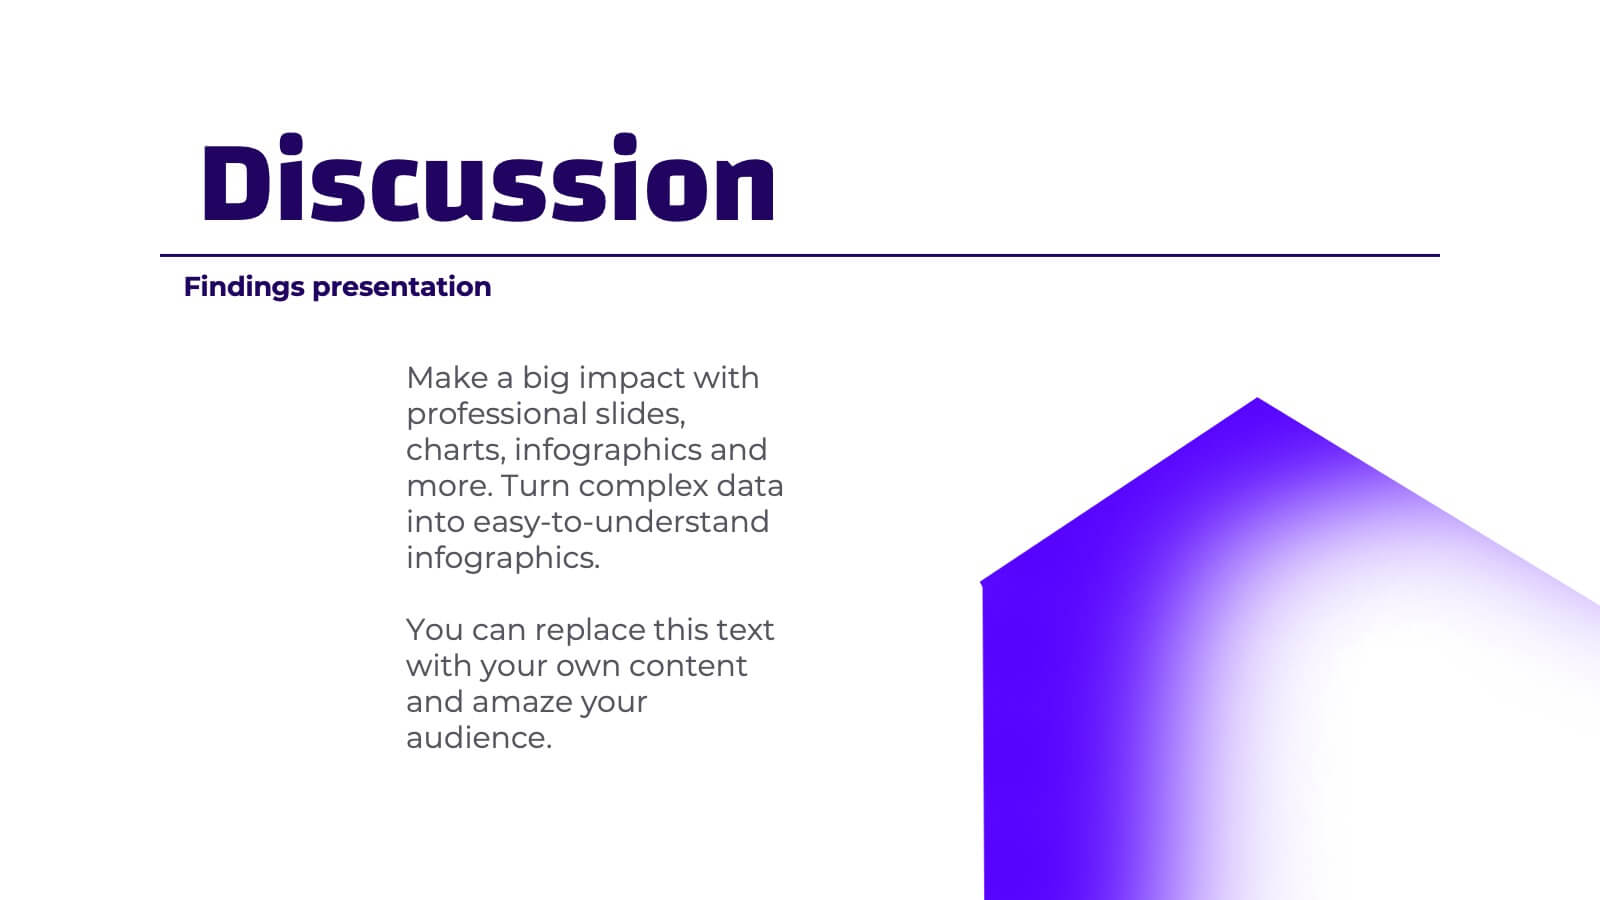
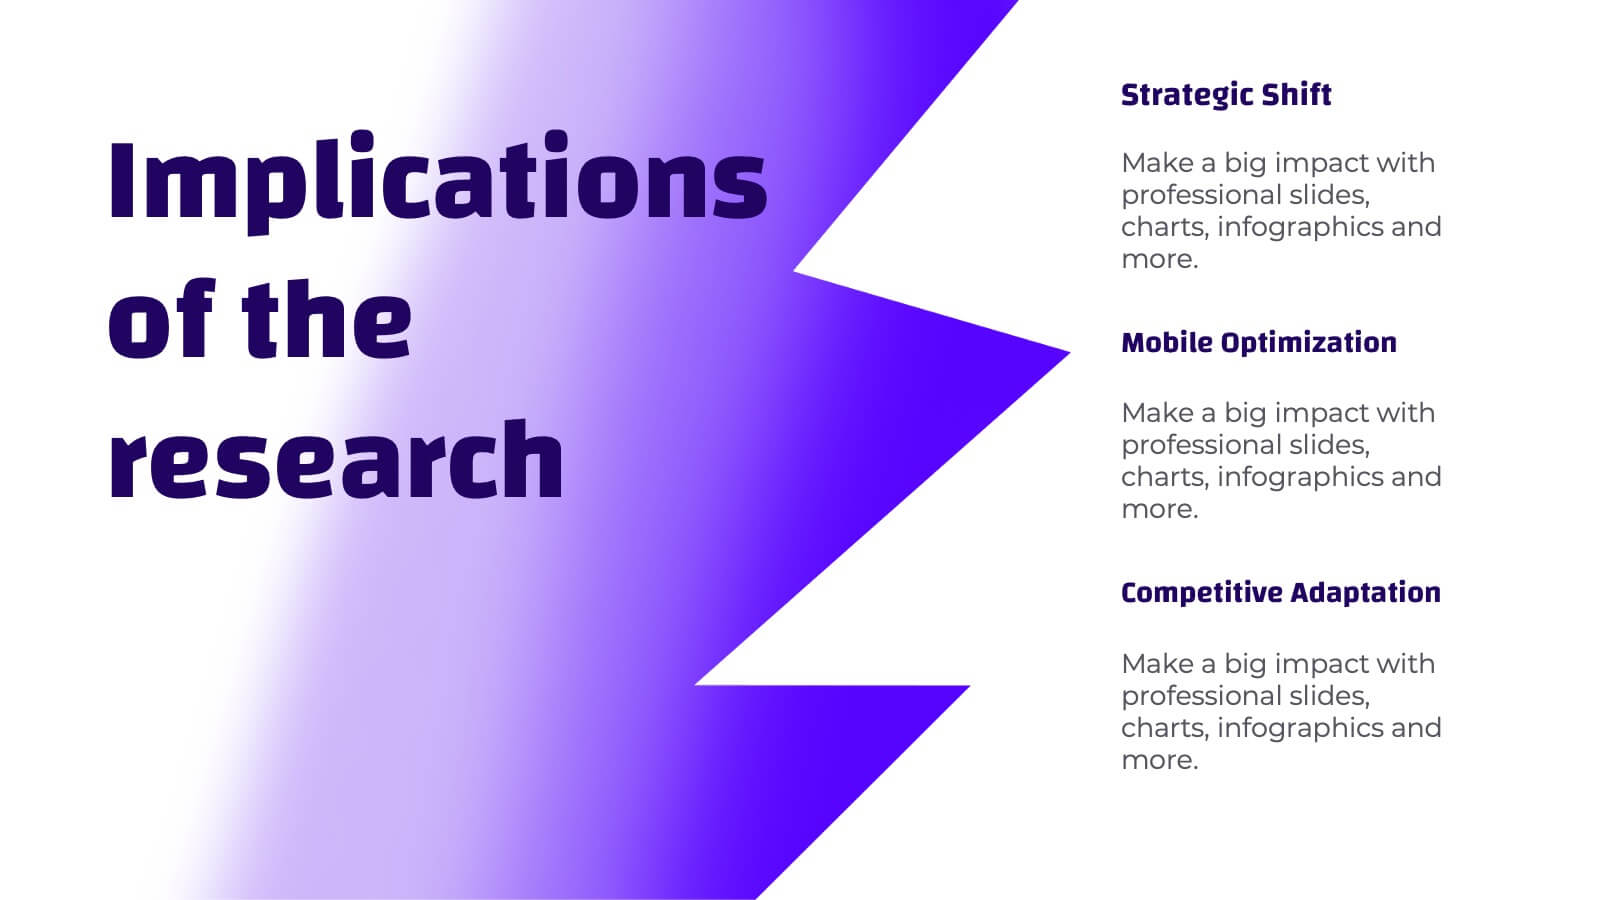
Naiad Qualitative Research Findings Presentation
Dive into your data with this refreshing, Naiad-inspired presentation template, perfect for sharing qualitative research findings! Designed to showcase insights, trends, and key conclusions with clarity, this visually appealing layout ensures your research captivates and informs. Make your data flow effortlessly. Compatible with PowerPoint, Keynote, and Google Slides for easy customization.

20 slides
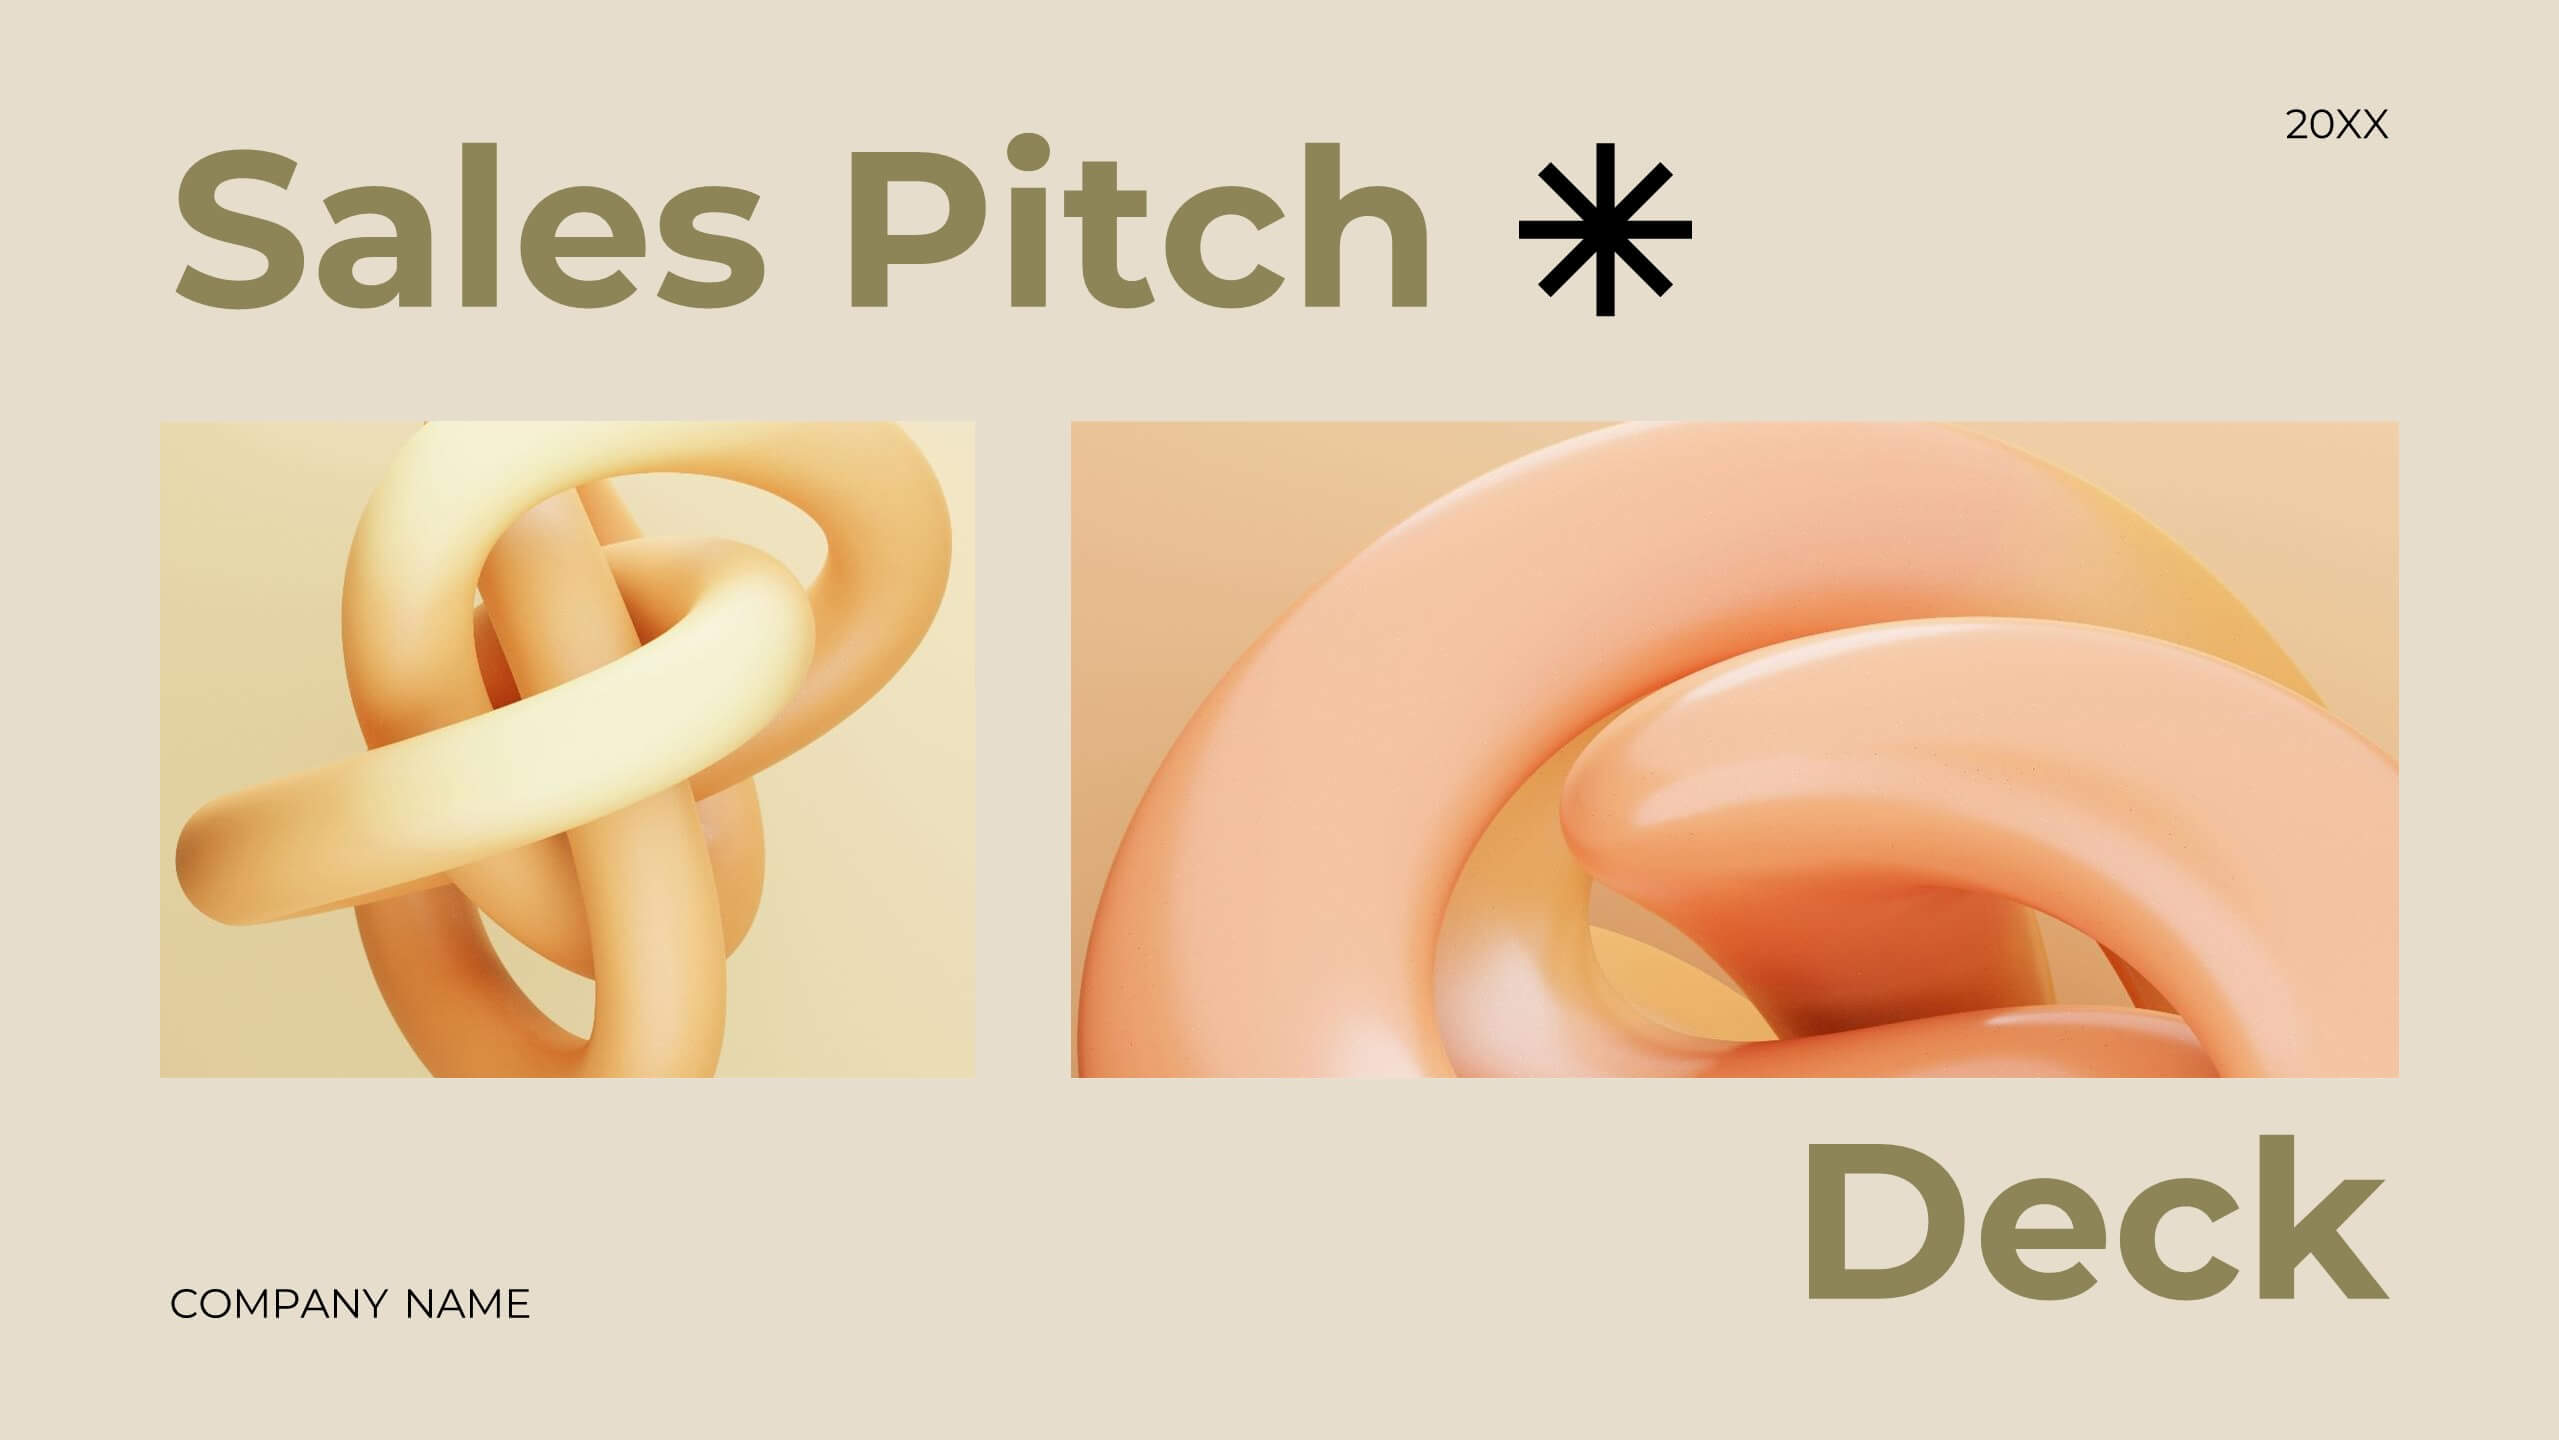
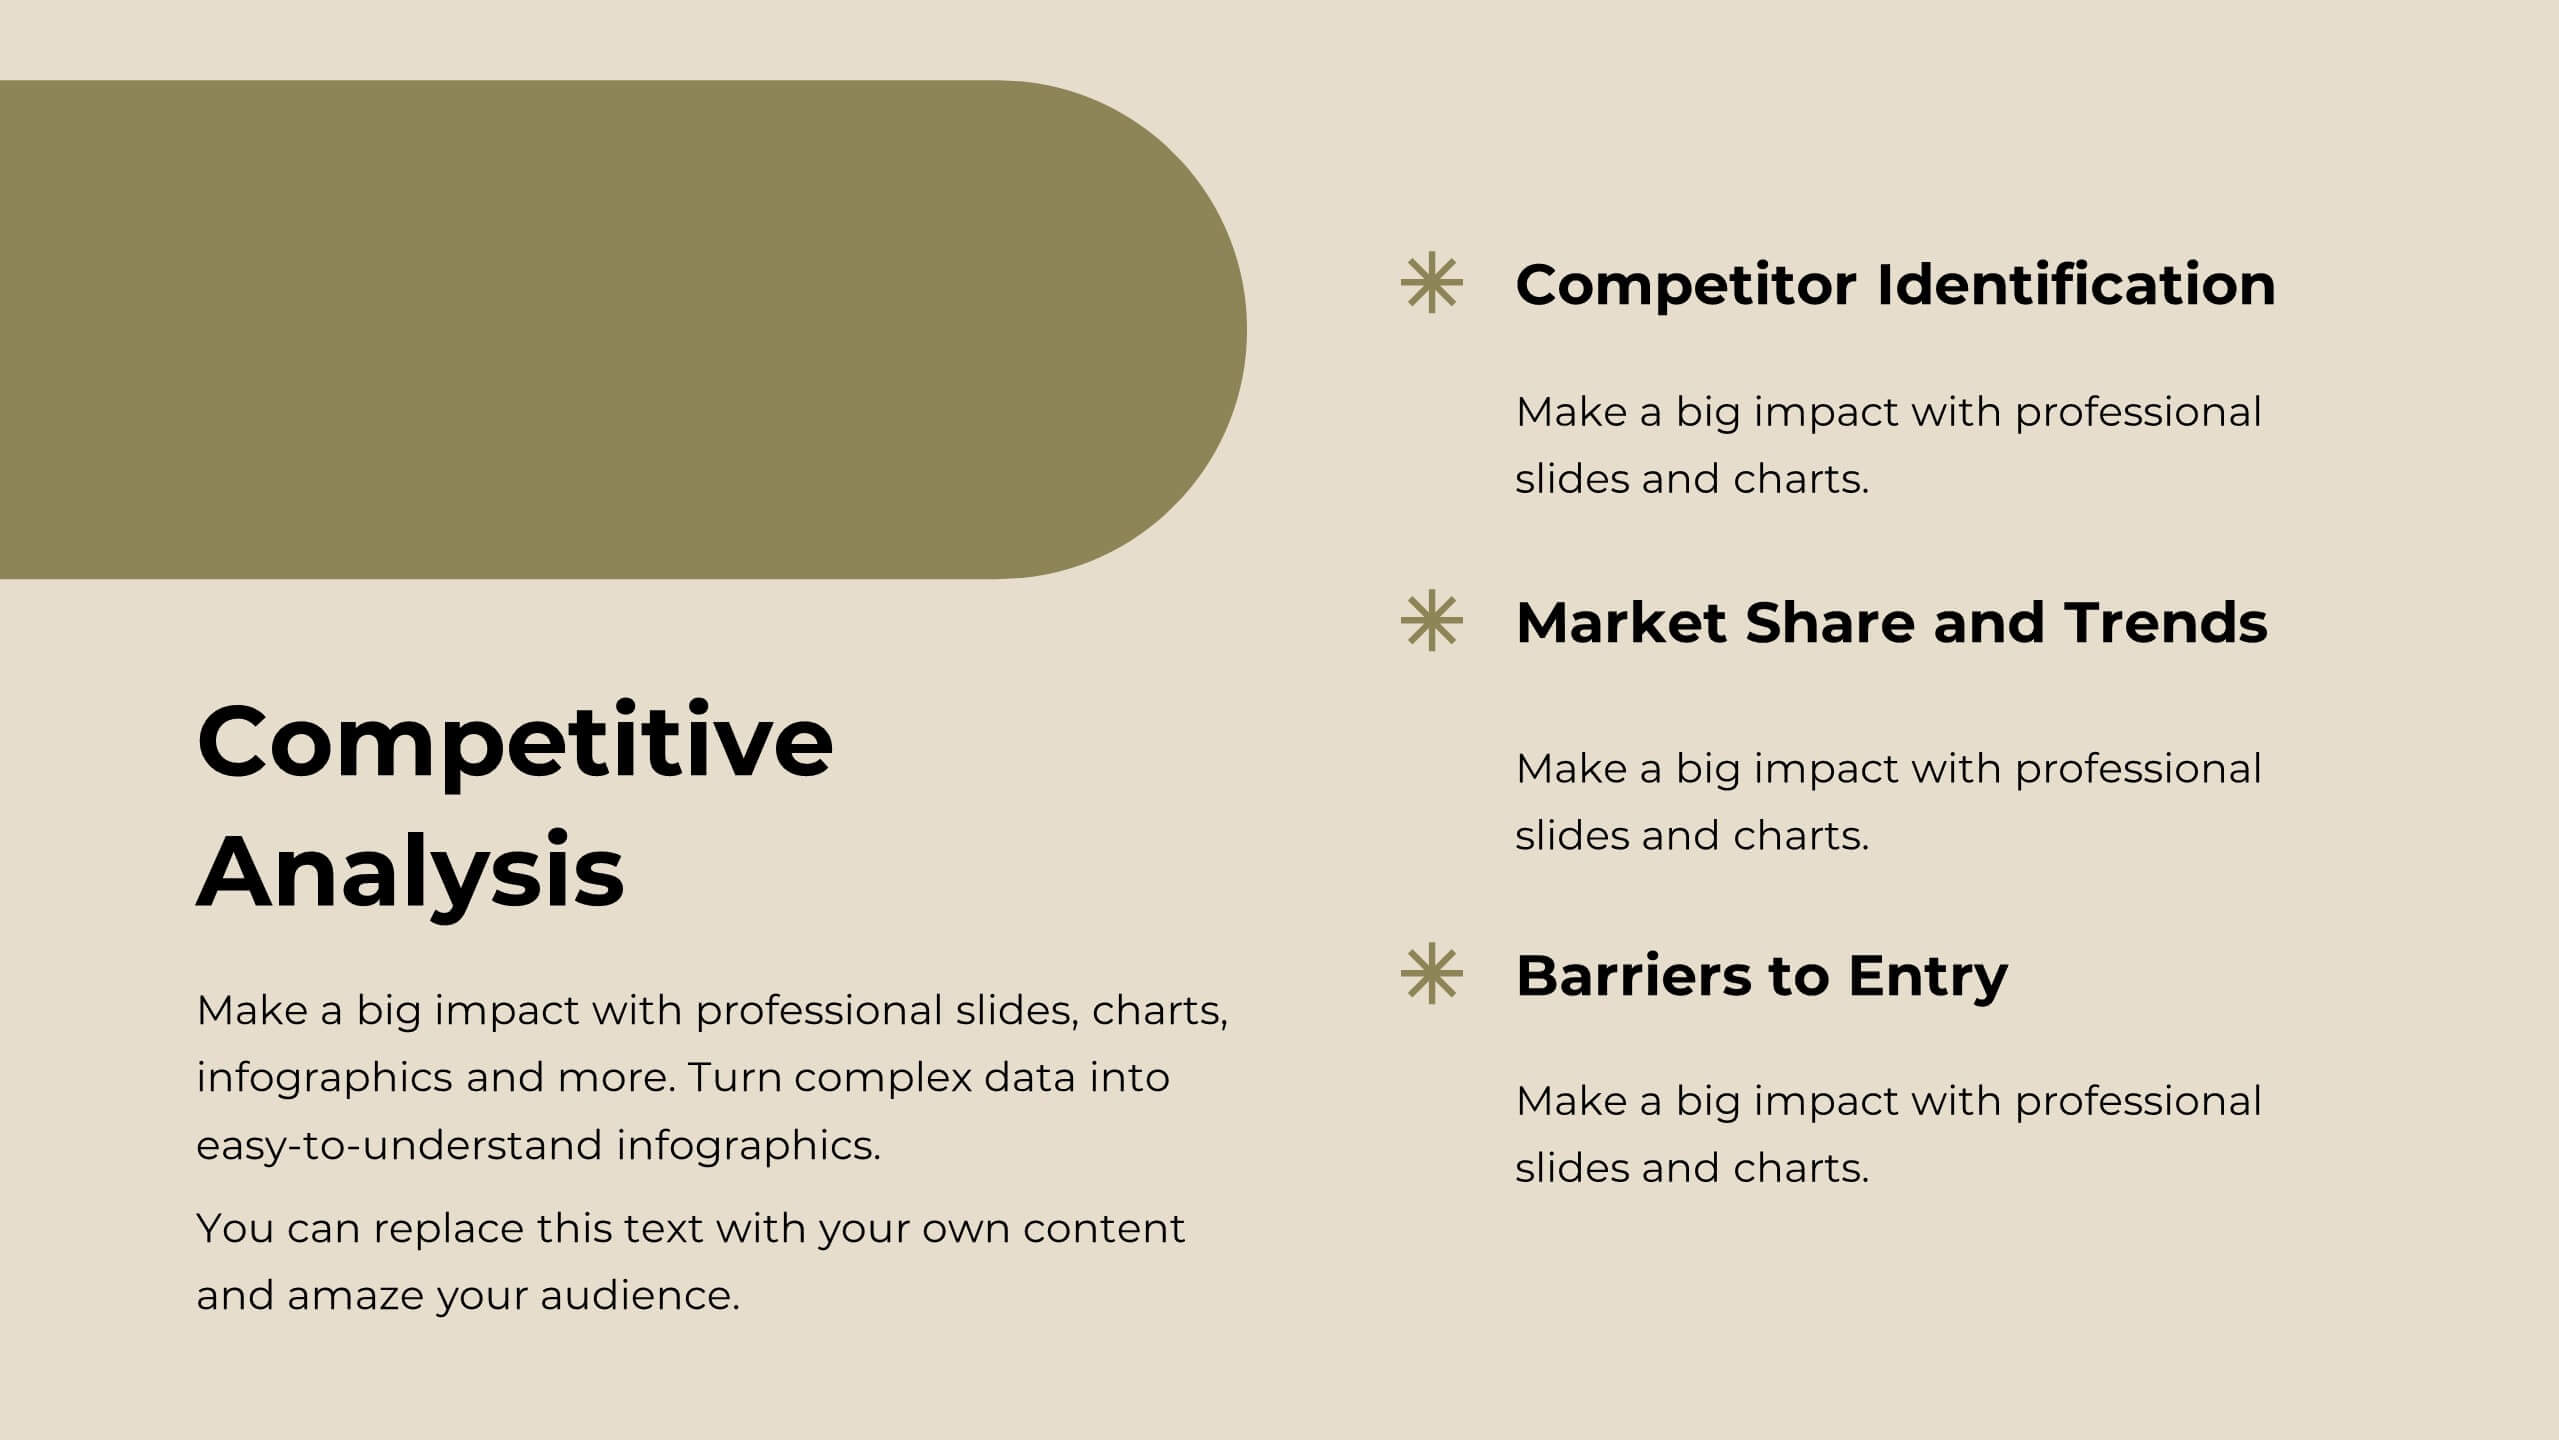
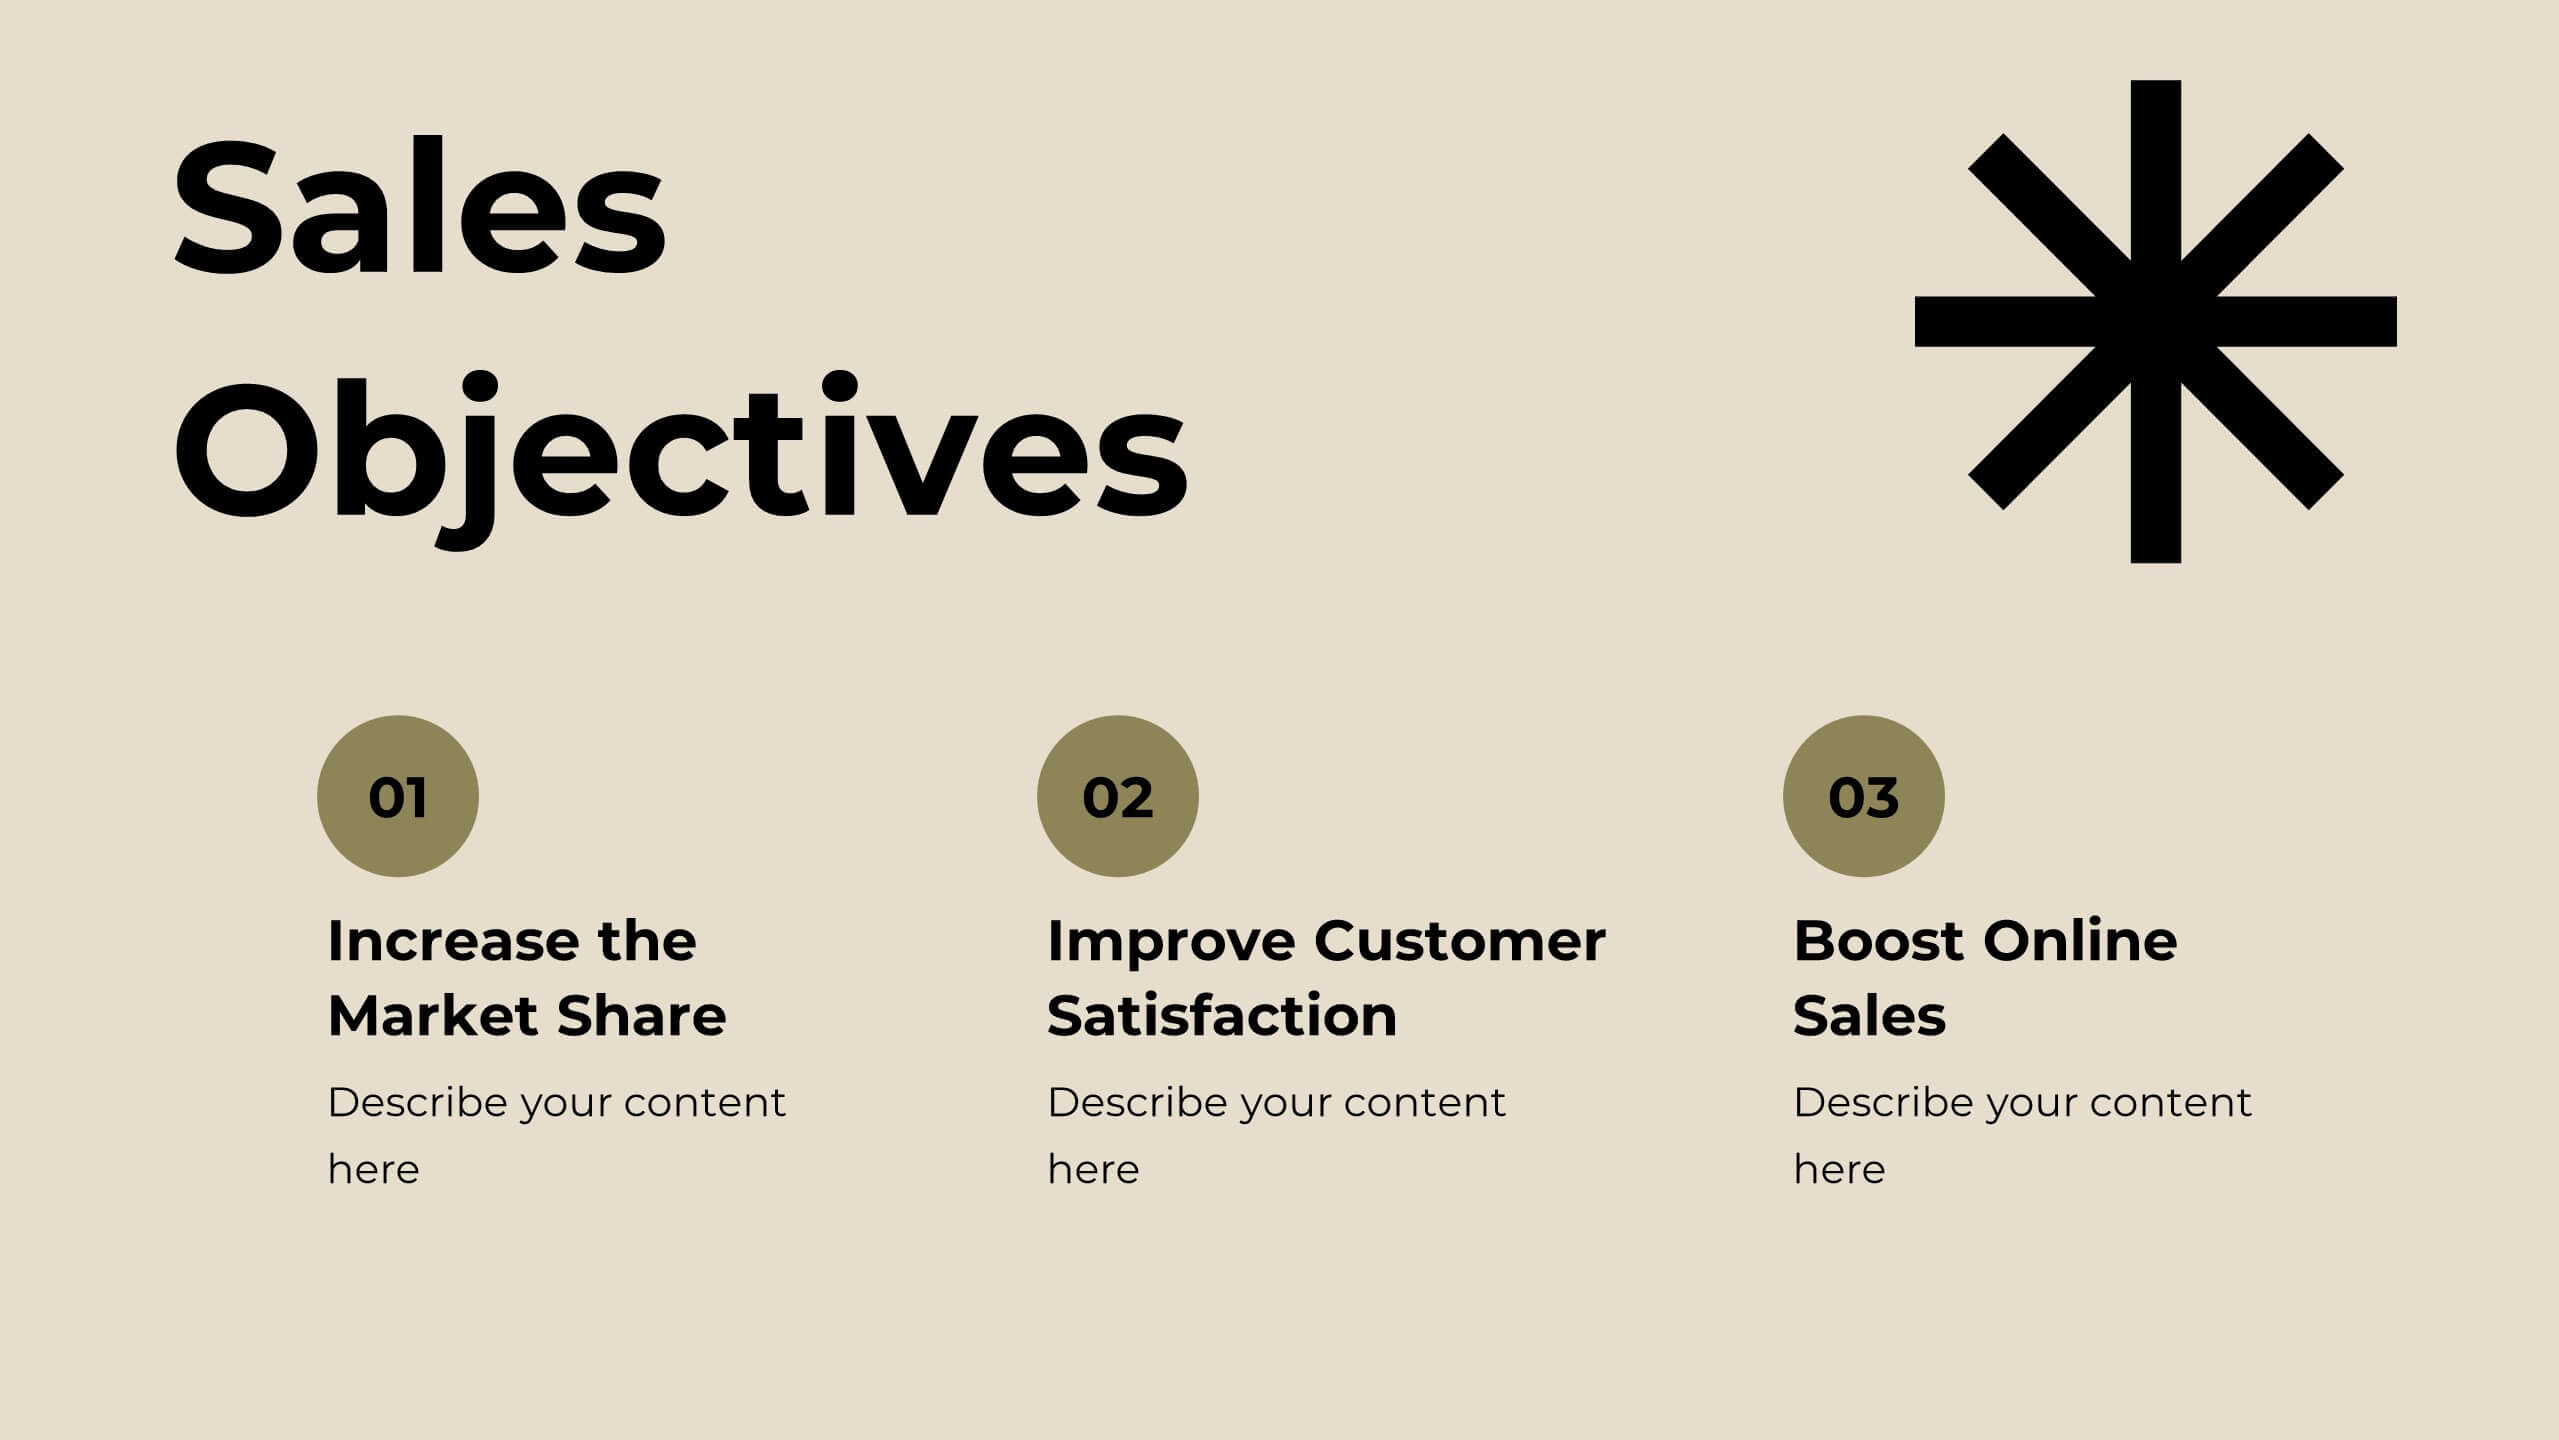
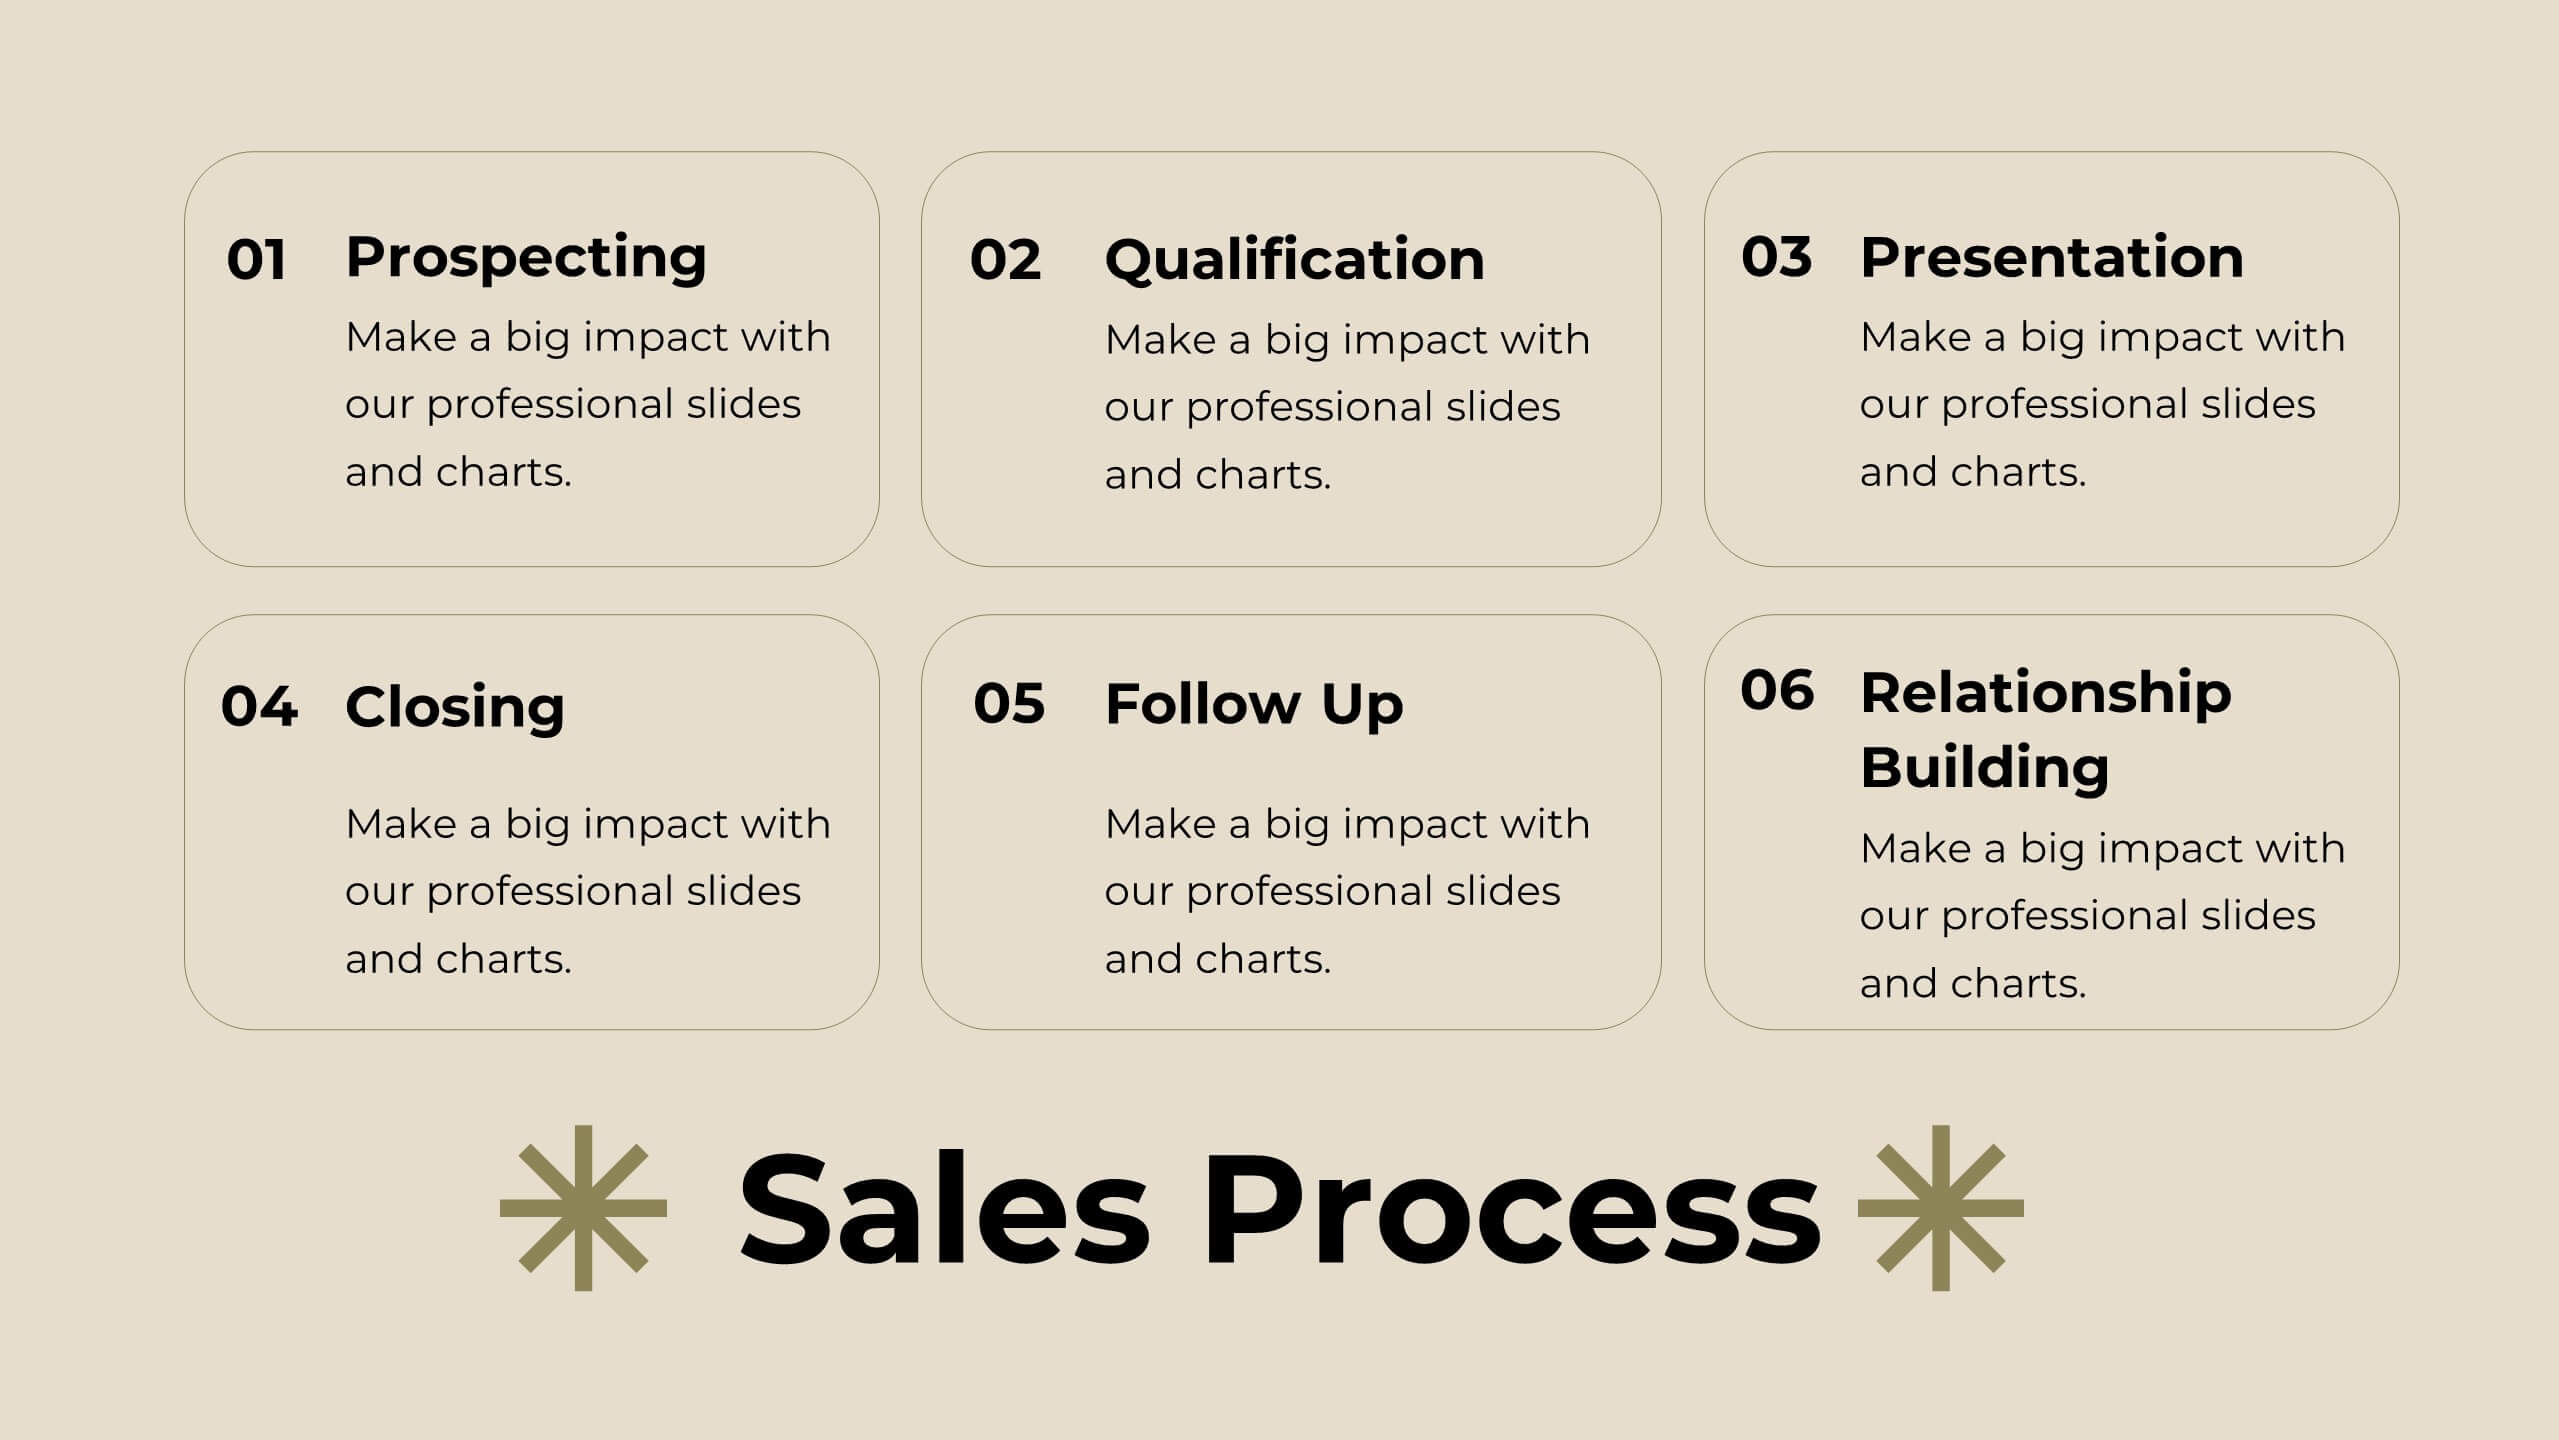
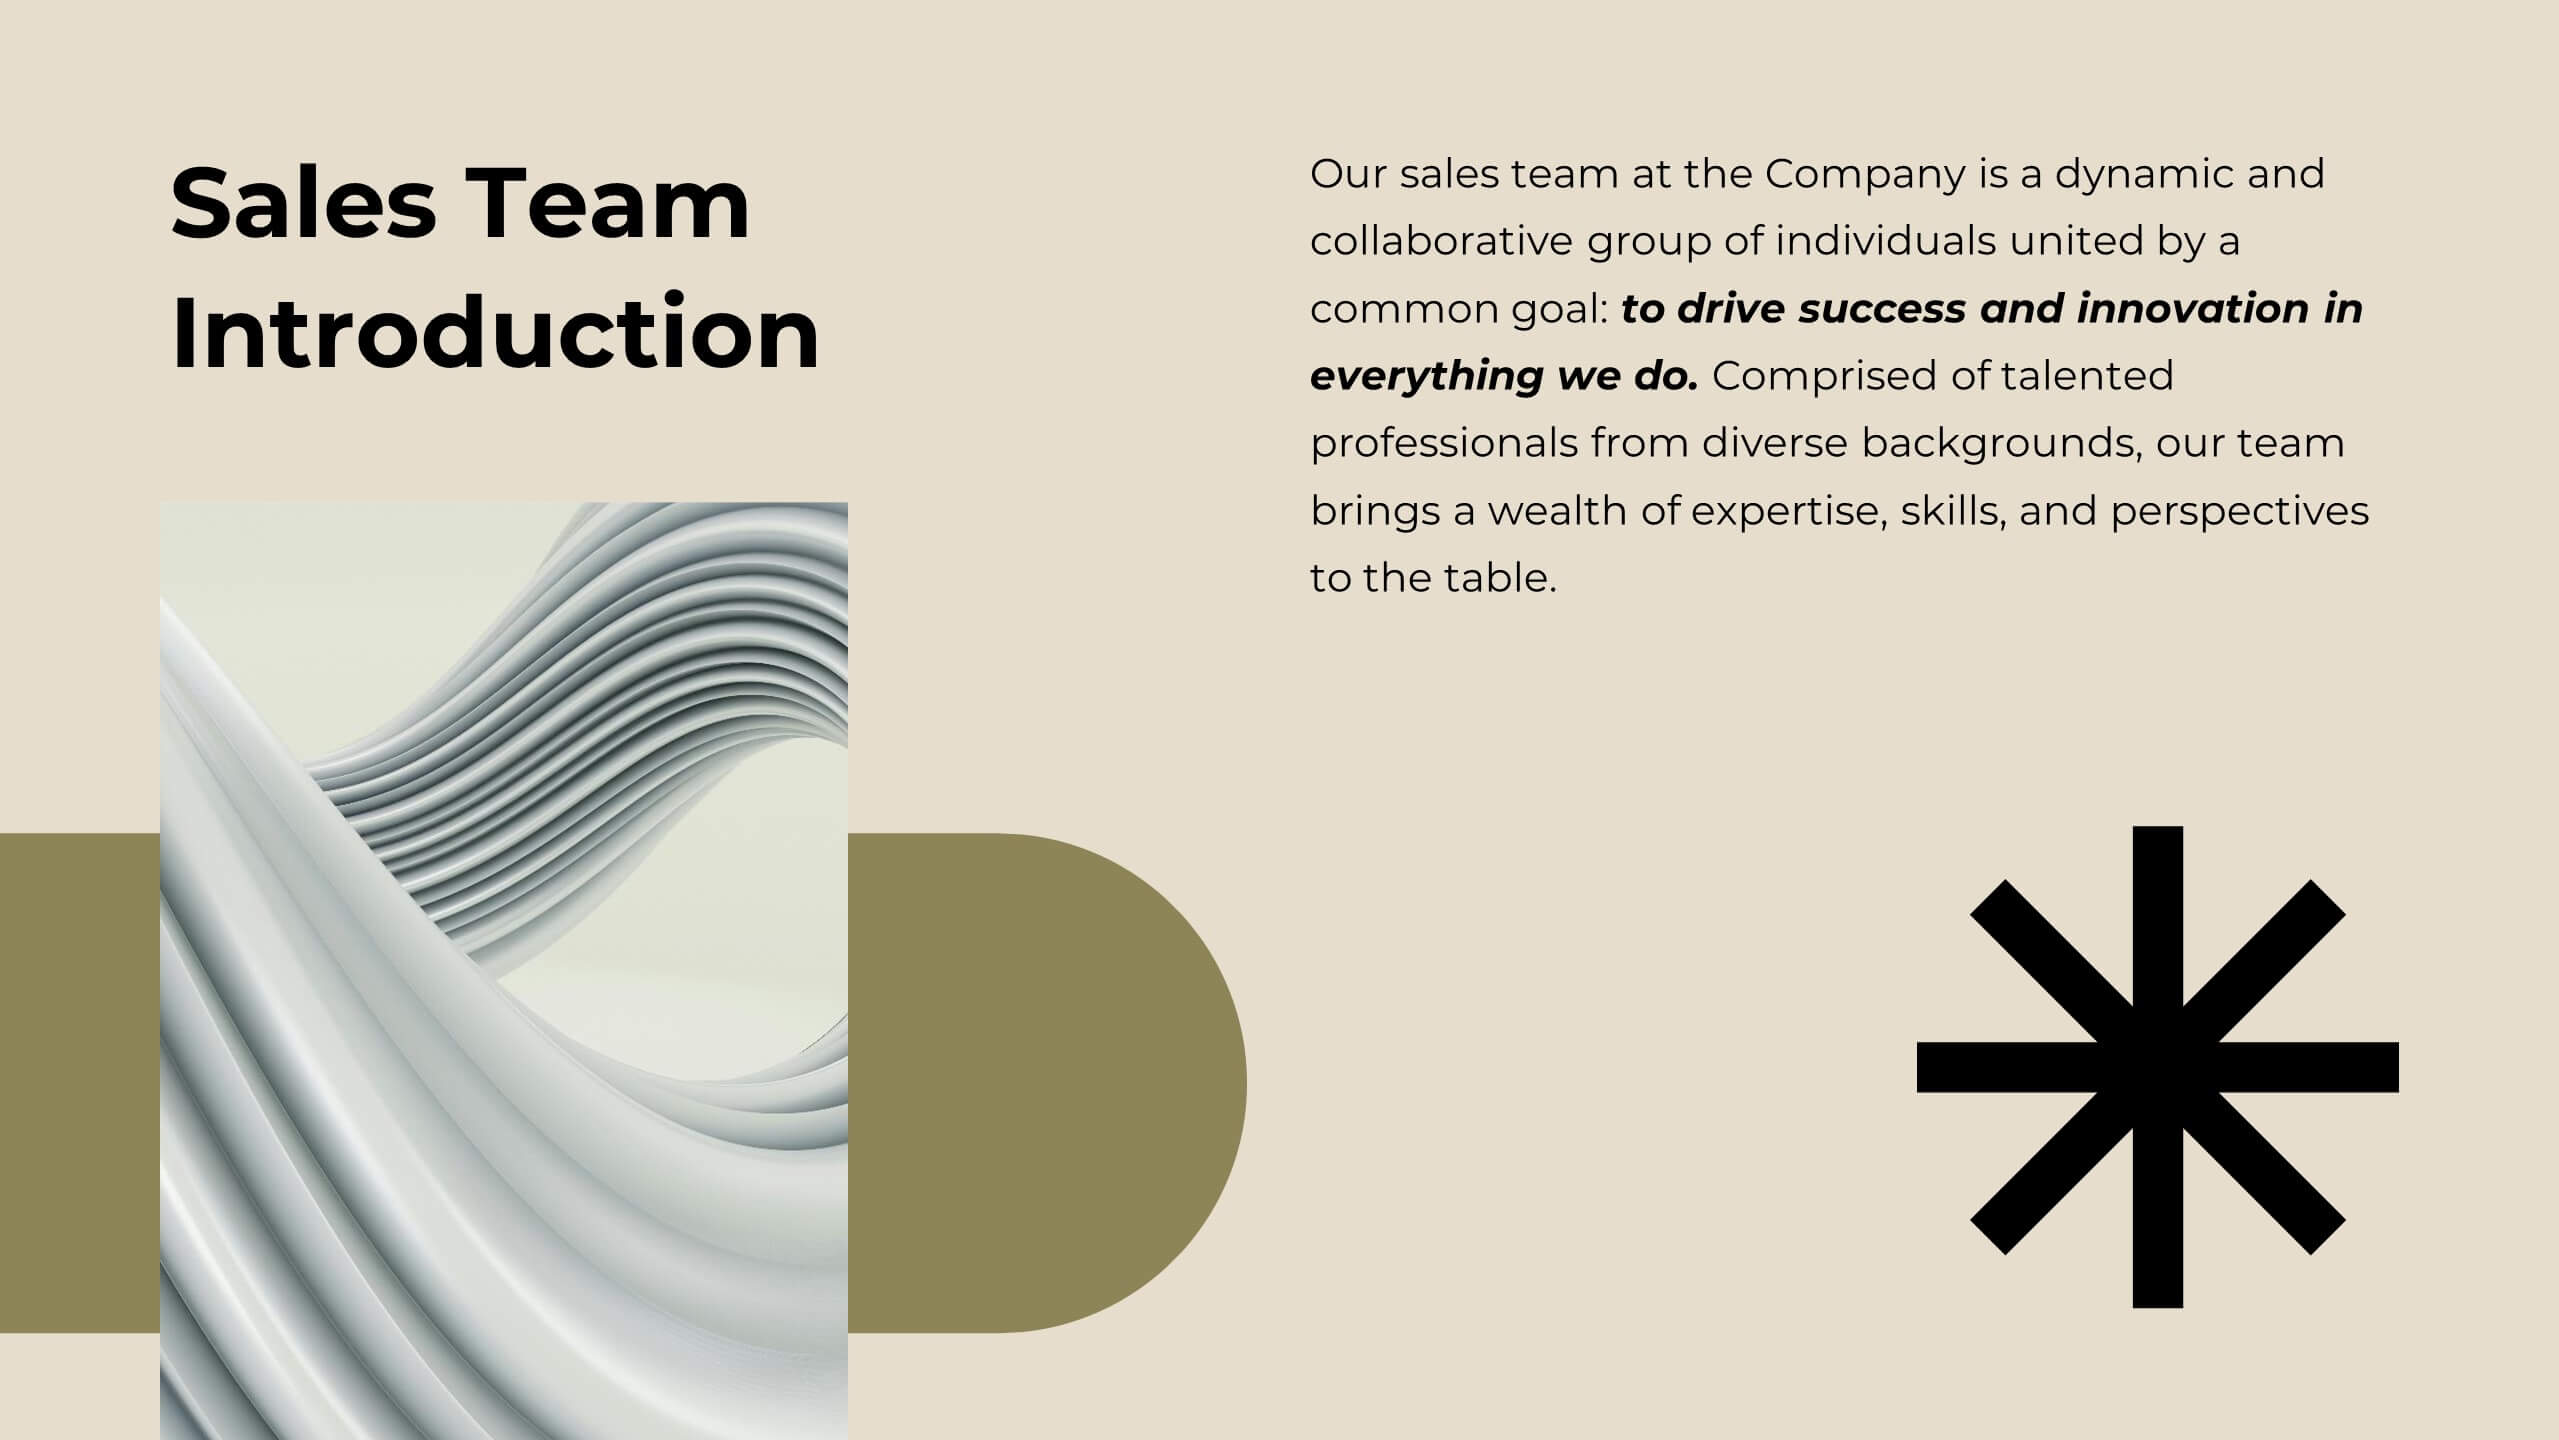
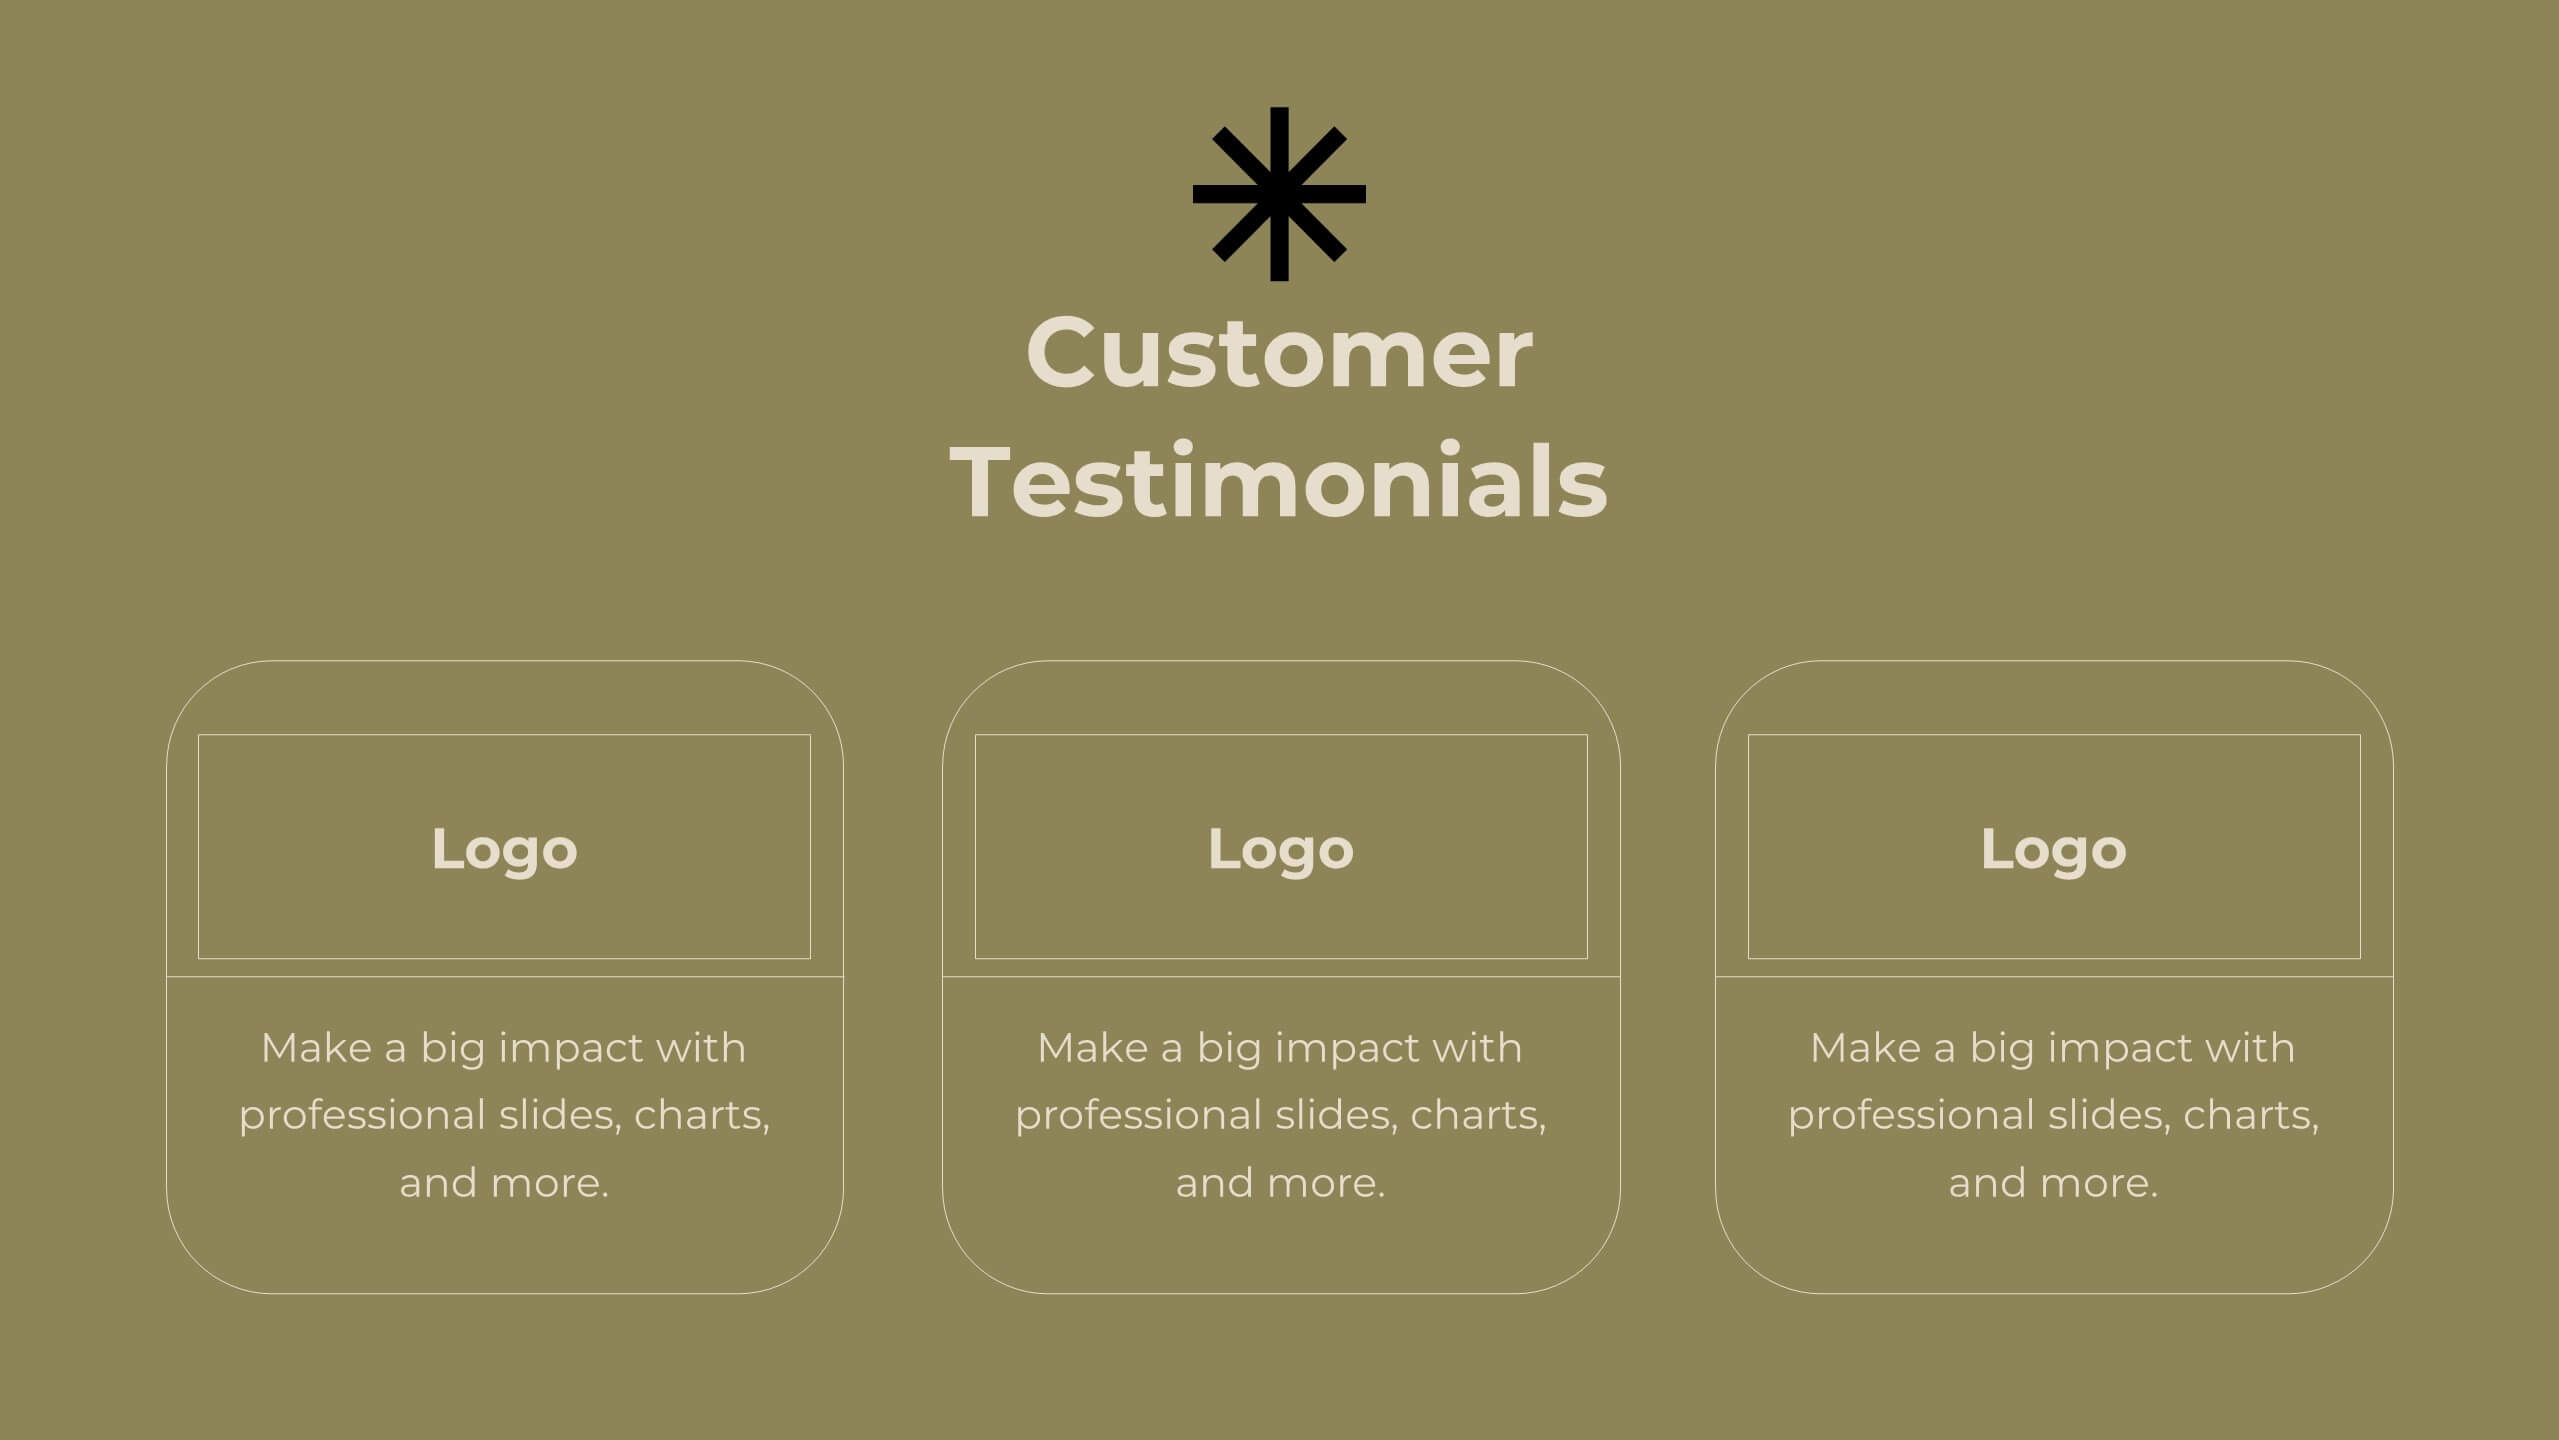
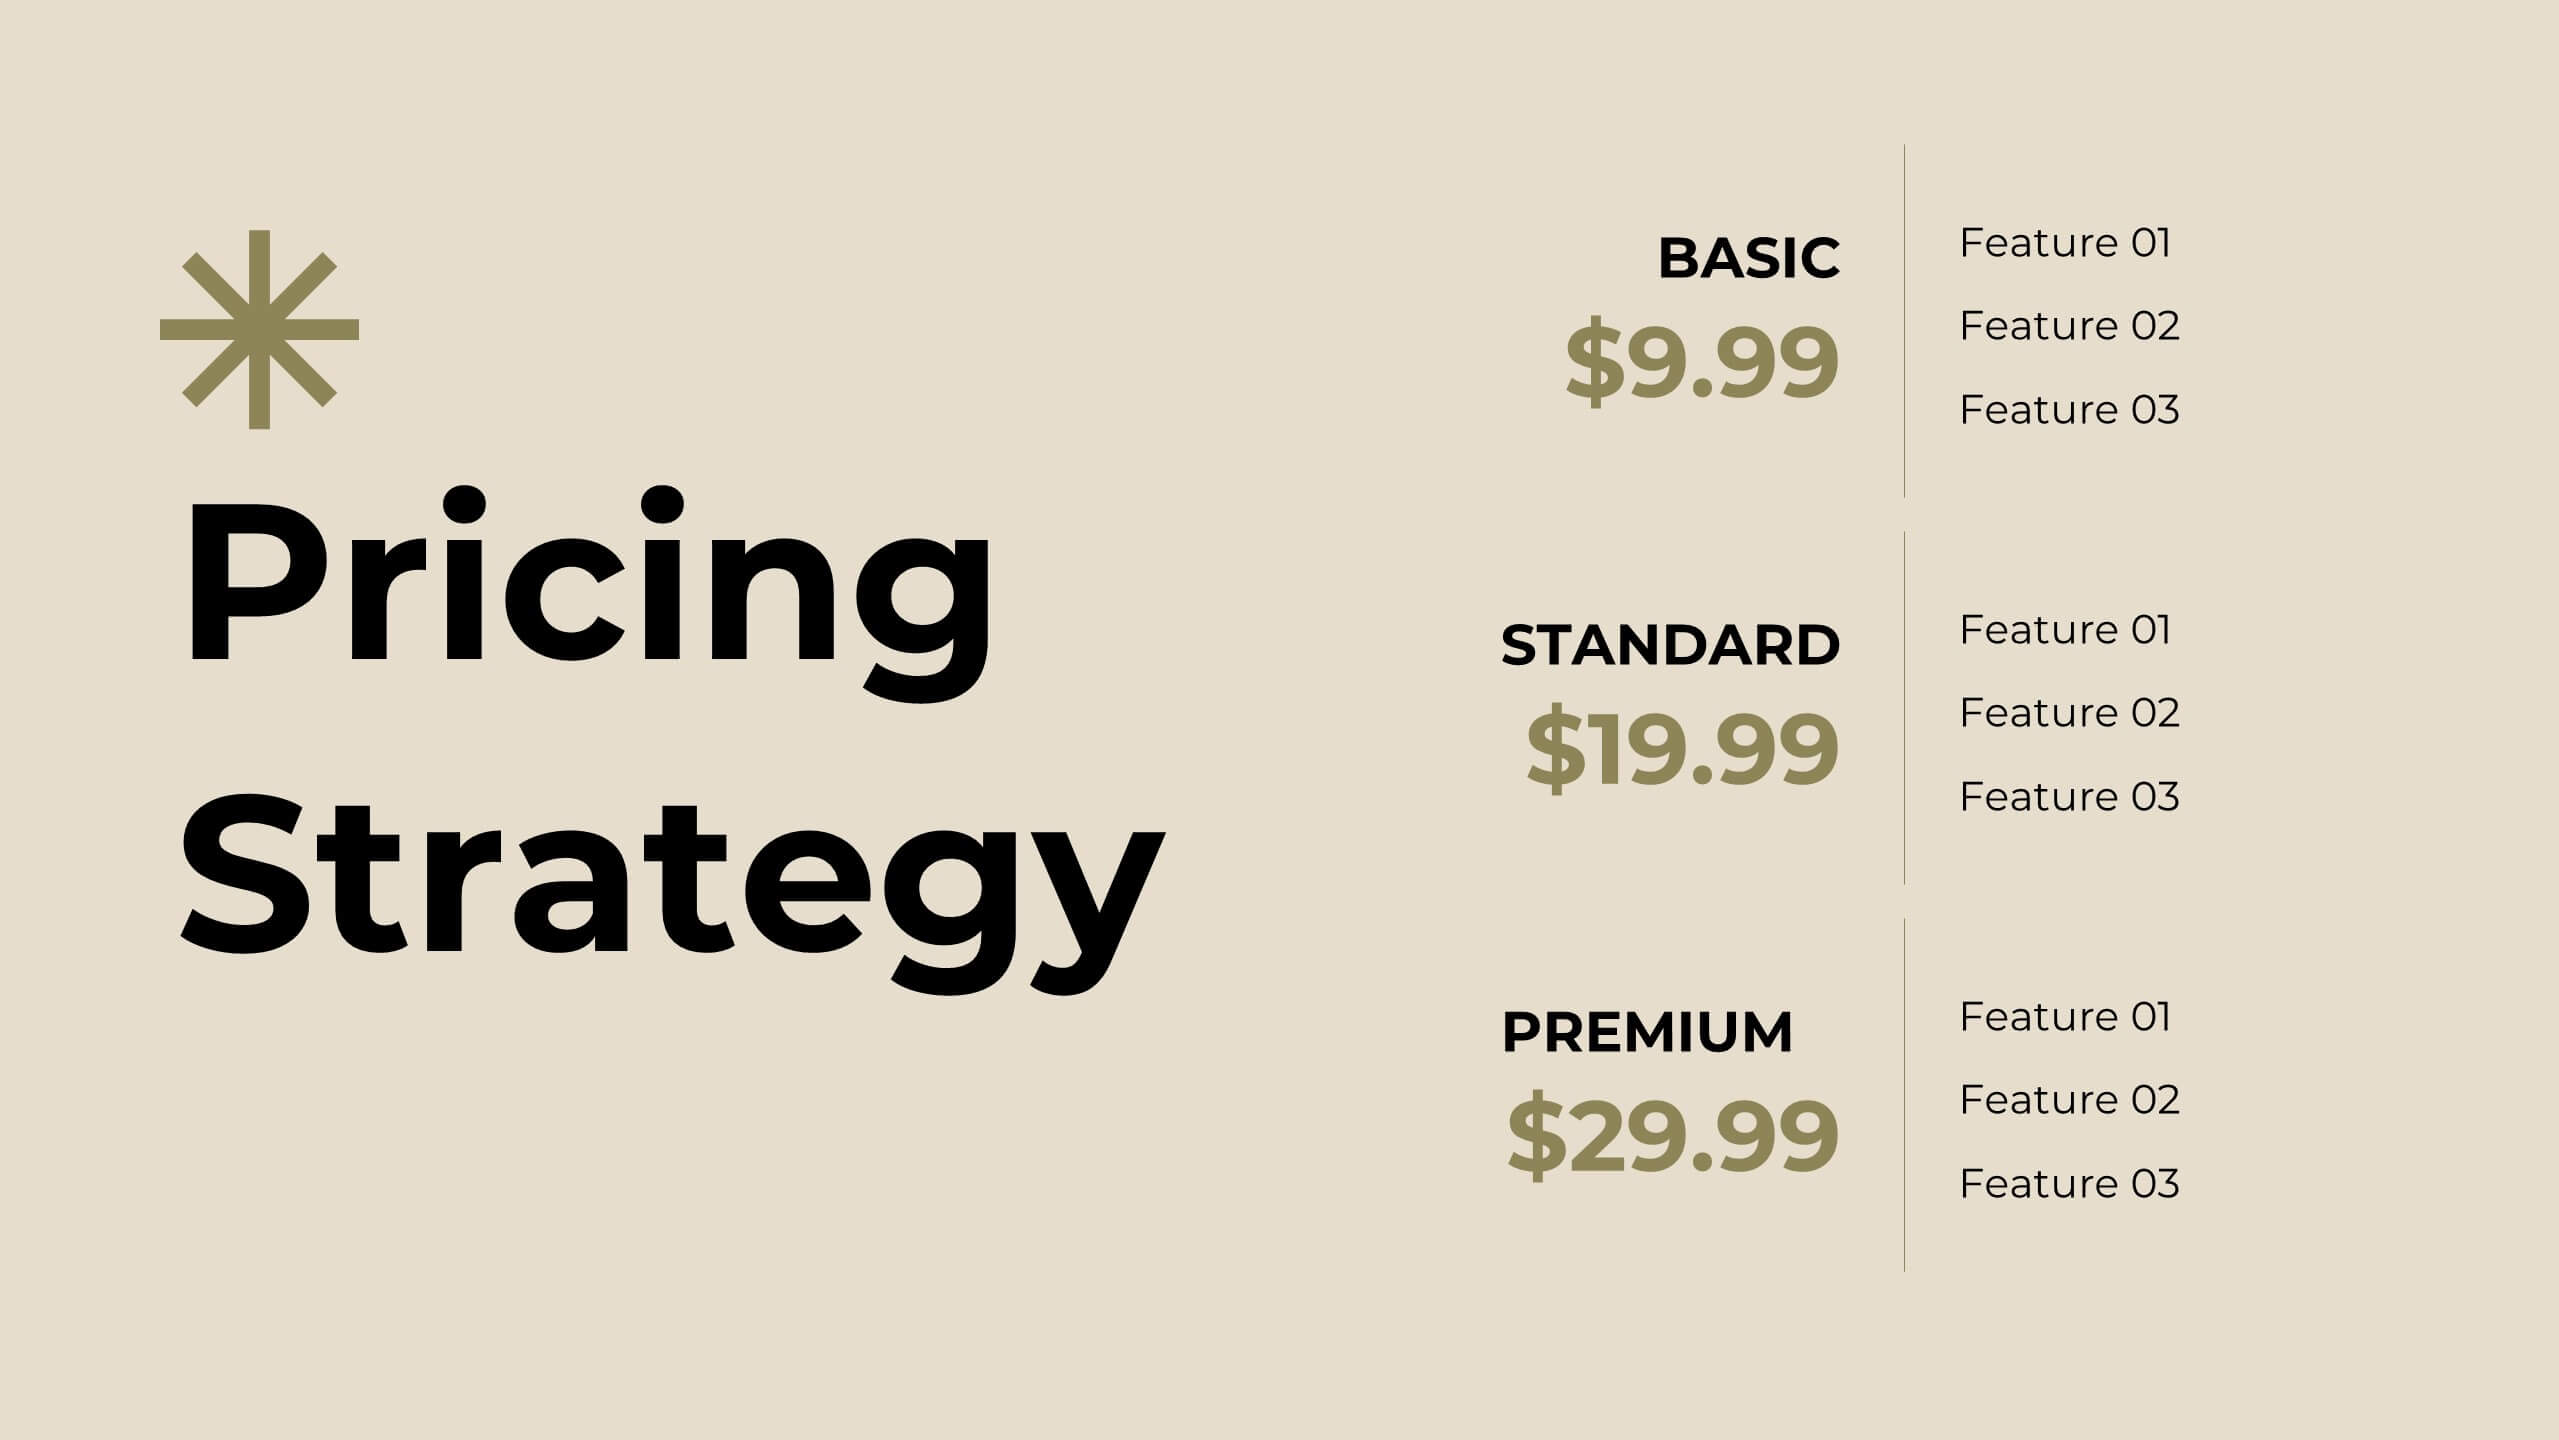
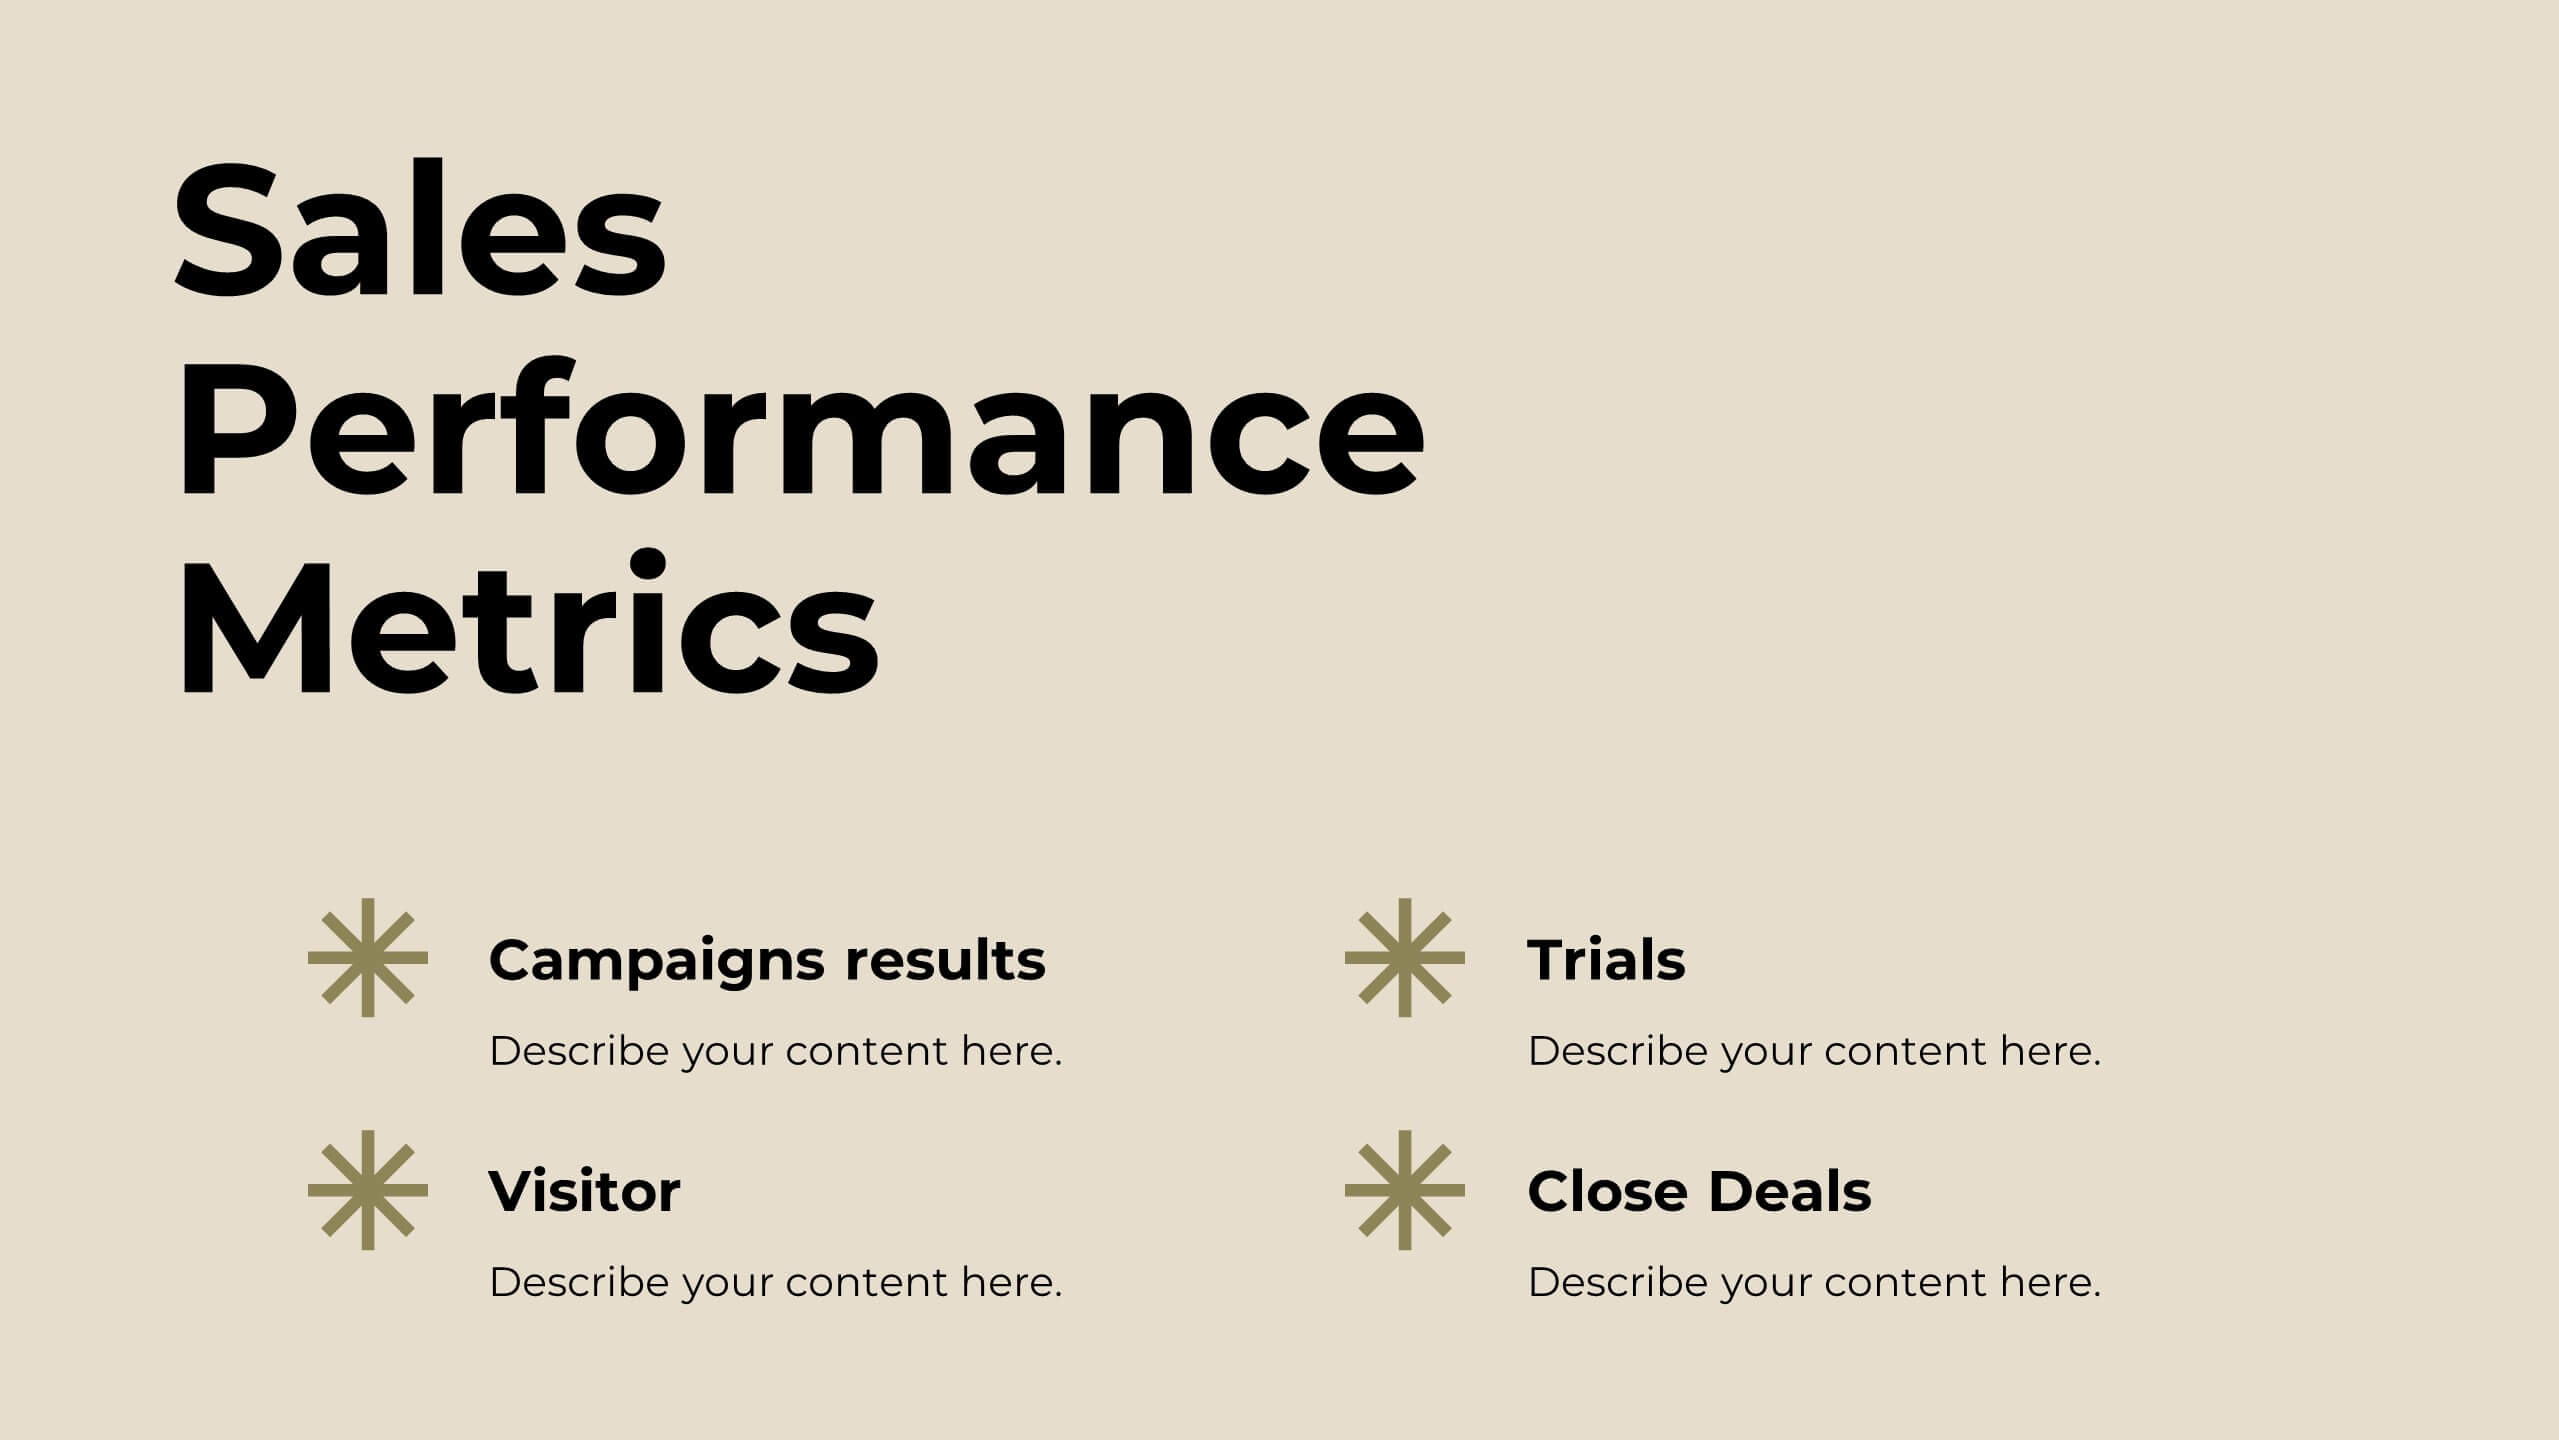
Opal Sales Pitch Deck Presentation
Boost your sales strategy with this sleek pitch deck template! Perfect for detailing your company overview, sales objectives, and pricing strategy, it includes slides for competitive analysis and customer testimonials. Engage your audience with clear, professional visuals and structured content. Compatible with PowerPoint, Keynote, and Google Slides for seamless presentations on any platform.


22 slides
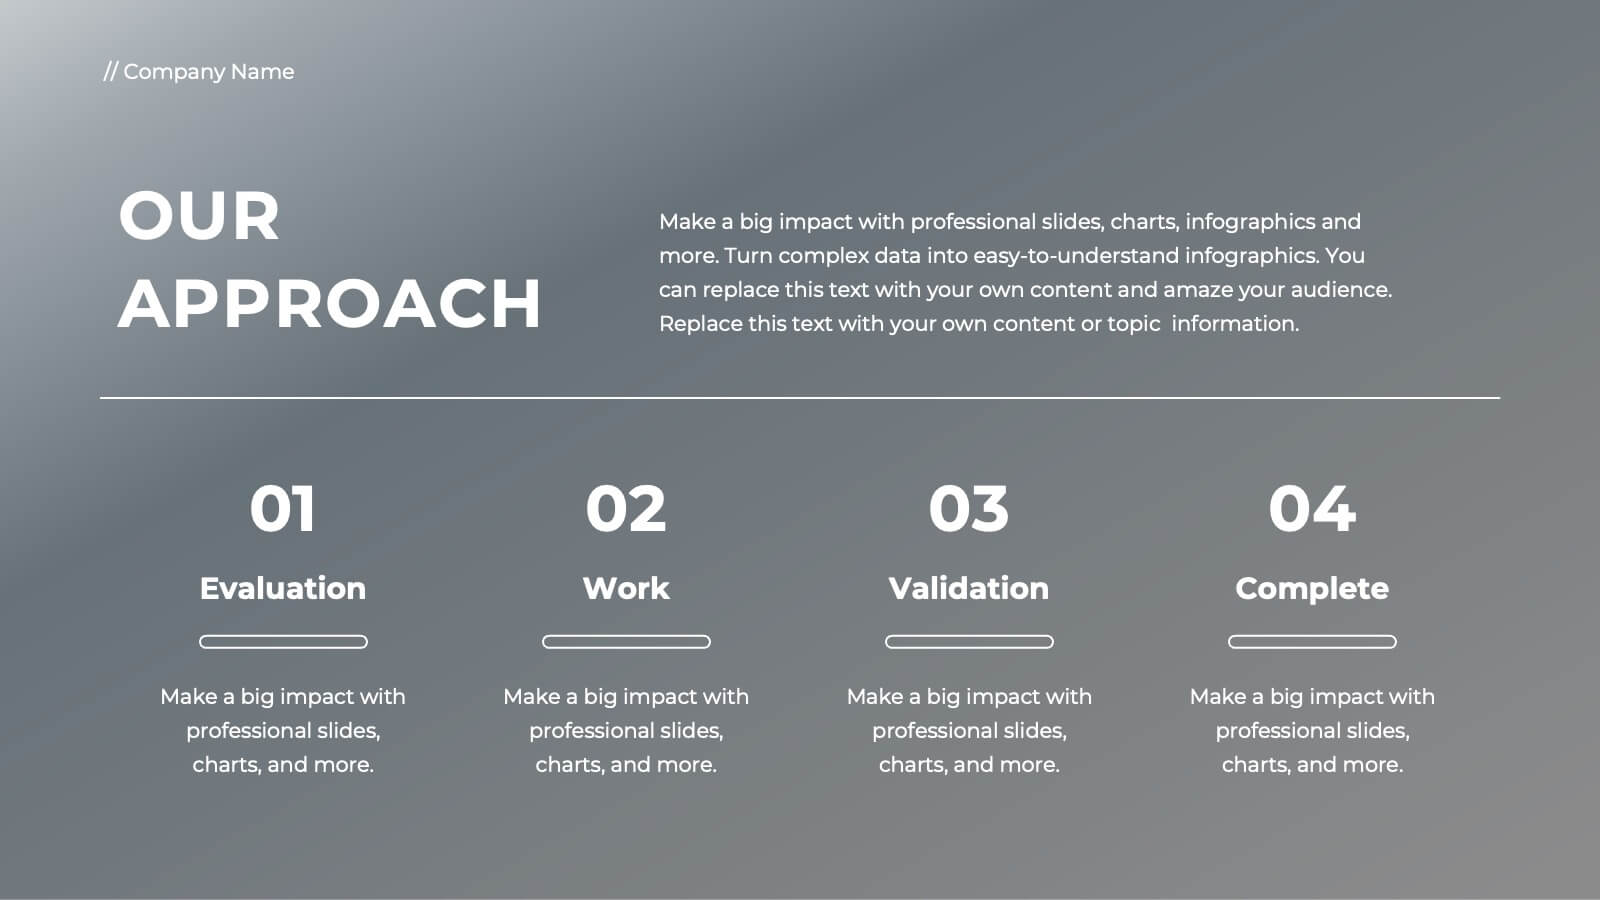
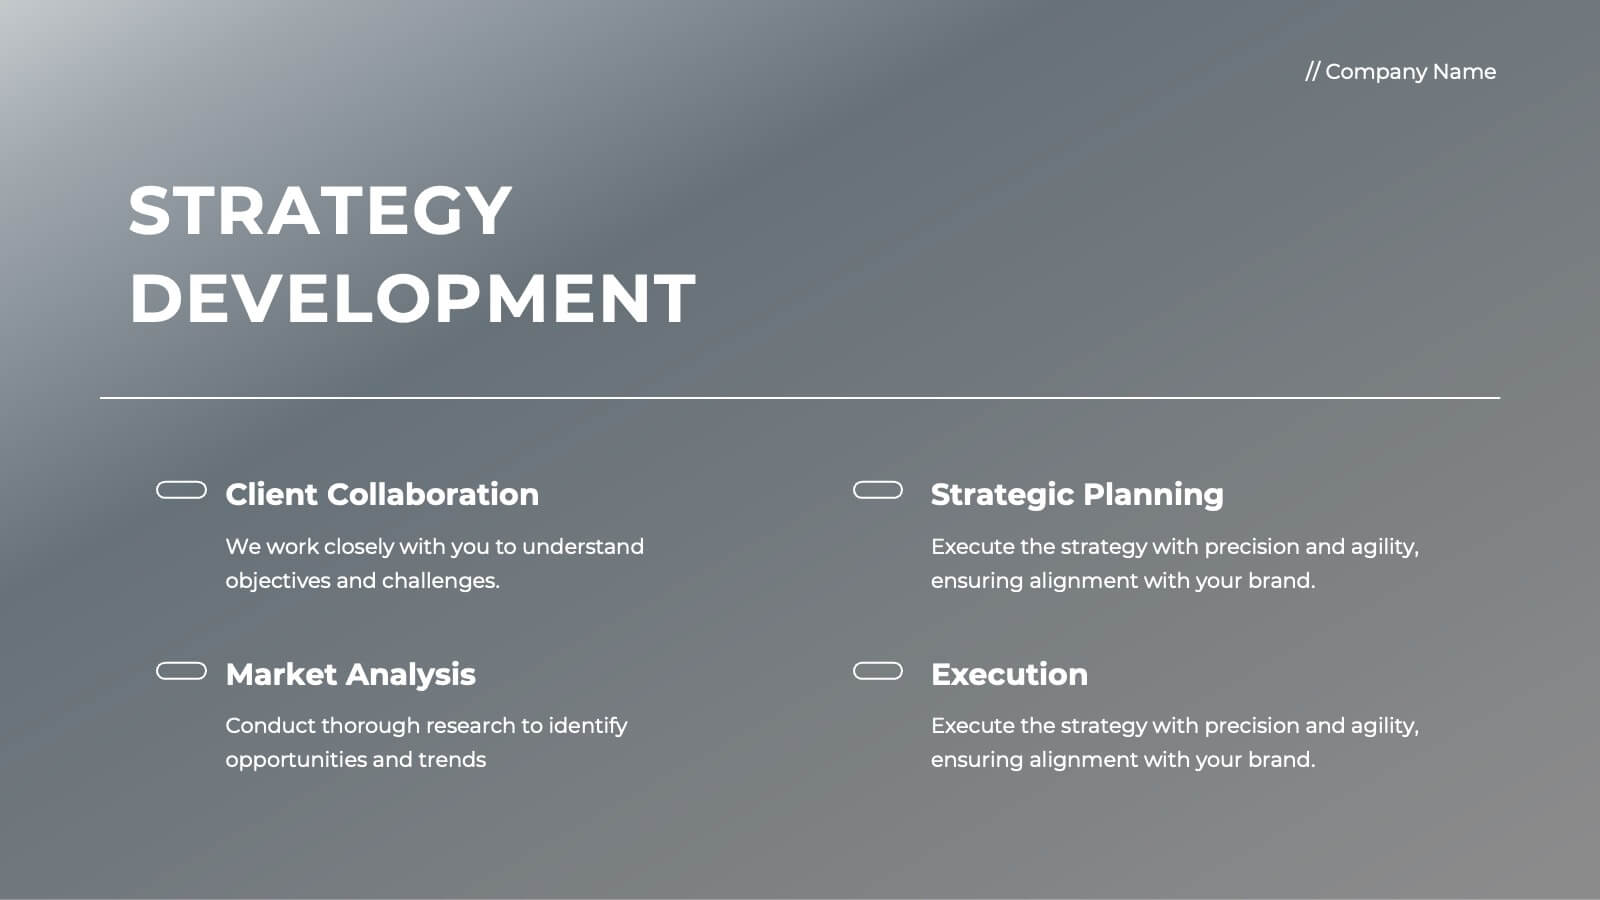
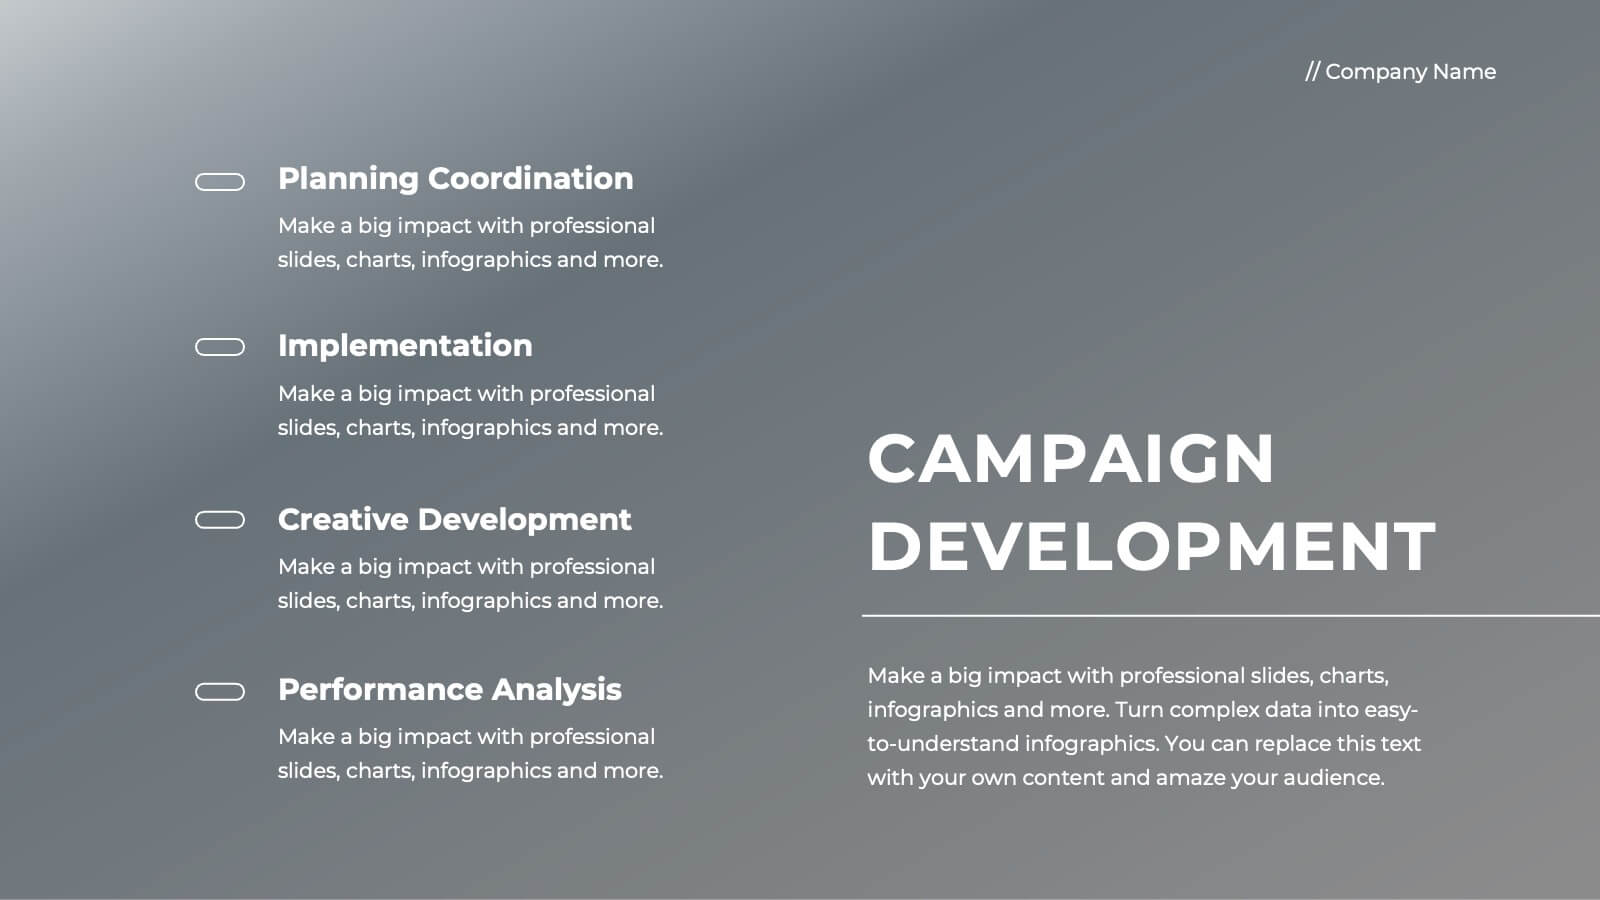
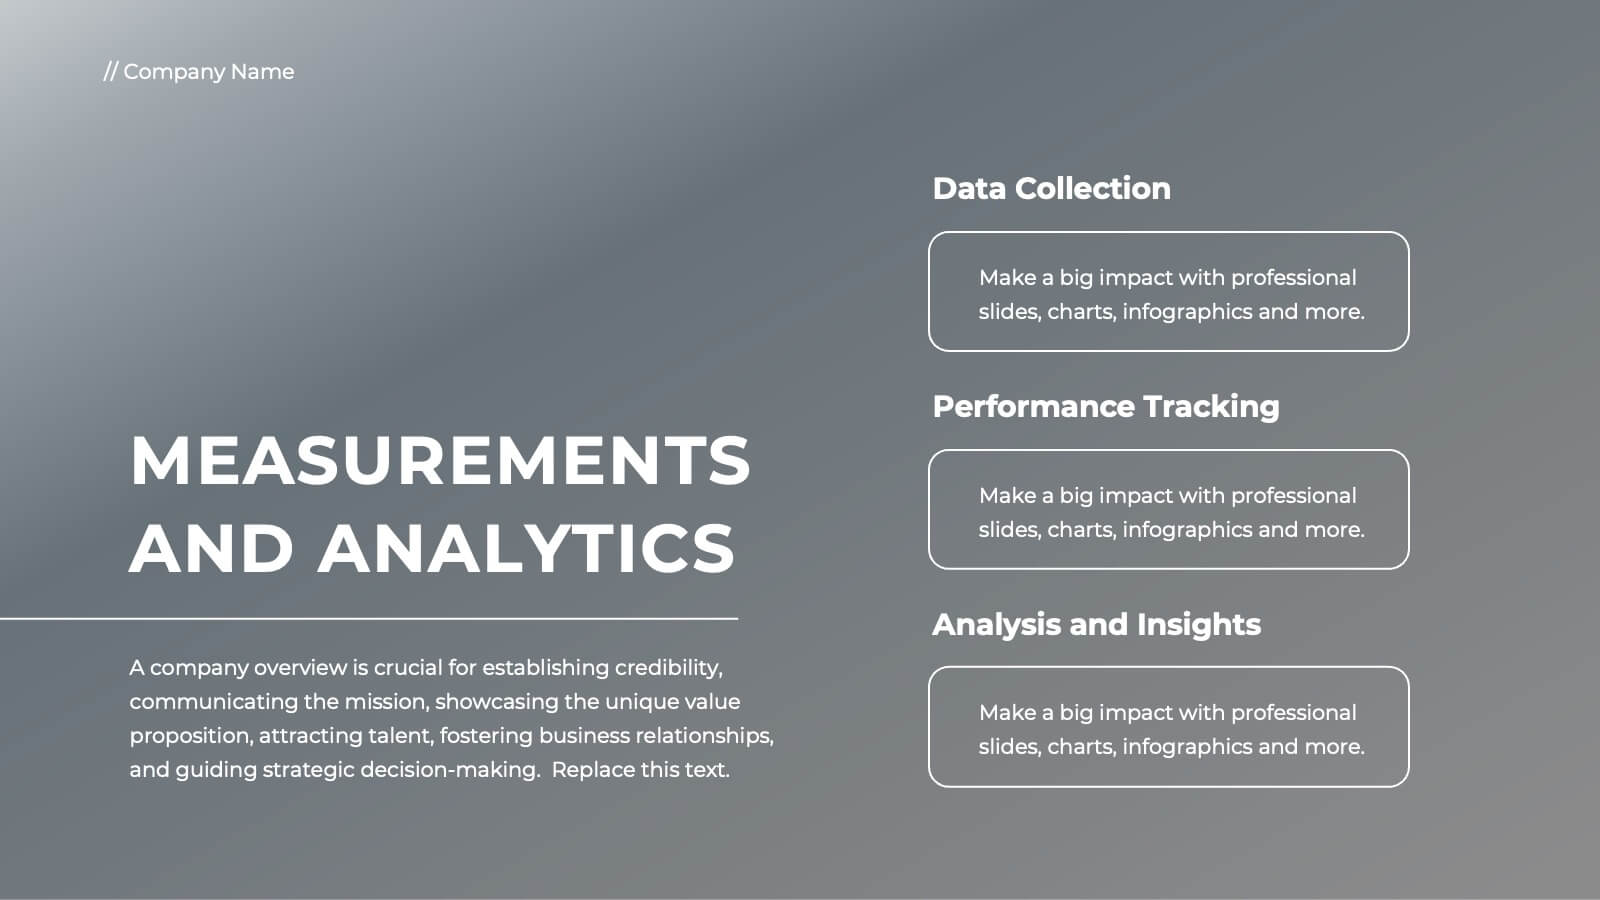
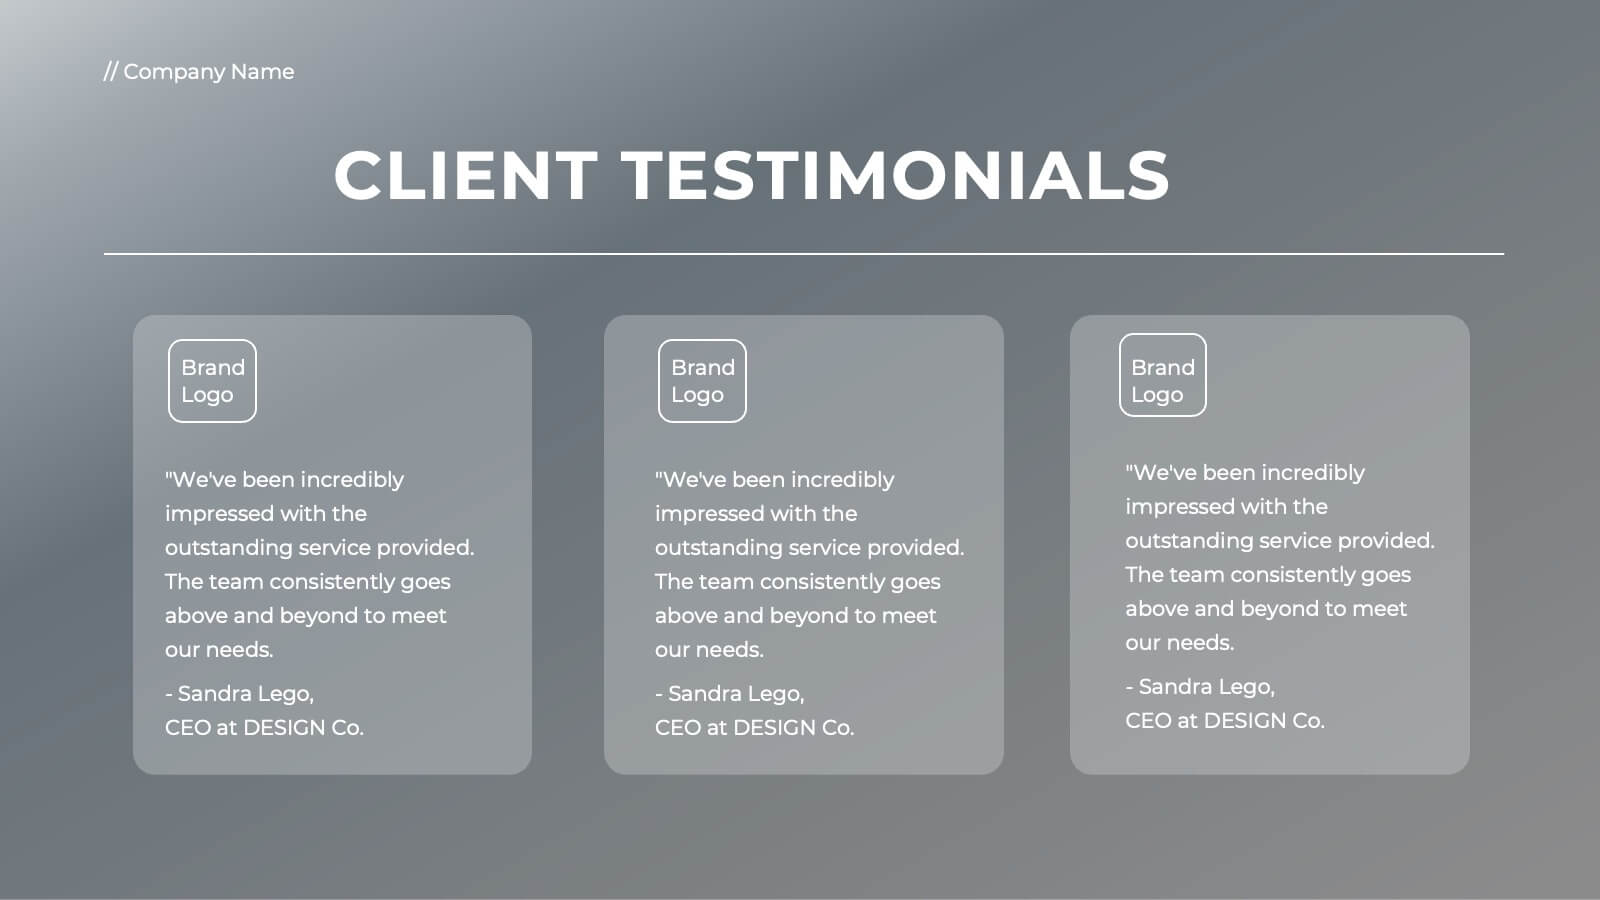
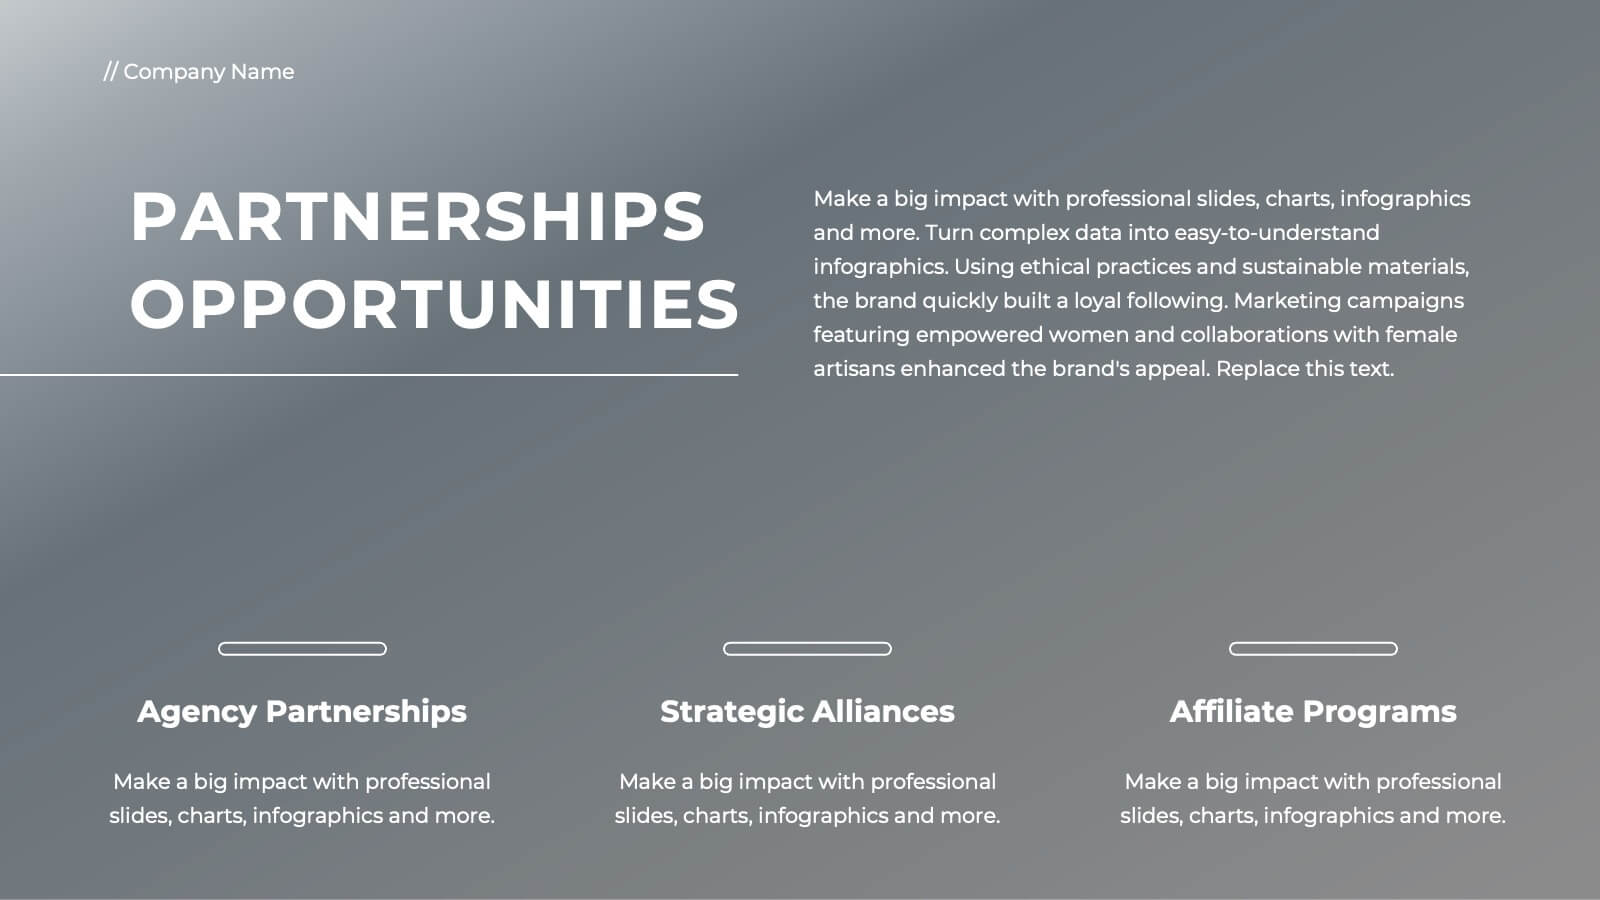
Ember Full-Service Agency Project Plan Presentation
Elevate your agency's presentation with this sleek project plan template! Ideal for showcasing your team's vision, market analysis, and client success stories, it includes slides for strategic development, campaign execution, and partnerships. Impress clients and stakeholders with professional visuals and detailed content. Compatible with PowerPoint, Keynote, and Google Slides for seamless presentations on any platform.


6 slides
Professional Company Portfolio Presentation
Showcase Your Business Success with a Sleek Portfolio! The Professional Company Portfolio template is designed to highlight key achievements, performance metrics, and strategic insights with a modern, image-driven layout. Featuring three visually appealing sections, this template allows you to present KPIs, revenue growth, and business milestones in a compelling and structured way. Fully customizable in PowerPoint, Keynote, and Google Slides, this portfolio template is perfect for presentations, investor updates, and corporate showcases.


4 slides
Cause-Effect Relationships Bowtie Format Presentation
Clearly illustrate the connection between causes and outcomes with the Cause-Effect Relationships Bowtie Format Presentation. Designed to simplify complex business logic, this layout uses a symmetrical bowtie shape to contrast contributing factors with resulting effects. Ideal for strategy, operations, or risk analysis. Fully editable in Canva, PowerPoint, Google Slides, and Keynote.


21 slides
Aetherial UX Research Report Presentation
A professional and modern template for UX research presentations. Highlight key elements such as user personas, journey mapping, wireframes, and testing processes. Includes slides for accessibility considerations, design systems, and feedback iteration. Fully customizable and compatible with PowerPoint, Keynote, and Google Slides to deliver impactful insights and research findings.


5 slides
Four-Step Customer Experience Framework Presentation
Showcase your customer journey with this sleek, step-by-step visual. Featuring a stair-step arrow design, it’s ideal for highlighting stages in user experience, onboarding, or service improvement. Each step is editable, with icons and titles for clarity. Compatible with PowerPoint, Keynote, and Google Slides—perfect for marketers, strategists, and CX professionals.


6 slides
Organizational Change Management Strategy Presentation
Navigate organizational change effectively with this dynamic and structured presentation slide. Featuring a puzzle-piece design, this template visually represents the interconnected steps of change management. Ideal for business leaders, HR professionals, and consultants, it helps illustrate transition processes, strategic adjustments, and team alignment. Fully editable, allowing you to customize text, colors, and layout to fit your business needs. Compatible with PowerPoint, Keynote, and Google Slides for effortless use.


5 slides
Large-Scale Data Strategy Template Presentation
Present your data strategy with clarity using this four-step triangle layout. Each triangle highlights a key phase, ideal for outlining processes like planning, cloud adoption, integration, and scalability. Clean icons and a modern design enhance communication. Fully editable and compatible with PowerPoint, Keynote, and Google Slides for flexible use.


26 slides
Venture Capital Presentation
Perfect for investors and startups, this Venture Capital presentation template is designed to effectively communicate the nuances of funding and investment strategies. Its professional layout, highlighted with bold colors and clear graphics, sets the stage for impactful discussions on the intricacies of venture capital. The slides are structured to guide you through every aspect of the investment journey, from introducing key players to dissecting financial forecasts and market analyses. Engaging visuals aid in illustrating company growth potential, funding stages, and investor expectations, while specialized slides enable a deep dive into competitive comparisons and future financial projections. This template, adaptable across PowerPoint, Keynote, and Google Slides, is an essential tool for anyone in the venture capital arena looking to present their ideas with confidence and precision.


5 slides
Level-Based Authority Chart Presentation
Display organizational hierarchy with clarity using this level-based authority chart. The pyramid layout highlights reporting tiers, perfect for showcasing leadership roles, department levels, or team structures. Fully customizable in Canva, PowerPoint, or Google Slides—ideal for managers, HR professionals, and business consultants looking to present structured authority in a clean format.


8 slides
Team Roles & Skills Chart Presentation
Bring your team’s strengths to life with this clean, engaging slide designed to highlight individual roles, skill levels, and key capabilities. It helps teams clearly visualize expertise, compare competencies, and communicate responsibilities with ease. Fully editable and compatible with PowerPoint, Keynote, and Google Slides.


7 slides
SEO Strategy and Keyword Plan Presentation
Spark your marketing roadmap with a bold, idea-driven layout that makes every action step clear and memorable. This presentation helps you outline search goals, explore keyword opportunities, and map out strategic priorities in a simple, visual flow. Fully compatible with PowerPoint, Keynote, and Google Slides.