


Features
- 5 Unique slides
- Fully editable and easy to edit in Microsoft Powerpoint, Keynote and Google Slides
- 16:9 widescreen layout
- Clean and professional designs
- Export to JPG, PDF or send by email


Do you have any questions?
Recommend


3 slides
Work from Home Setup and Productivity Plan Presentation
Ready to supercharge your productivity from your kitchen table to your couch office? This visual template helps you map out ideal remote work setups, task plans, and daily focus routines. Organize workspace essentials and time blocks in a clean, engaging format. Fully compatible with PowerPoint, Keynote, and Google Slides.


7 slides
Core Business Values Slide Presentation
Show what your company stands for with a bold, structured layout that highlights the principles driving your success. This presentation is ideal for communicating organizational values, culture, and goals in a professional, visually balanced way. Fully editable and compatible with PowerPoint, Keynote, and Google Slides for easy customization.


26 slides
Beginner's Guide to Investing Presentation
This presentation template is a fantastic starting point for anyone looking to dive into the world of investing. Designed with clarity and accessibility in mind, it caters specifically to beginners eager to understand the fundamentals of investment strategies and options. The template introduces users to the basics of stocks, bonds, and other investment vehicles, using easy-to-understand language and clear, informative visuals. The content is laid out in a logical sequence, beginning with basic concepts and gradually progressing to more complex investment ideas and strategies. Slides are enriched with diagrams, charts, and comparison tables that break down financial data and trends in a digestible format. Key investment terms are explained through engaging infographics that make learning both interactive and effective. To ensure a broad usability range, the template is fully compatible with popular presentation platforms such as PowerPoint, Google Slides, and Keynote. This compatibility allows users to easily adapt and present the information across different devices and settings, making it an invaluable tool for personal education or group training sessions in various learning environments.


5 slides
4 Steps Travel Itinerary Slide Presentation
Plan every adventure with a slide that makes travel feel effortless and exciting. This presentation helps you map out destinations, activities, and budgets in four clear, intuitive steps—perfect for trip planning or presenting itinerary options. Designed for smooth customization and fully compatible with PowerPoint, Keynote, and Google Slides.


4 slides
Sales Strategy 30-60-90 Day Plan
Accelerate your sales team’s performance with this 30-60-90 Day Strategy template. Designed with clean circular progress visuals and clear milestone stages, it helps you outline sales goals, track onboarding, and align strategic efforts. Ideal for new hires, quarterly planning, or sales enablement. Fully editable in PowerPoint, Keynote, and Google Slides.


5 slides
Circular Wheel for Process Flow
Visualize five interconnected stages or phases in a clean, circular layout. Ideal for presenting workflows, continuous cycles, or recurring business processes with clarity and structure. Easily customizable in PowerPoint, Keynote, and Google Slides to match your project needs.


8 slides
Meeting Agenda Presentation
Streamline your meeting agendas with our "Meeting Agenda Presentation" template. This design features a central node linked to four key points, each representing a separate agenda item, ensuring a clear and organized discussion flow. Color-coded segments aid in visually distinguishing between topics, making it easy for participants to follow and engage. Ideal for team meetings, project updates, and strategic discussions, this template enhances communication and efficiency. Its intuitive layout keeps your sessions on track and productive. Compatible with PowerPoint, Keynote, and Google Slides, it's an essential tool for any professional aiming to optimize their meeting presentations.


20 slides
Silverleaf Graphic Design Project Plan Presentation
This Graphic Design Project Plan Presentation Template offers a vibrant and modern design to showcase your creative process, key elements, and strategic goals. It includes sections for design brief, target audience, moodboard, prototypes, and implementation. Ideal for agencies and designers, fully customizable in PowerPoint, Keynote, and Google Slides.


6 slides
Concentric Circles Study Infographic
Concentric circles are a set of circles with the same center point but different radii (plural of radius). This Infographic provides visual insights into the concept of concentric circles, their properties, and applications. These circles are arranged in such a way that one circle is surrounded by another, forming a pattern that resembles a target or a bullseye. This illustrates various concepts, making the infographic a versatile and engaging geometric pattern. Fully customizable and compatible with Powerpoint, Keynote, and Google Slides. Design an organized layout that guides the viewer's eye through the infographic.
22 slides
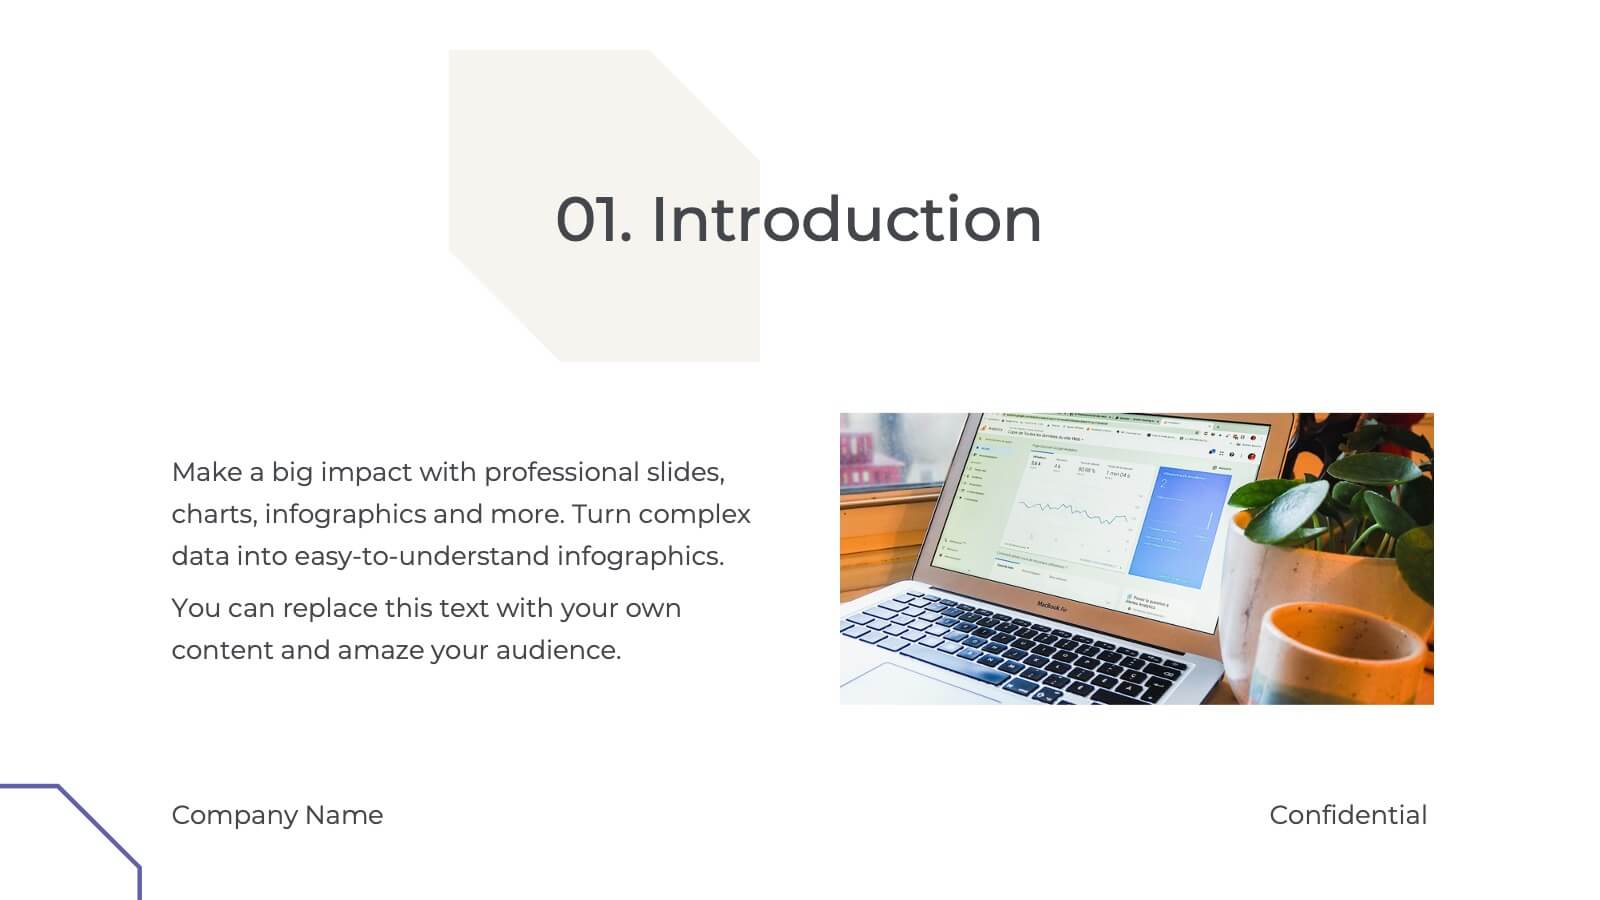
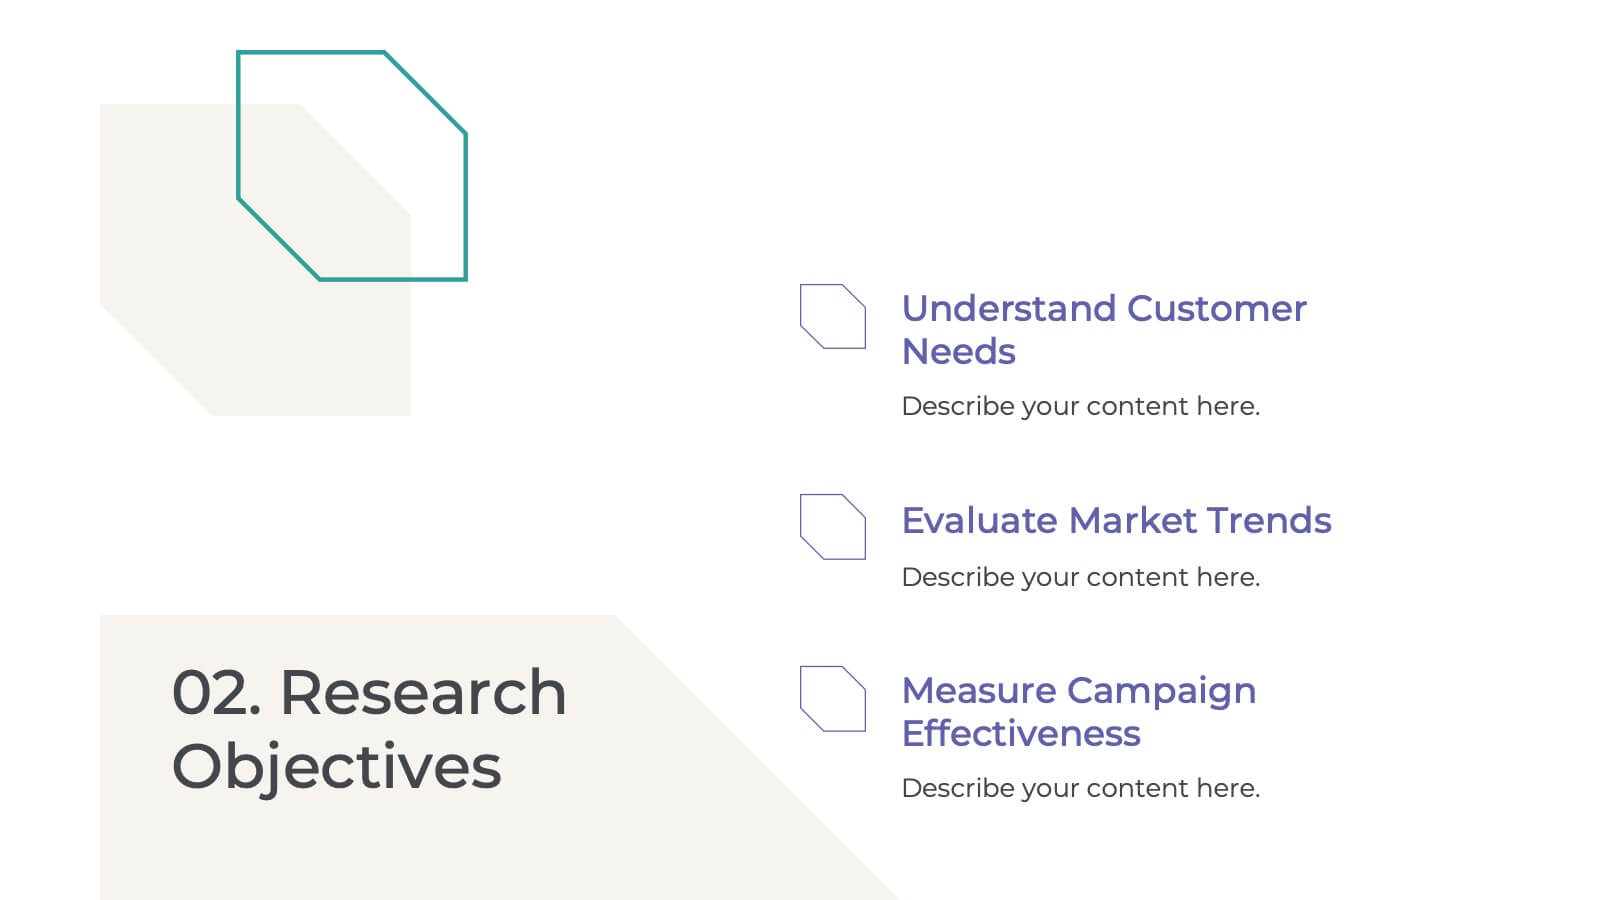
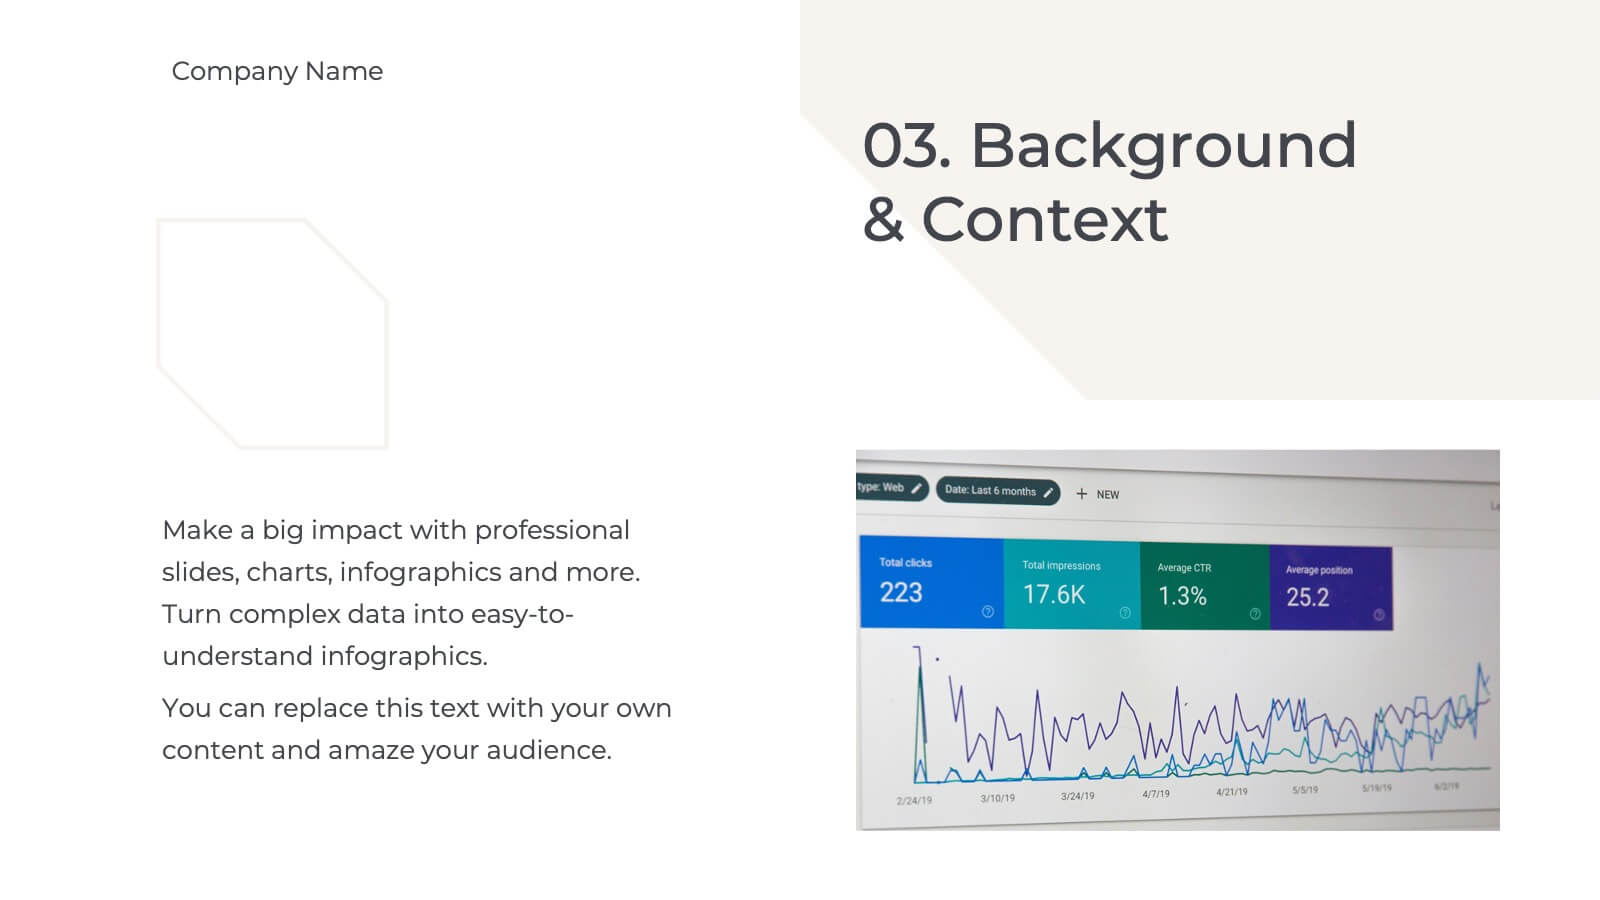
Palladium Qualitative Research Findings Presentation
Present your qualitative research findings effectively with this sleek, professional template. It includes sections for objectives, data analysis, key findings, and recommendations. Ideal for organizing research insights clearly, it's customizable and compatible with PowerPoint, Keynote, and Google Slides, ensuring smooth collaboration and impactful presentations for your audience.


6 slides
Meeting Planner Infographics
Efficiently plan and organize meetings with our Meeting Planner infographic template. This template is fully compatible with popular presentation software like PowerPoint, Keynote, and Google Slides, allowing you to easily customize it to illustrate and communicate the key steps and strategies for effective meeting planning. The Meeting Planner infographic template offers a visually engaging platform to outline the meeting planning process, including scheduling, agenda creation, participant coordination, and follow-up actions. Whether you're a project manager, event planner, or business professional, this template provides a user-friendly canvas to create informative presentations and educational materials on meeting planning best practices. Optimize your meeting planning skills and efficiency with this SEO-optimized Meeting Planner infographic template, thoughtfully designed for clarity and ease of use. Customize it to showcase tips for successful meetings, tools for scheduling, and strategies for engaging participants, ensuring that your audience becomes more proficient in planning and executing productive meetings. Start crafting your personalized infographic today to become a more effective Meeting Planner.


7 slides
Industrial Safety Infographic
Industrial safety, also known as occupational safety, pertains to the management of processes and conditions within industrial settings to ensure the safety, health, and well-being of workers and the general public. This impactful infographic template encapsulates the essentials for fostering a secure and hazard-free industrial environment. Compatible with Powerpoint, Keynote, and Google Slides. The customizable set of icons represents emergency response actions, underlining the need for rapid and efficient responses in critical situations. Build a foundation of safety that fosters a secure and thriving work environment.


4 slides
Historical Event Timeline Presentation
Visualize your timeline with this Historical Event layout, ideal for showcasing progress, milestones, or key moments over time. Featuring a horizontal design with date markers and icons, it’s perfect for history, education, or project recaps. Fully editable in PowerPoint, Keynote, and Google Slides to match your content and branding.


4 slides
Neuroscience-Inspired Concept Mapping Presentation
Visualize abstract ideas with clarity using the Neuroscience-Inspired Concept Mapping Presentation. Featuring a head silhouette and four labeled concept nodes, this layout is perfect for connecting ideas, frameworks, or steps in a thought process. Fully editable in PowerPoint, Canva, and Google Slides for seamless customization and presentation.


24 slides
Catalyst Strategic Planning Report Presentation
Unleash your strategic vision with the Catalyst Strategic Planning Report template! This vibrant and dynamic layout is designed to make your strategic planning presentations not only effective but also visually captivating. The template’s playful yet professional design elements, including bold color blocks and creative graphics, draw attention to key points, ensuring your message resonates with your audience. From SWOT analysis to market trends, and resource allocation to action plans, every slide is crafted to communicate your strategic objectives clearly and compellingly. Perfect for business reviews, strategic meetings, or investor presentations, this template allows you to present data-driven insights and actionable steps in an engaging manner. It’s fully customizable, making it easy to adapt to your brand’s colors and style. Whether you’re presenting to a team or stakeholders, the Catalyst template provides the perfect platform to articulate your vision. Compatible with PowerPoint, Keynote, and Google Slides, it’s your go-to tool for impactful strategic presentations!


12 slides
Real Estate House Market Trends Presentation
Analyze Real Estate House Market Trends with this insightful presentation template. Featuring a house-shaped hexagonal layout, this design helps illustrate key factors such as market demand, property values, investment opportunities, and housing policies. Ideal for real estate professionals, investors, and analysts looking to present market insights with clarity and impact. Fully customizable and compatible with PowerPoint, Keynote, and Google Slides.


7 slides
7 Elements of McKinsey Framework Presentation
Turn complex organizational elements into a simple, story-driven visual with a clean layout that highlights how each component connects back to core values. This presentation helps you explain relationships, improve alignment, and support strategic decision-making with clarity and ease. Fully editable and compatible with PowerPoint, Keynote, and Google Slides.