


Features
- 10 Unique slides
- Fully editable and easy to edit in Microsoft Powerpoint, Keynote and Google Slides
- 16:9 widescreen layout
- Clean and professional designs
- Export to JPG, PDF or send by email


Do you have any questions?
Recommend


4 slides
Workforce Adaptation Through Change Management Presentation
Show how your team evolves and thrives through transformation with this visual journey up the change curve. This template uses a clear mountain-climb illustration to highlight workforce progression and adaptation. Ideal for HR, change leaders, and organizational development professionals. Fully compatible with PowerPoint, Keynote, and Google Slides.


4 slides
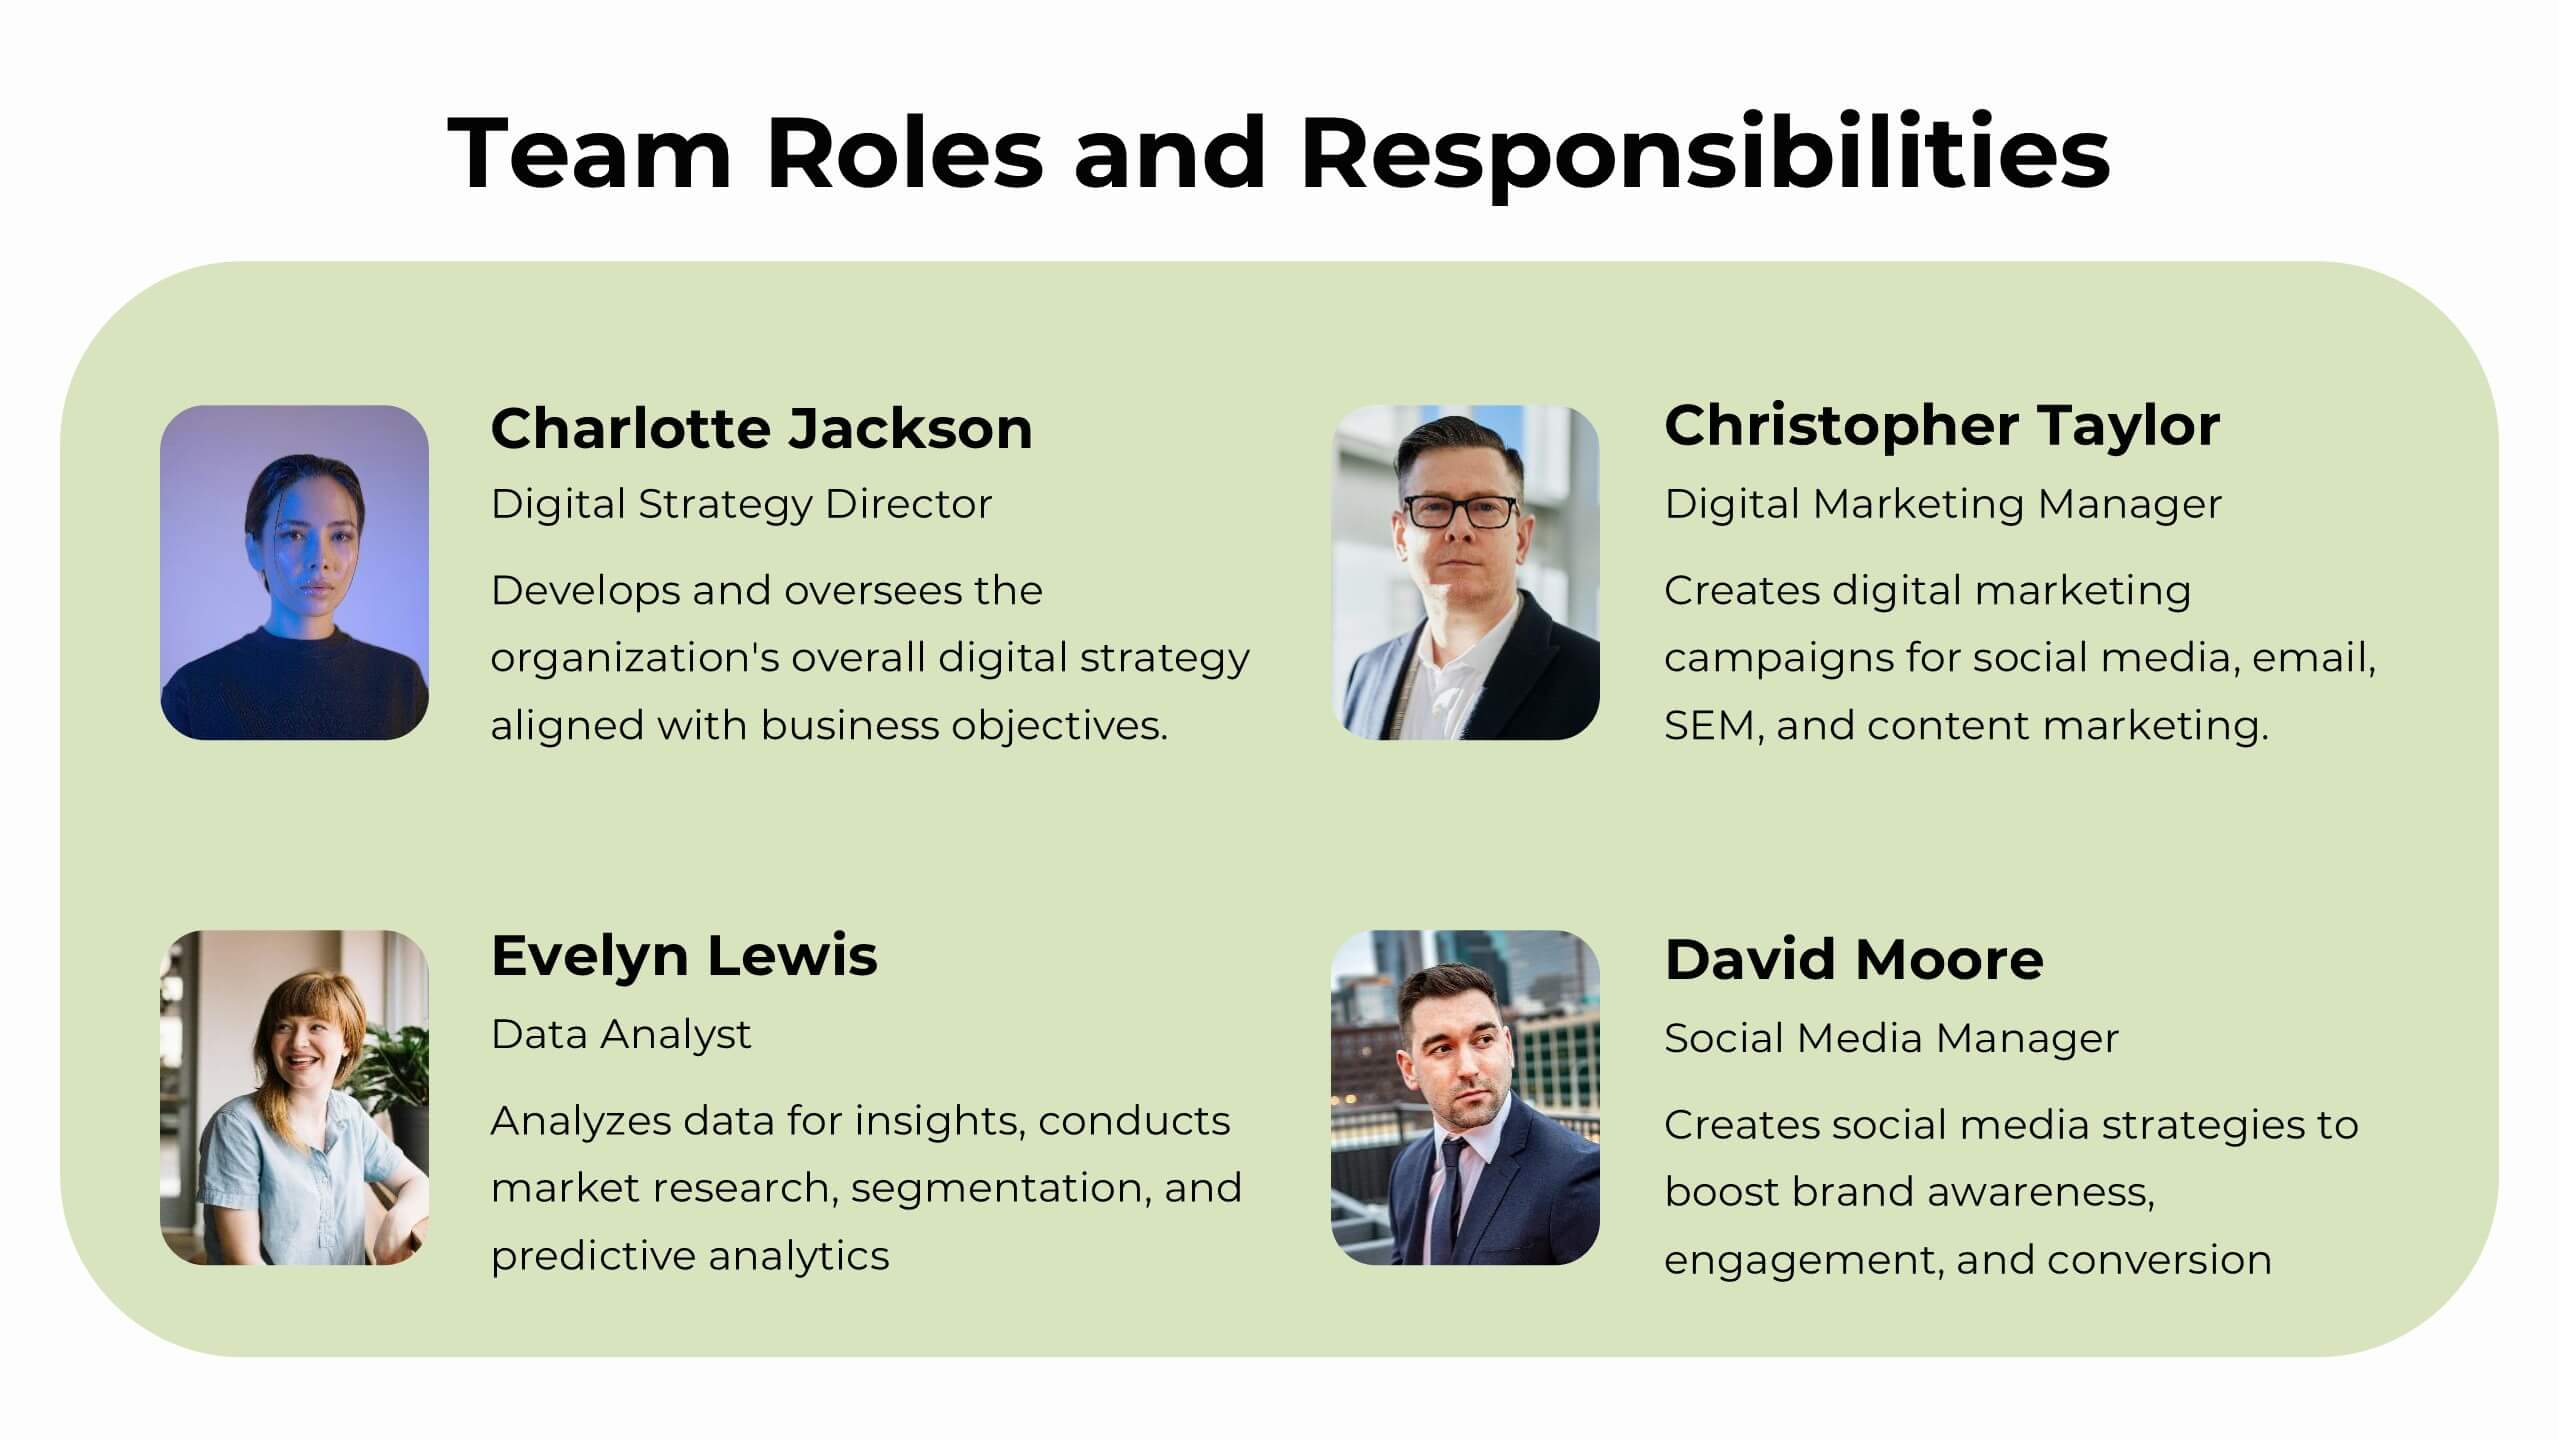
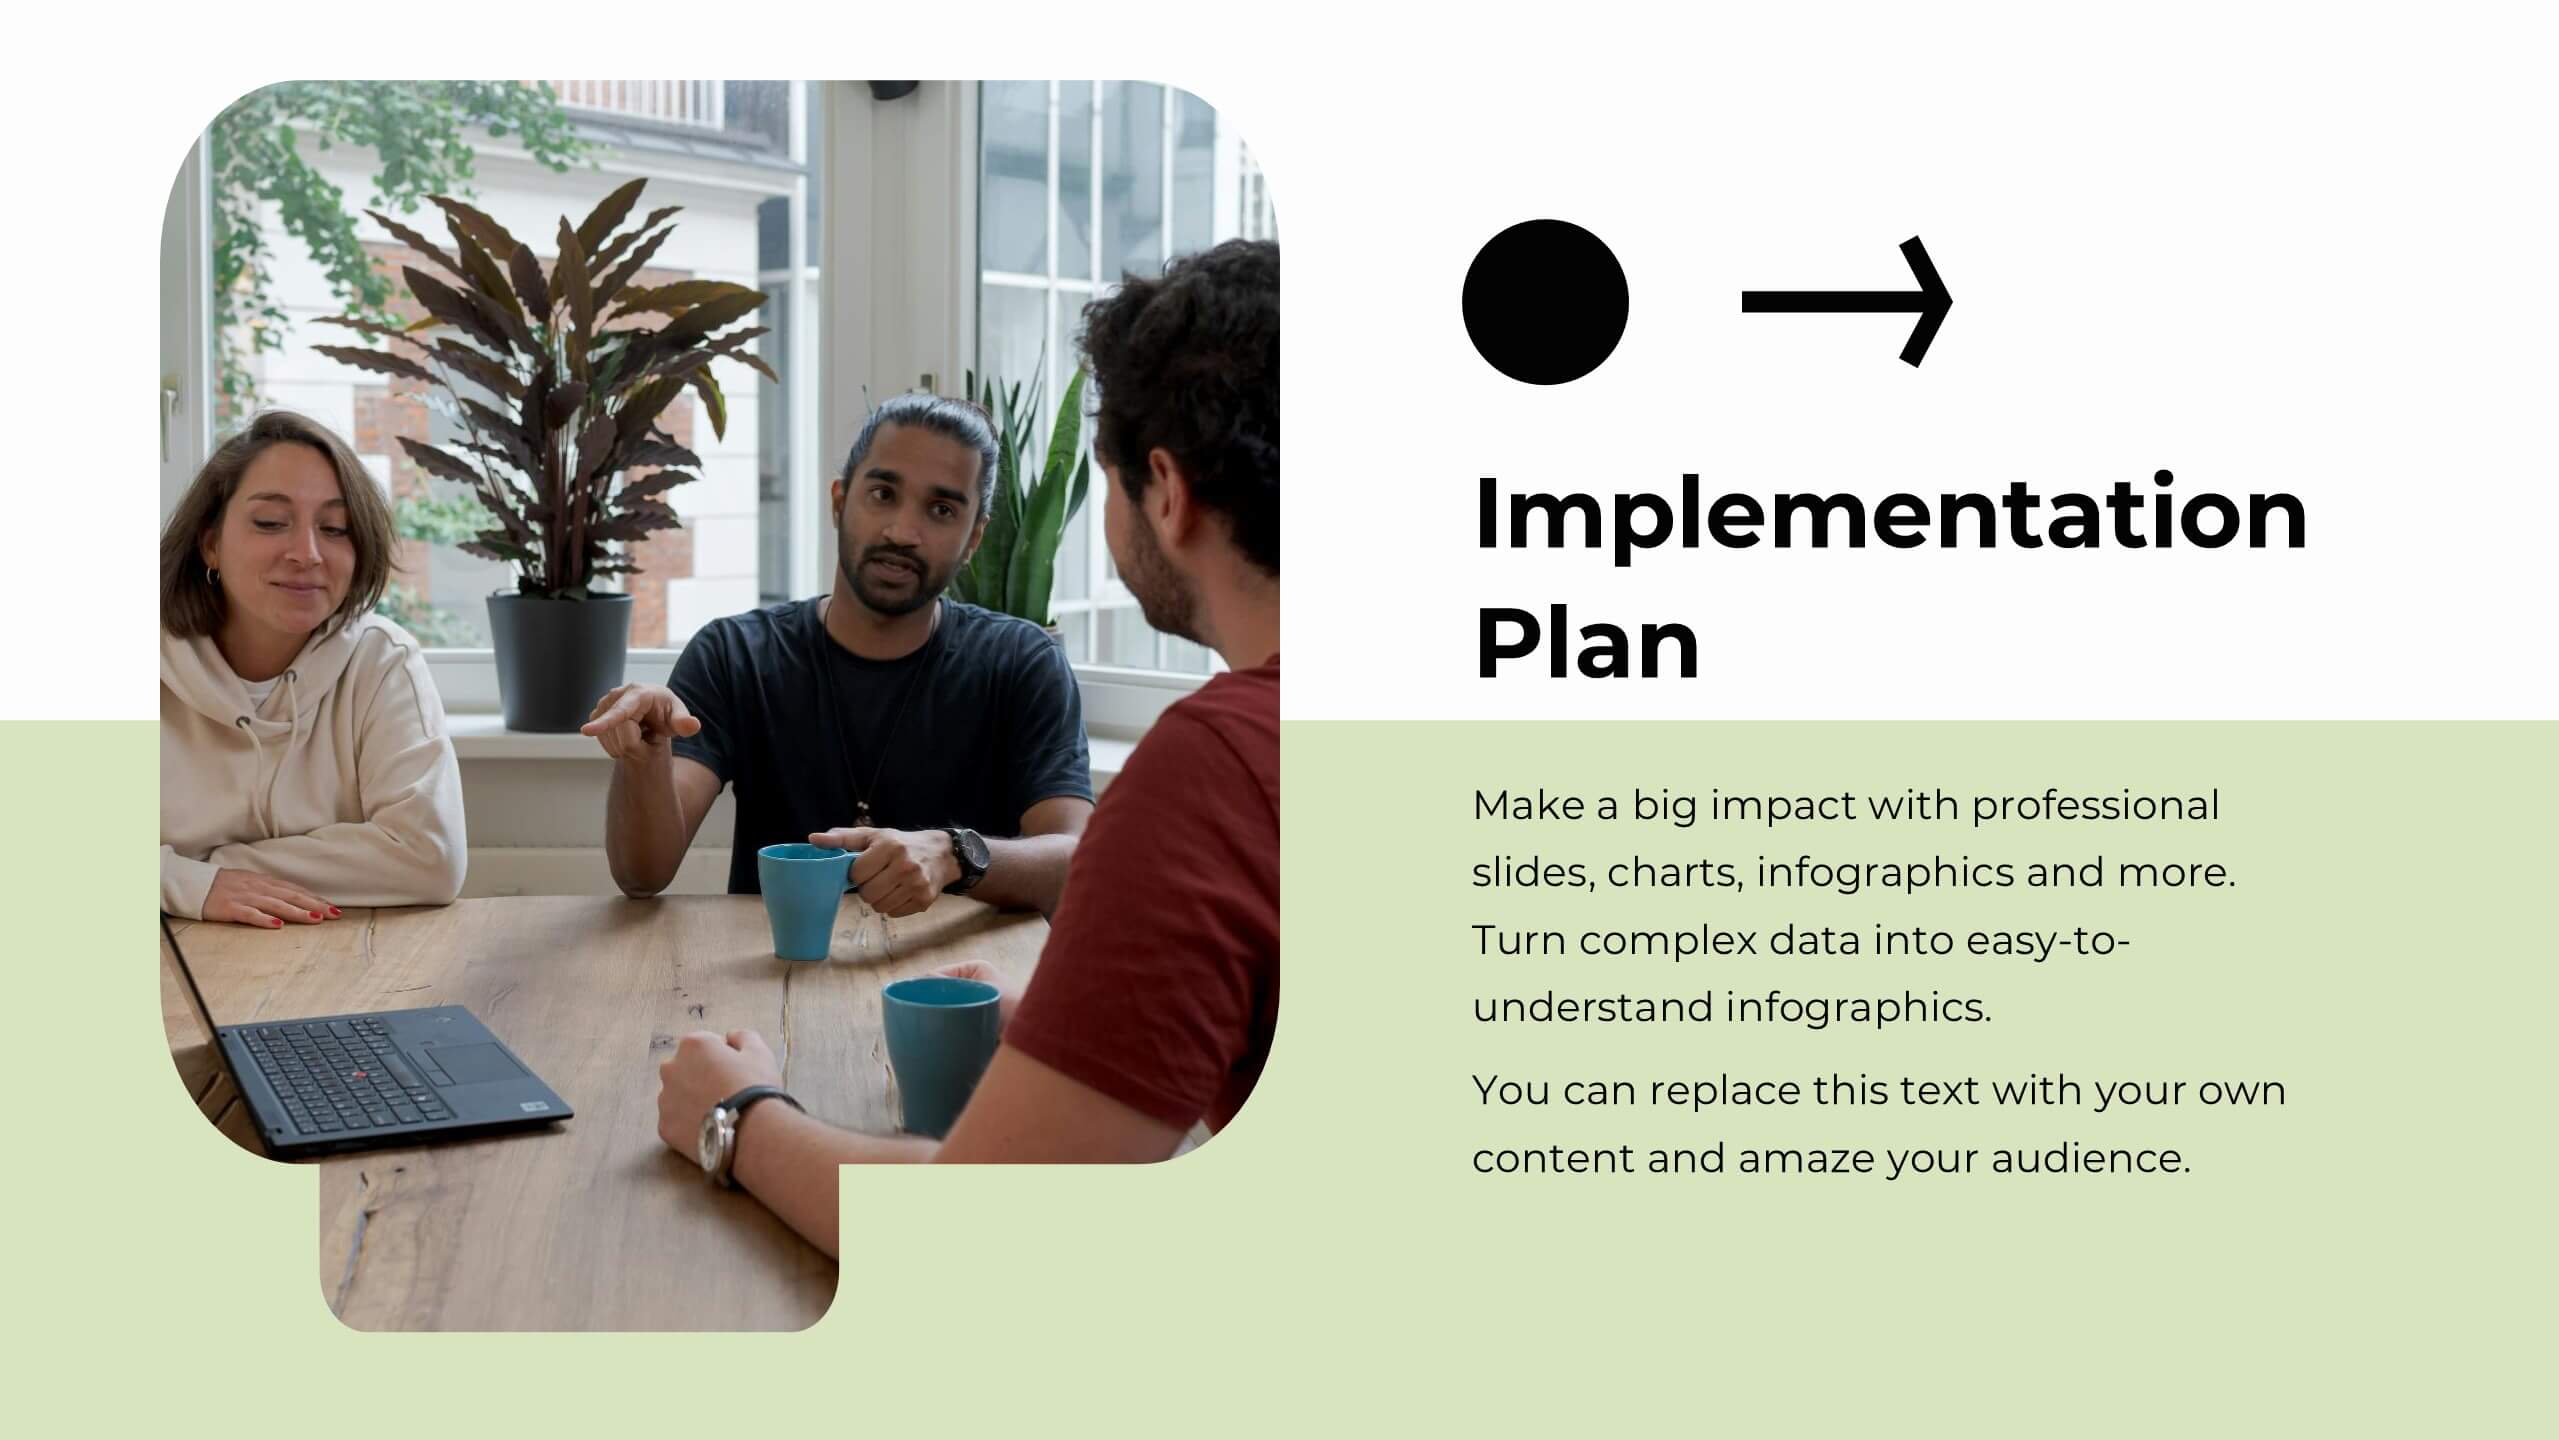
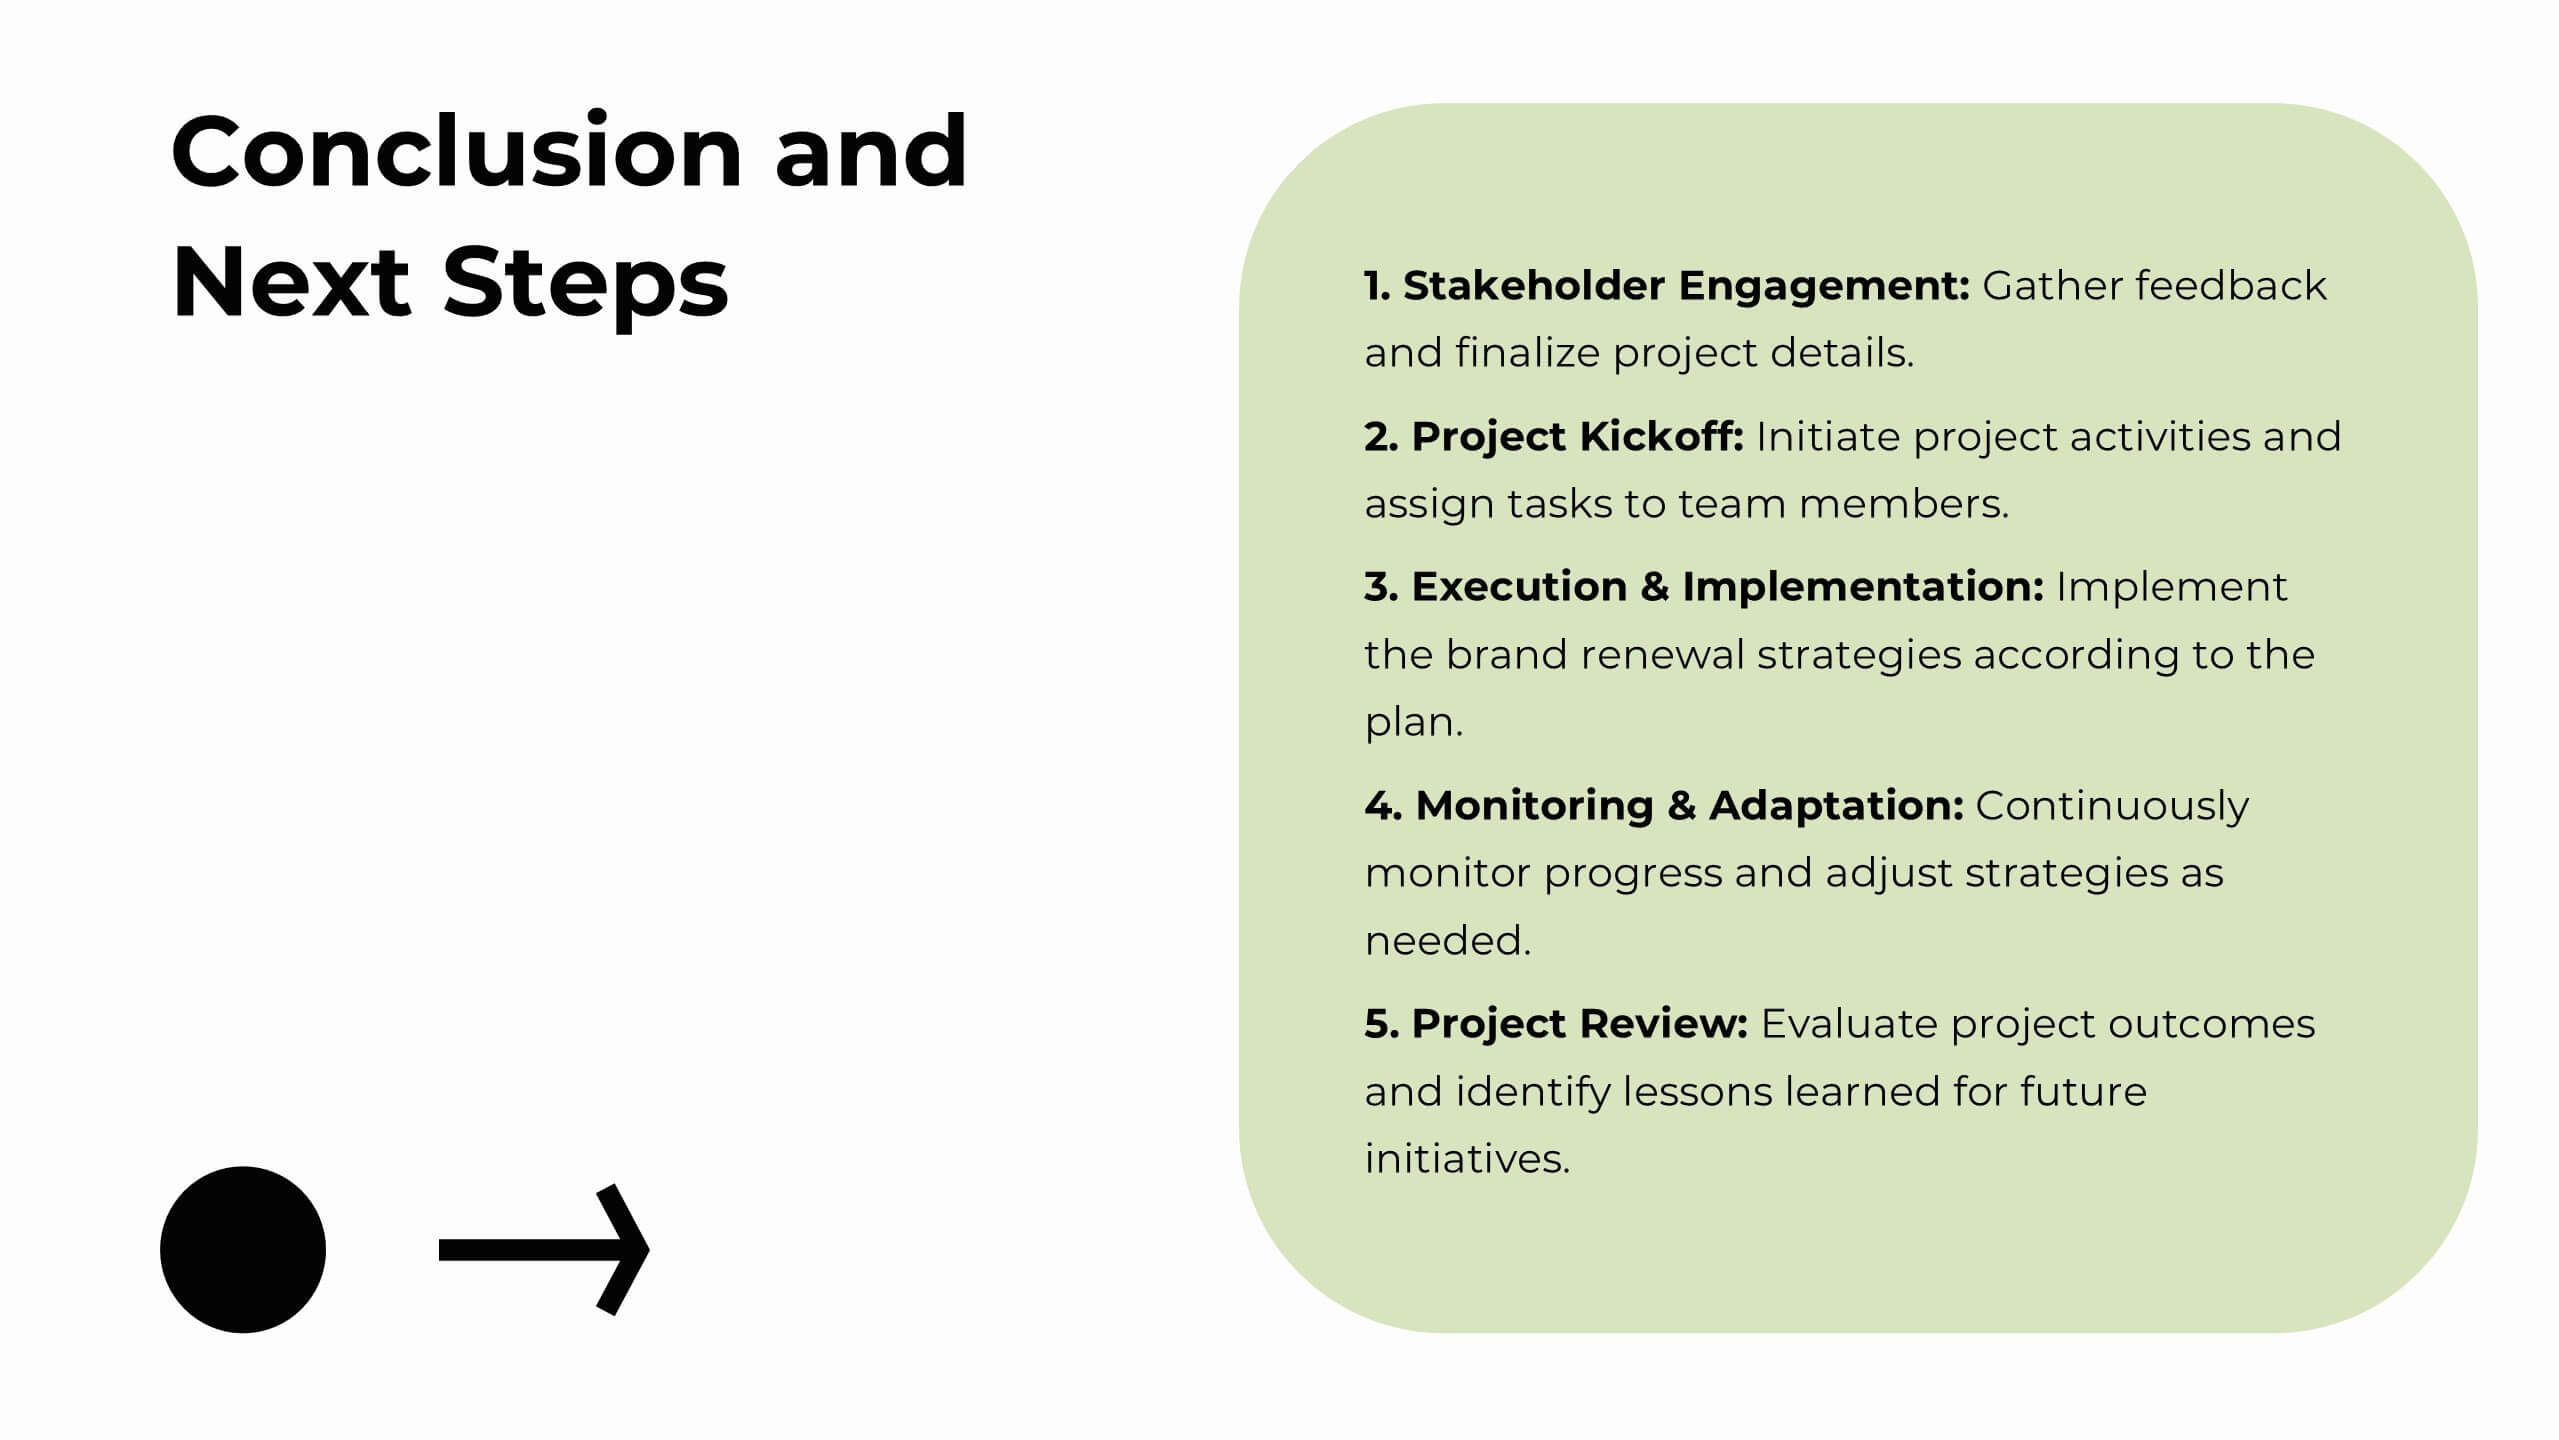
Organizational Hierarchy Chart Presentation
A clear, engaging way to map out team structure, this presentation highlights how roles connect and flow across an organization. It visually simplifies reporting lines, helping audiences quickly understand leadership levels and team responsibilities. Perfect for planning, onboarding, or strategy discussions, and fully compatible with PowerPoint, Keynote, and Google Slides.


7 slides
Innovation Infographics Presentation Template
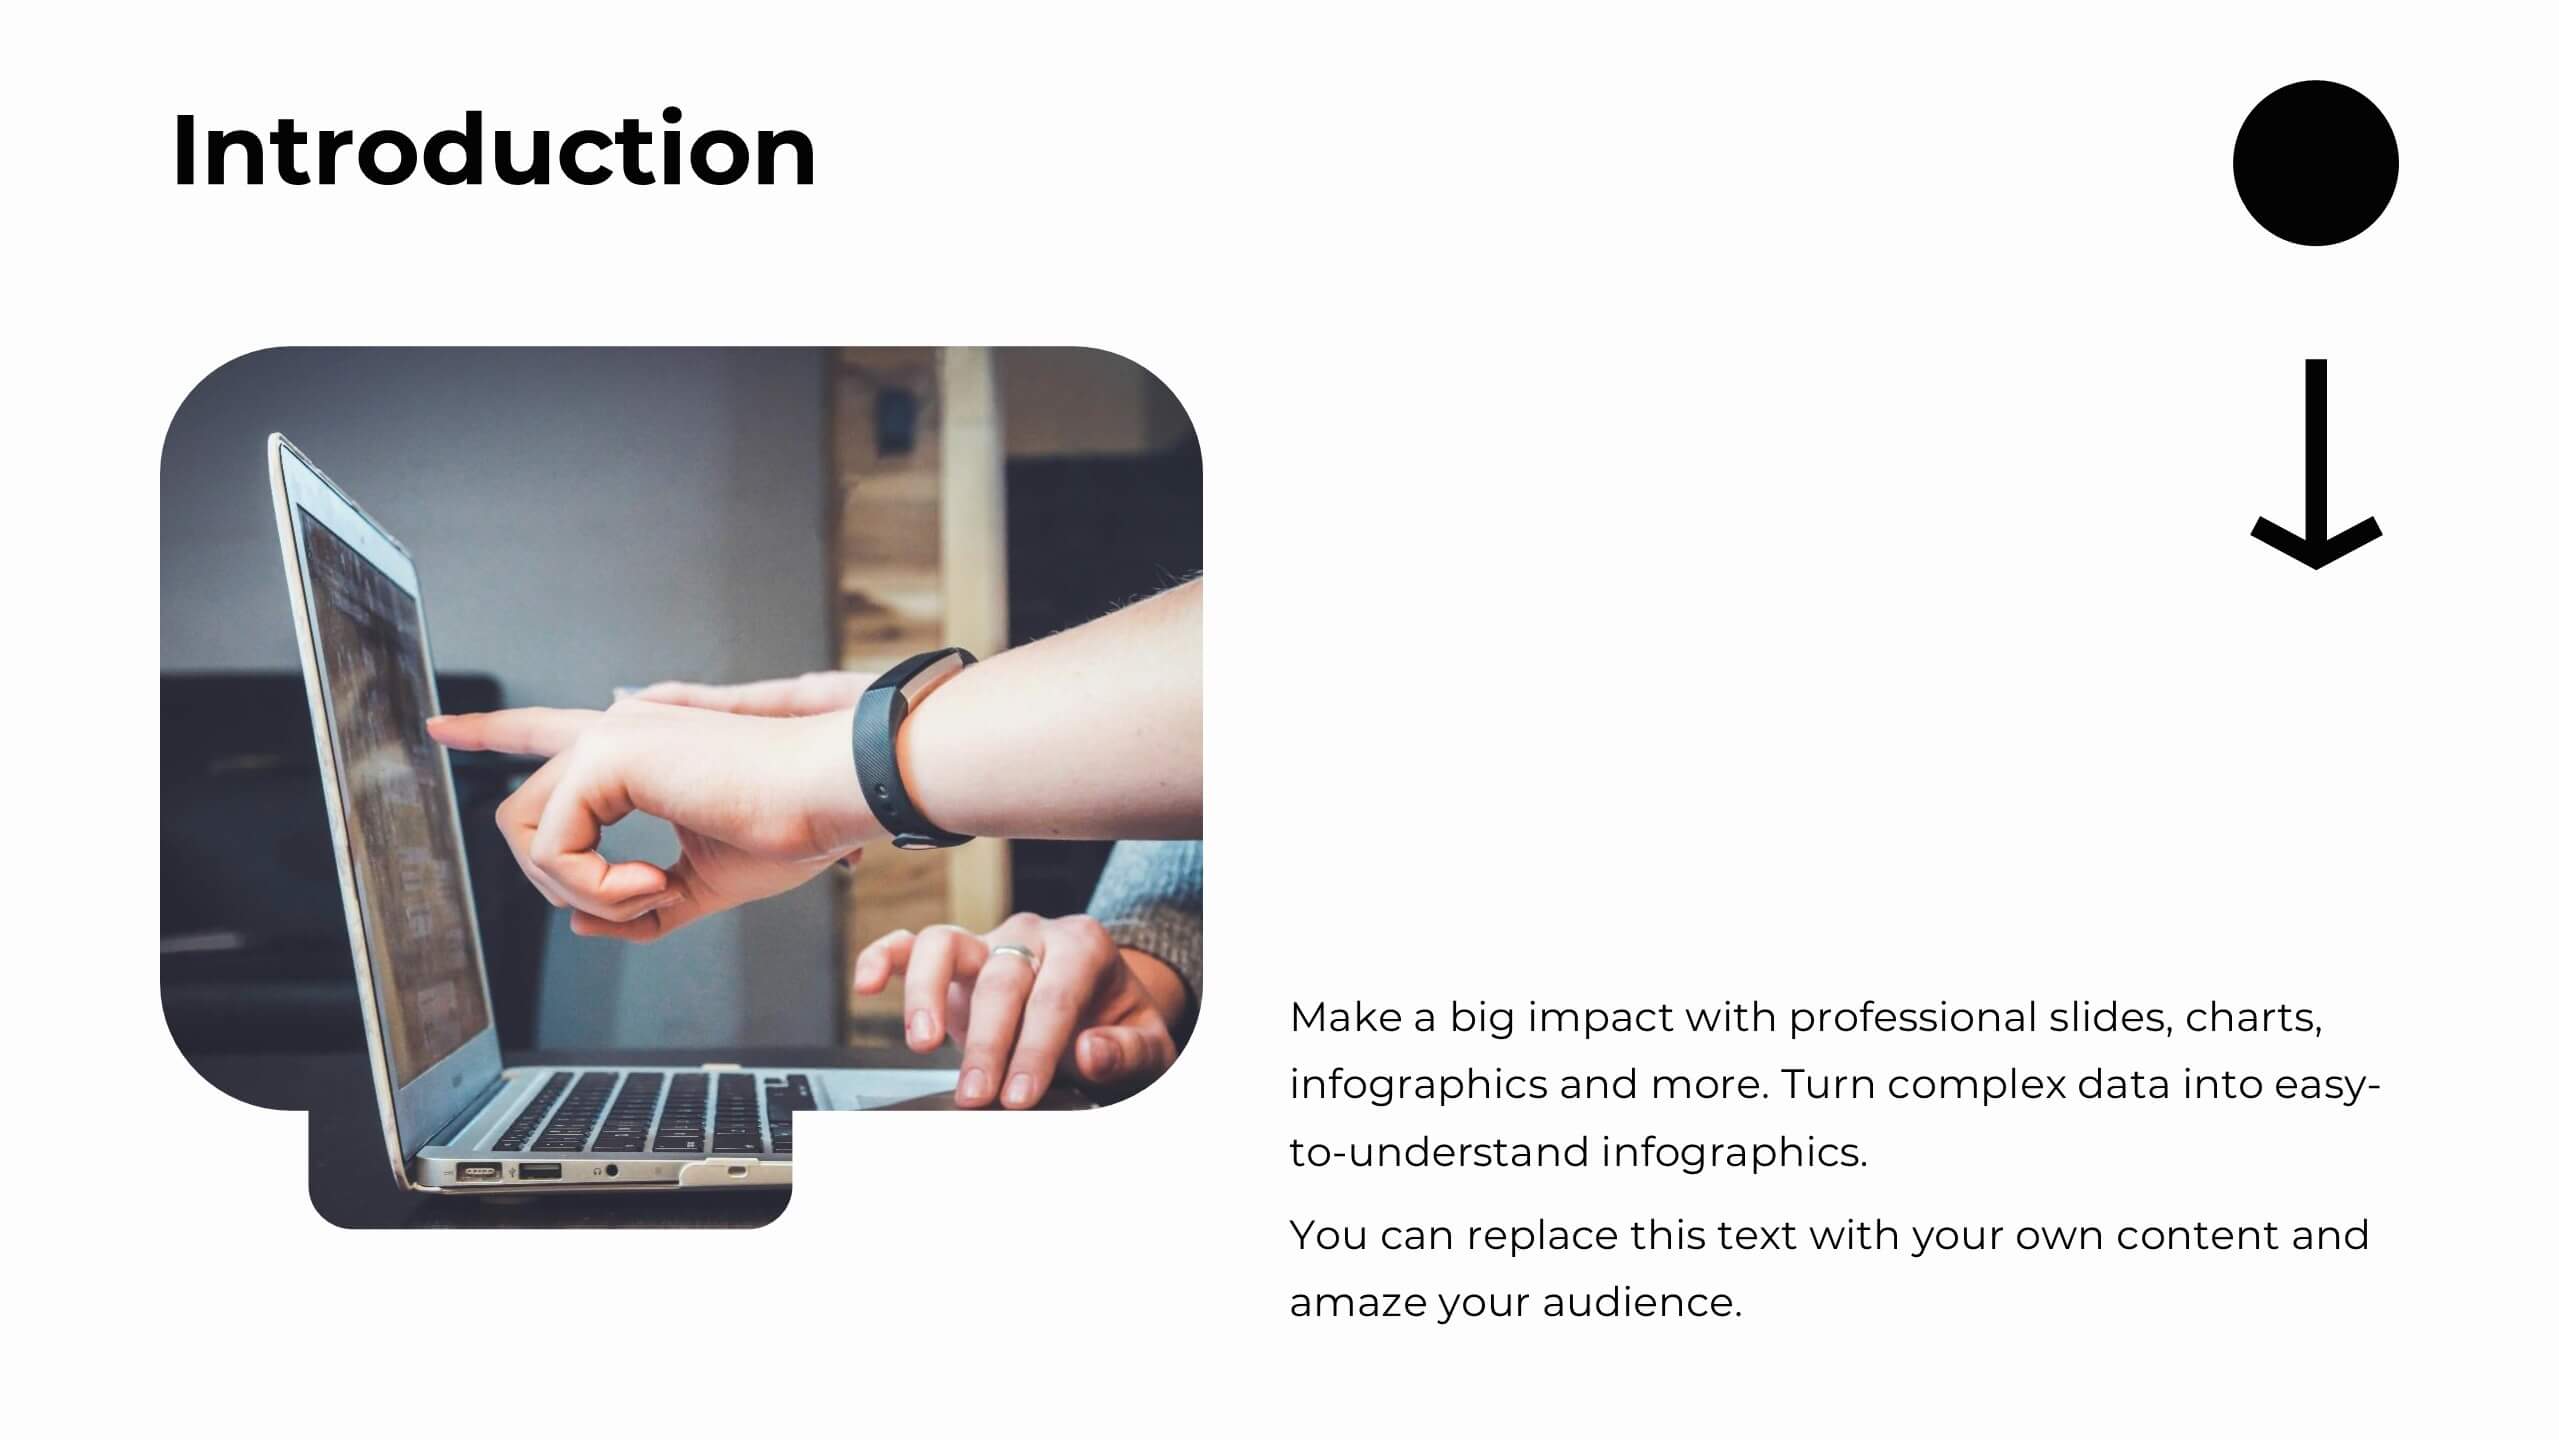
Our innovation Infographic template is a trendy and professional way to present innovation to your audience in a way that keeps them engaged. This design features simple yet striking elements which will deliver your message, while the font and color scheme gives you that flexibility to personalize this template to your brand’s identity. We have designed this presentation template to help you create and deliver engaging content for your audience. It is a powerful tool that helps you build interest, generate leads and position yourself as an authority on the subject of innovation.


22 slides
Crystal Business Plan Presentation
This business plan template is ideal for presenting strategies, conference overviews, and session details. With slides for keynote speakers, breakout sessions, and networking breaks, it offers a dynamic and professional layout. Compatible with PowerPoint, Keynote, and Google Slides, it ensures a clear and organized flow for any business presentation.


7 slides
Challenge Infographic Presentation Template
Our Challenge Infographic template is designed for conveying the challenge, purpose, problem and solution of an issue. This template is perfect for presenting ideas and plans on any topic from business to education. It features a clean design that allows you to highlight your ideas with confidence. With this template, you will make your data stand out with a variety of charts, graphs and text to create contrast and guide the audience through your message. Our template is compatible with powerpoint and gives you the ability to customize all of the text boxes, colors and any other elements.


6 slides
Sales Strategy 30-60-90 Day Plan Presentation
Drive sales success with this structured 30-60-90 day strategy template! Designed to help sales teams and professionals set clear objectives, track progress, and optimize performance, this layout ensures a smooth transition from planning to execution. Fully customizable and compatible with PowerPoint, Keynote, and Google Slides for seamless presentations.


7 slides
Product Life Cycle Infographic
Illuminate the journey of a product from its inception to its eventual decline with our product life cycle infographic. Streamlined to convey the critical phases of a product's life in the market, this infographic weaves a tale from the introduction, growth, maturity, to the decline stages, enabling viewers to grasp the nuances of each phase effortlessly. The base color is a clean, neutral white, with varying shades of blue to ensure consistency and clarity. The additional burst of colors helps differentiate each stage, making the information easily digestible at a glance. Compatible with PowerPoint, Keynote, or Google Slides.


24 slides
Machina UX Design Presentation
The UX Design Presentation Template is tailored for user experience projects. Covering sections like user research, personas, wireframes, prototyping, and usability guidelines, it offers a clean, professional layout. Fully customizable and compatible with PowerPoint, Keynote, and Google Slides, it's perfect for showcasing your design process and insights with clarity.


10 slides
Workplace Health and Safety Guidelines Presentation
Present your safety protocols with clarity and impact using this circular infographic layout. Ideal for showcasing four key safety principles, this slide design features a central helmet icon surrounded by safety icons, each paired with editable text boxes. Perfect for onboarding, training sessions, or compliance updates. Fully customizable and compatible with PowerPoint, Keynote, and Google Slides.
6 slides
Performance Tracking Using OKRs
Visualize your team’s progress across people, process, and products with this OKR-focused performance tracking slide. Designed for managers and leaders aiming to align execution with key results. Compatible with PowerPoint, Keynote, and Google Slides for full customization.


6 slides
SCAR Process Model Presentation
The "SCAR Process Model" presentation template provides a clear visualization of the SCAR (Supplier, Corrective, Action, Request) model, designed to help professionals manage and enhance supplier relationships effectively. Each quadrant of the template is dedicated to one of the SCAR components, neatly arranged around a central hub, symbolizing the interconnected nature of these processes. The circular layout facilitates the understanding of how each component influences the others, leading to a more streamlined approach in handling supplier interactions and corrective actions. This template is perfect for presentations in supply chain management, operational reviews, and strategic planning meetings, offering a practical framework for discussing and planning effective supply chain strategies.


7 slides
Timeline Logistics Infographic
A timeline infographic is a visual representation of the history of your company, product or service. This infographic template is the perfect way to show off your knowledge of a subject while also making it easy for your audience to digest all the information you've presented on hand. This infographic can be used to show the growth of your business. It’s also a great way to show the growth of your career. This template is simple and easy to use, but it’s also very powerful. You can add any icons you want and customize any text on the infographic. Compatible with Powerpoint, Keynote, and Google Slides. This is perfect for any occasion!
23 slides
Zirconium Strategic Planning Report Presentation
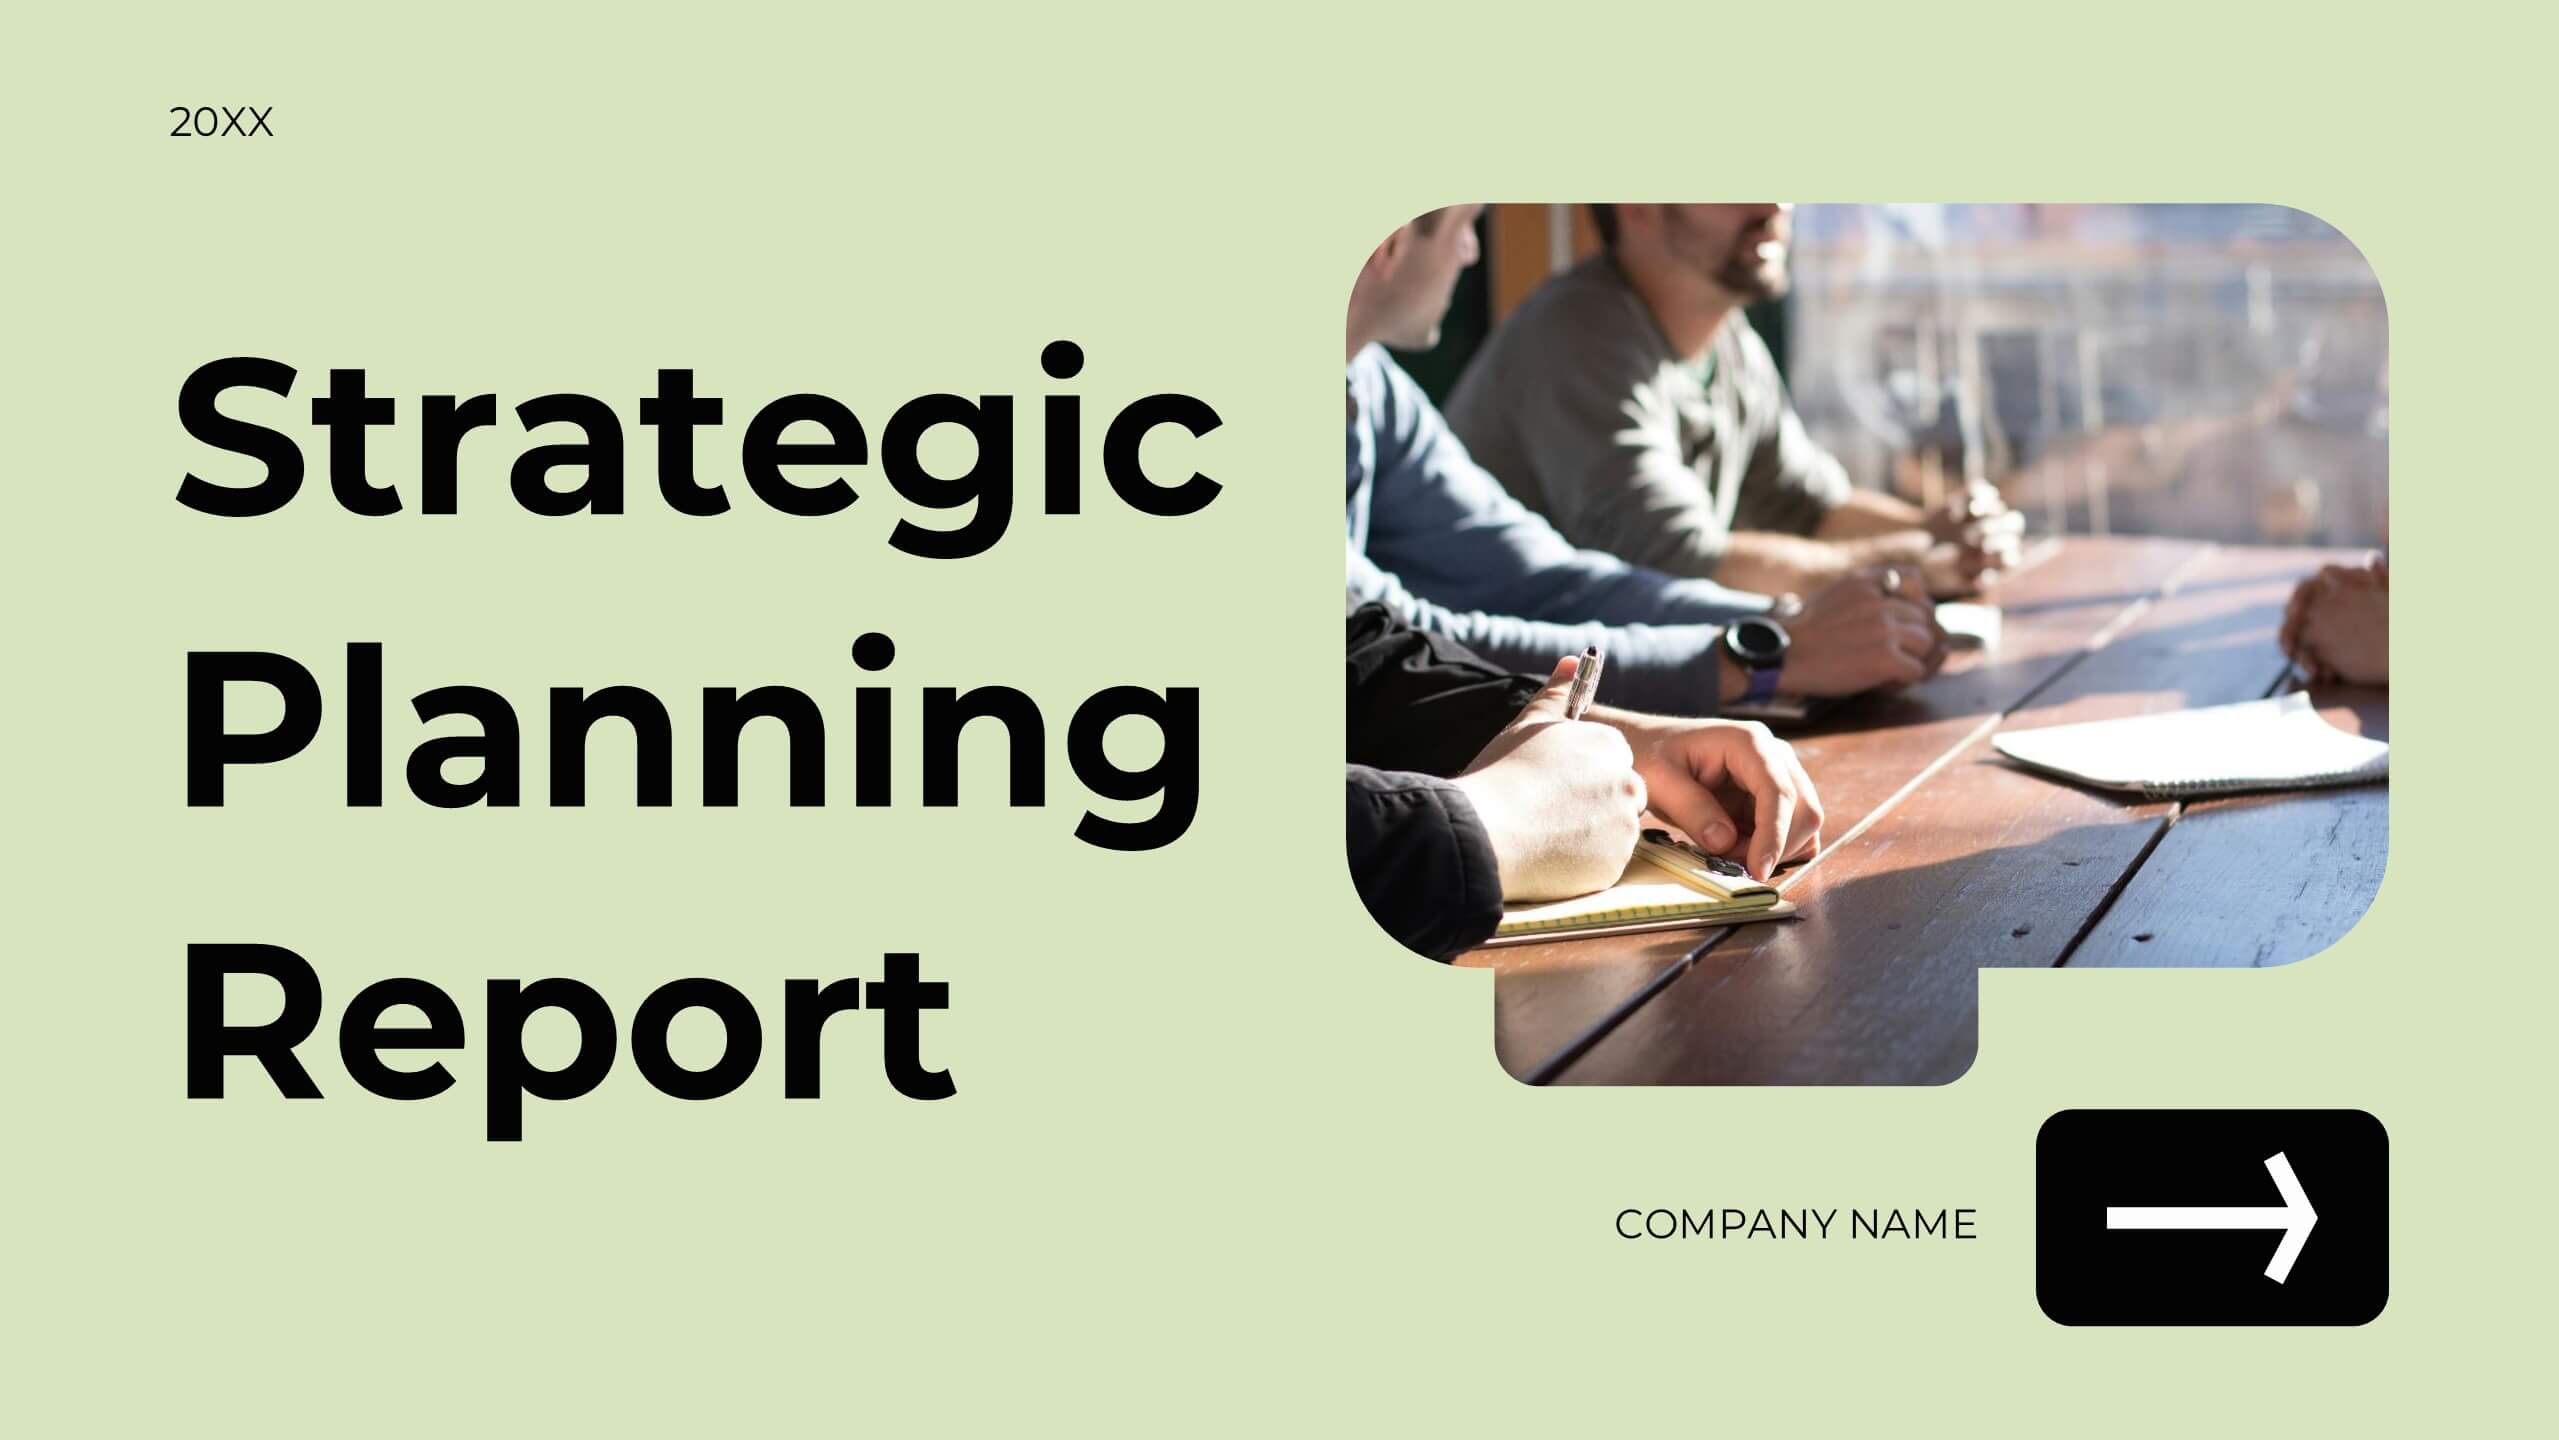
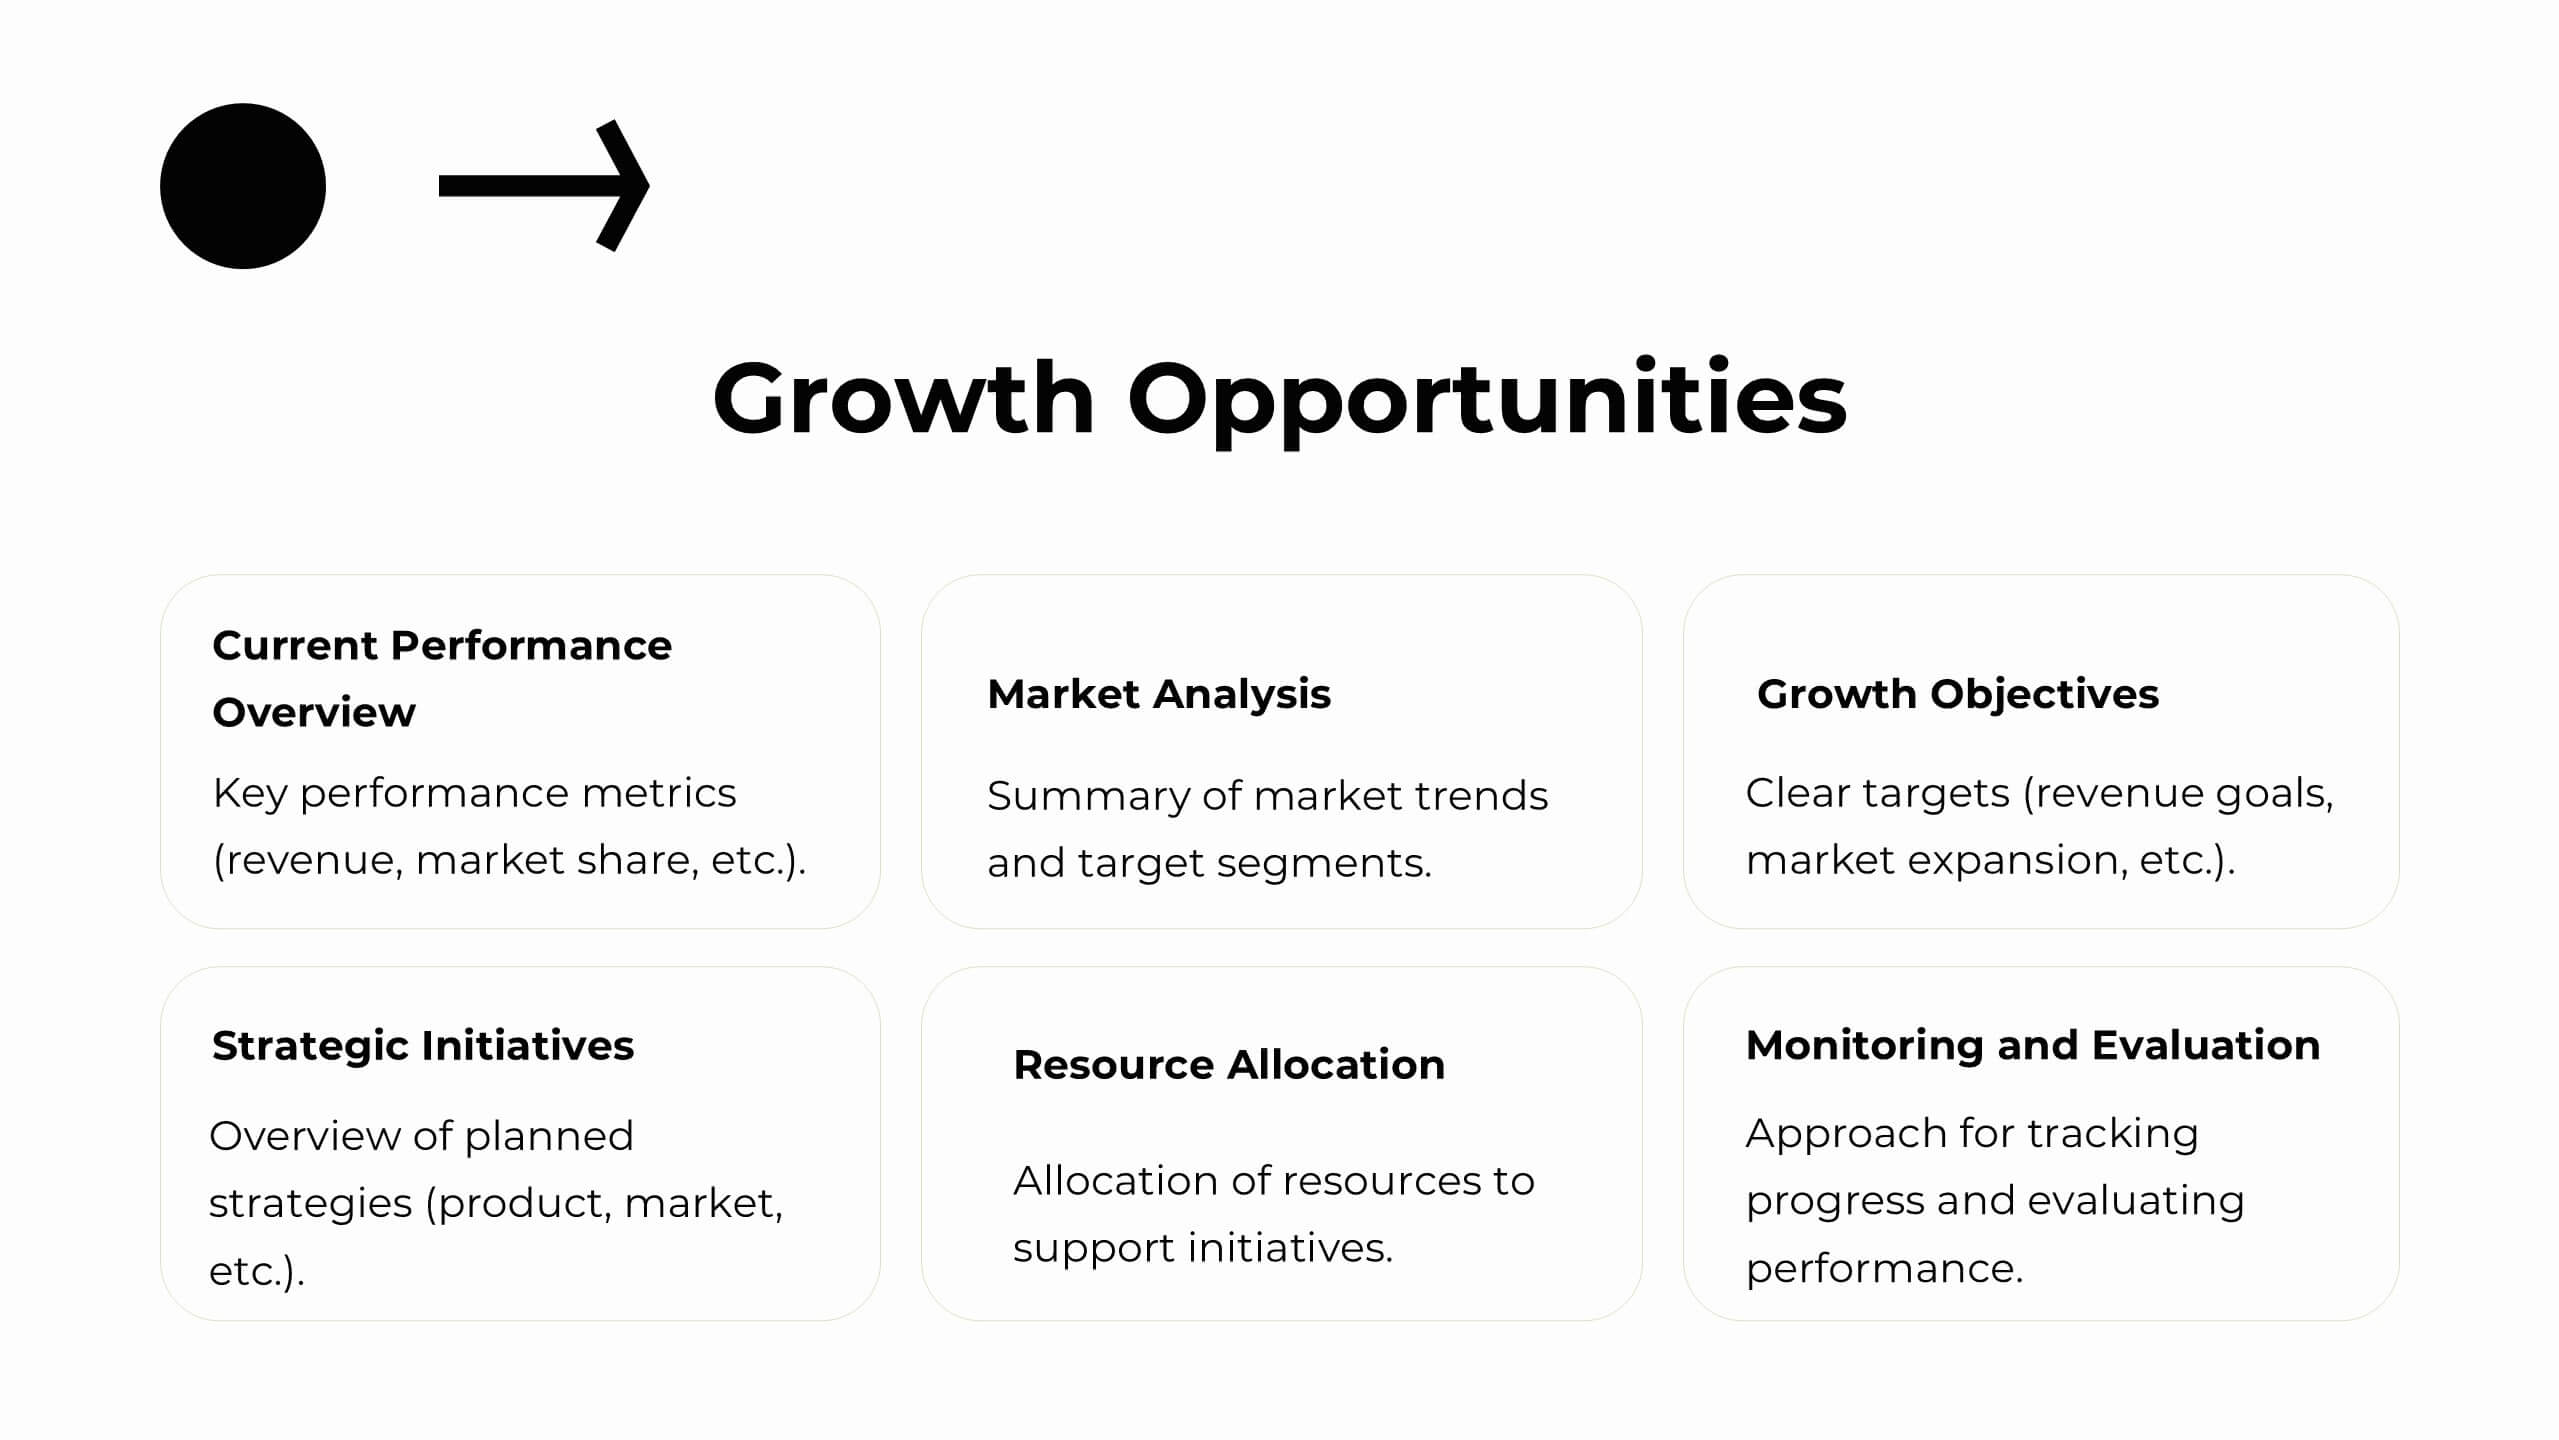
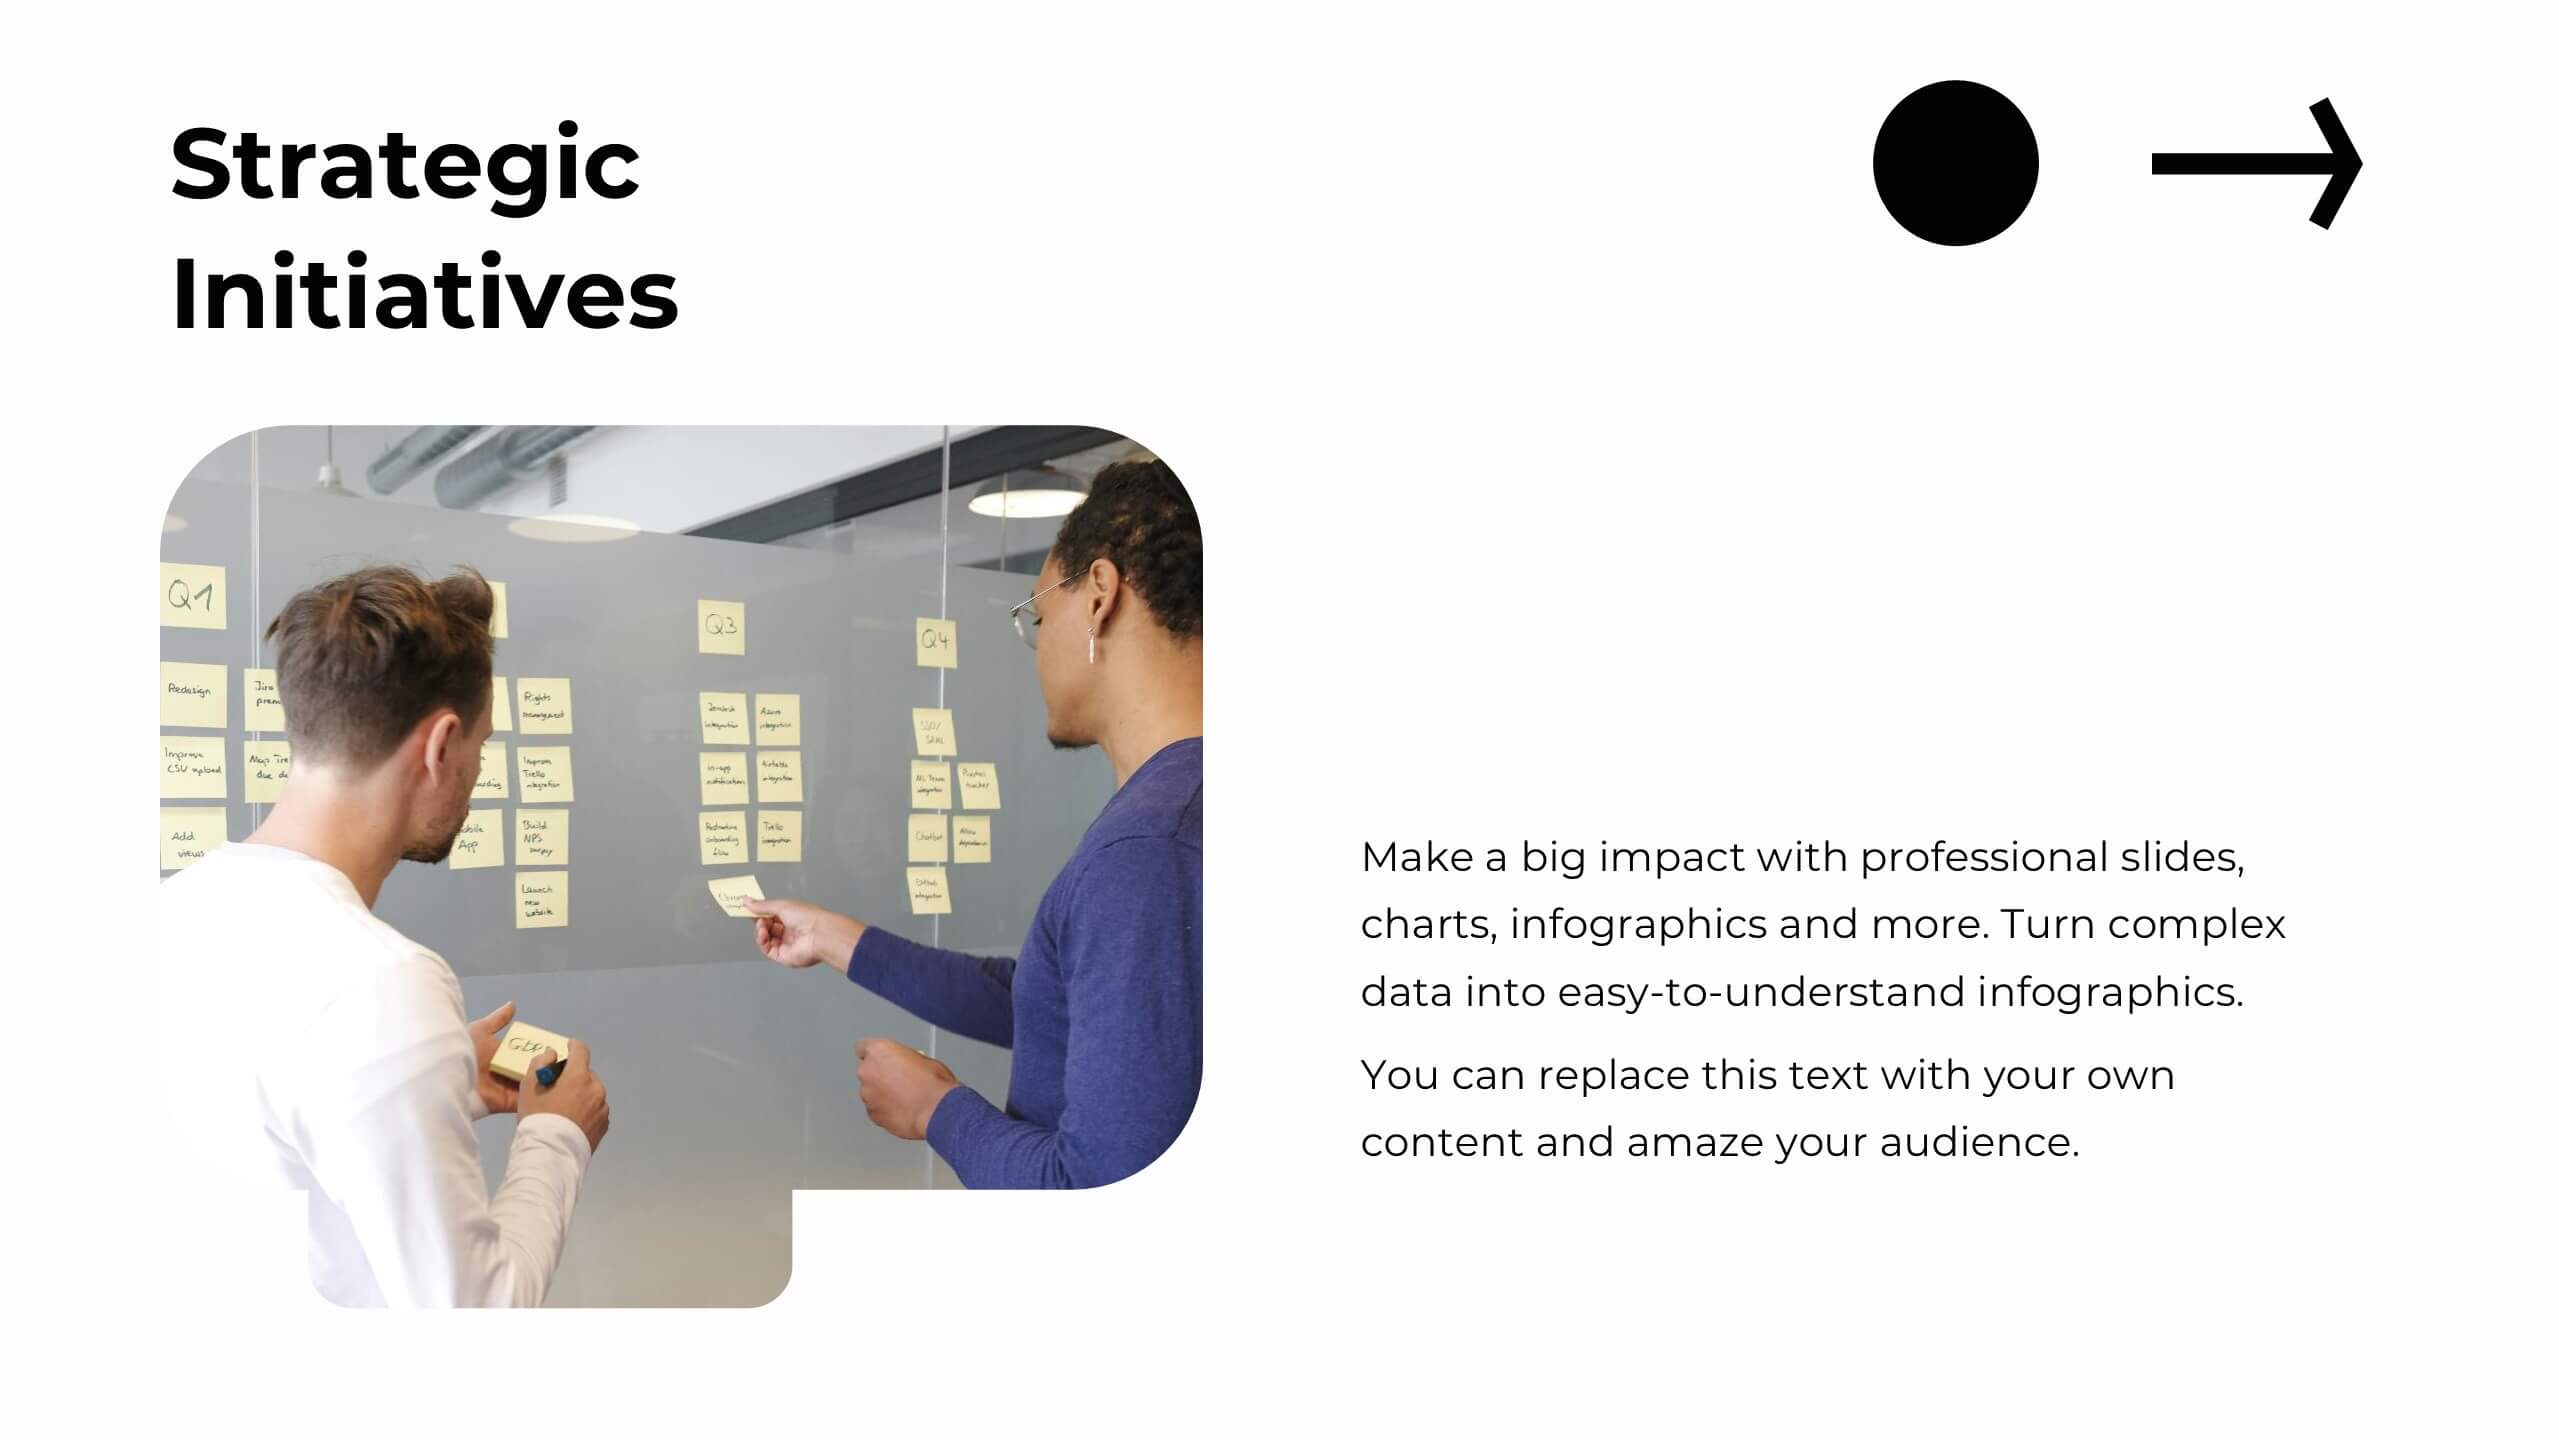
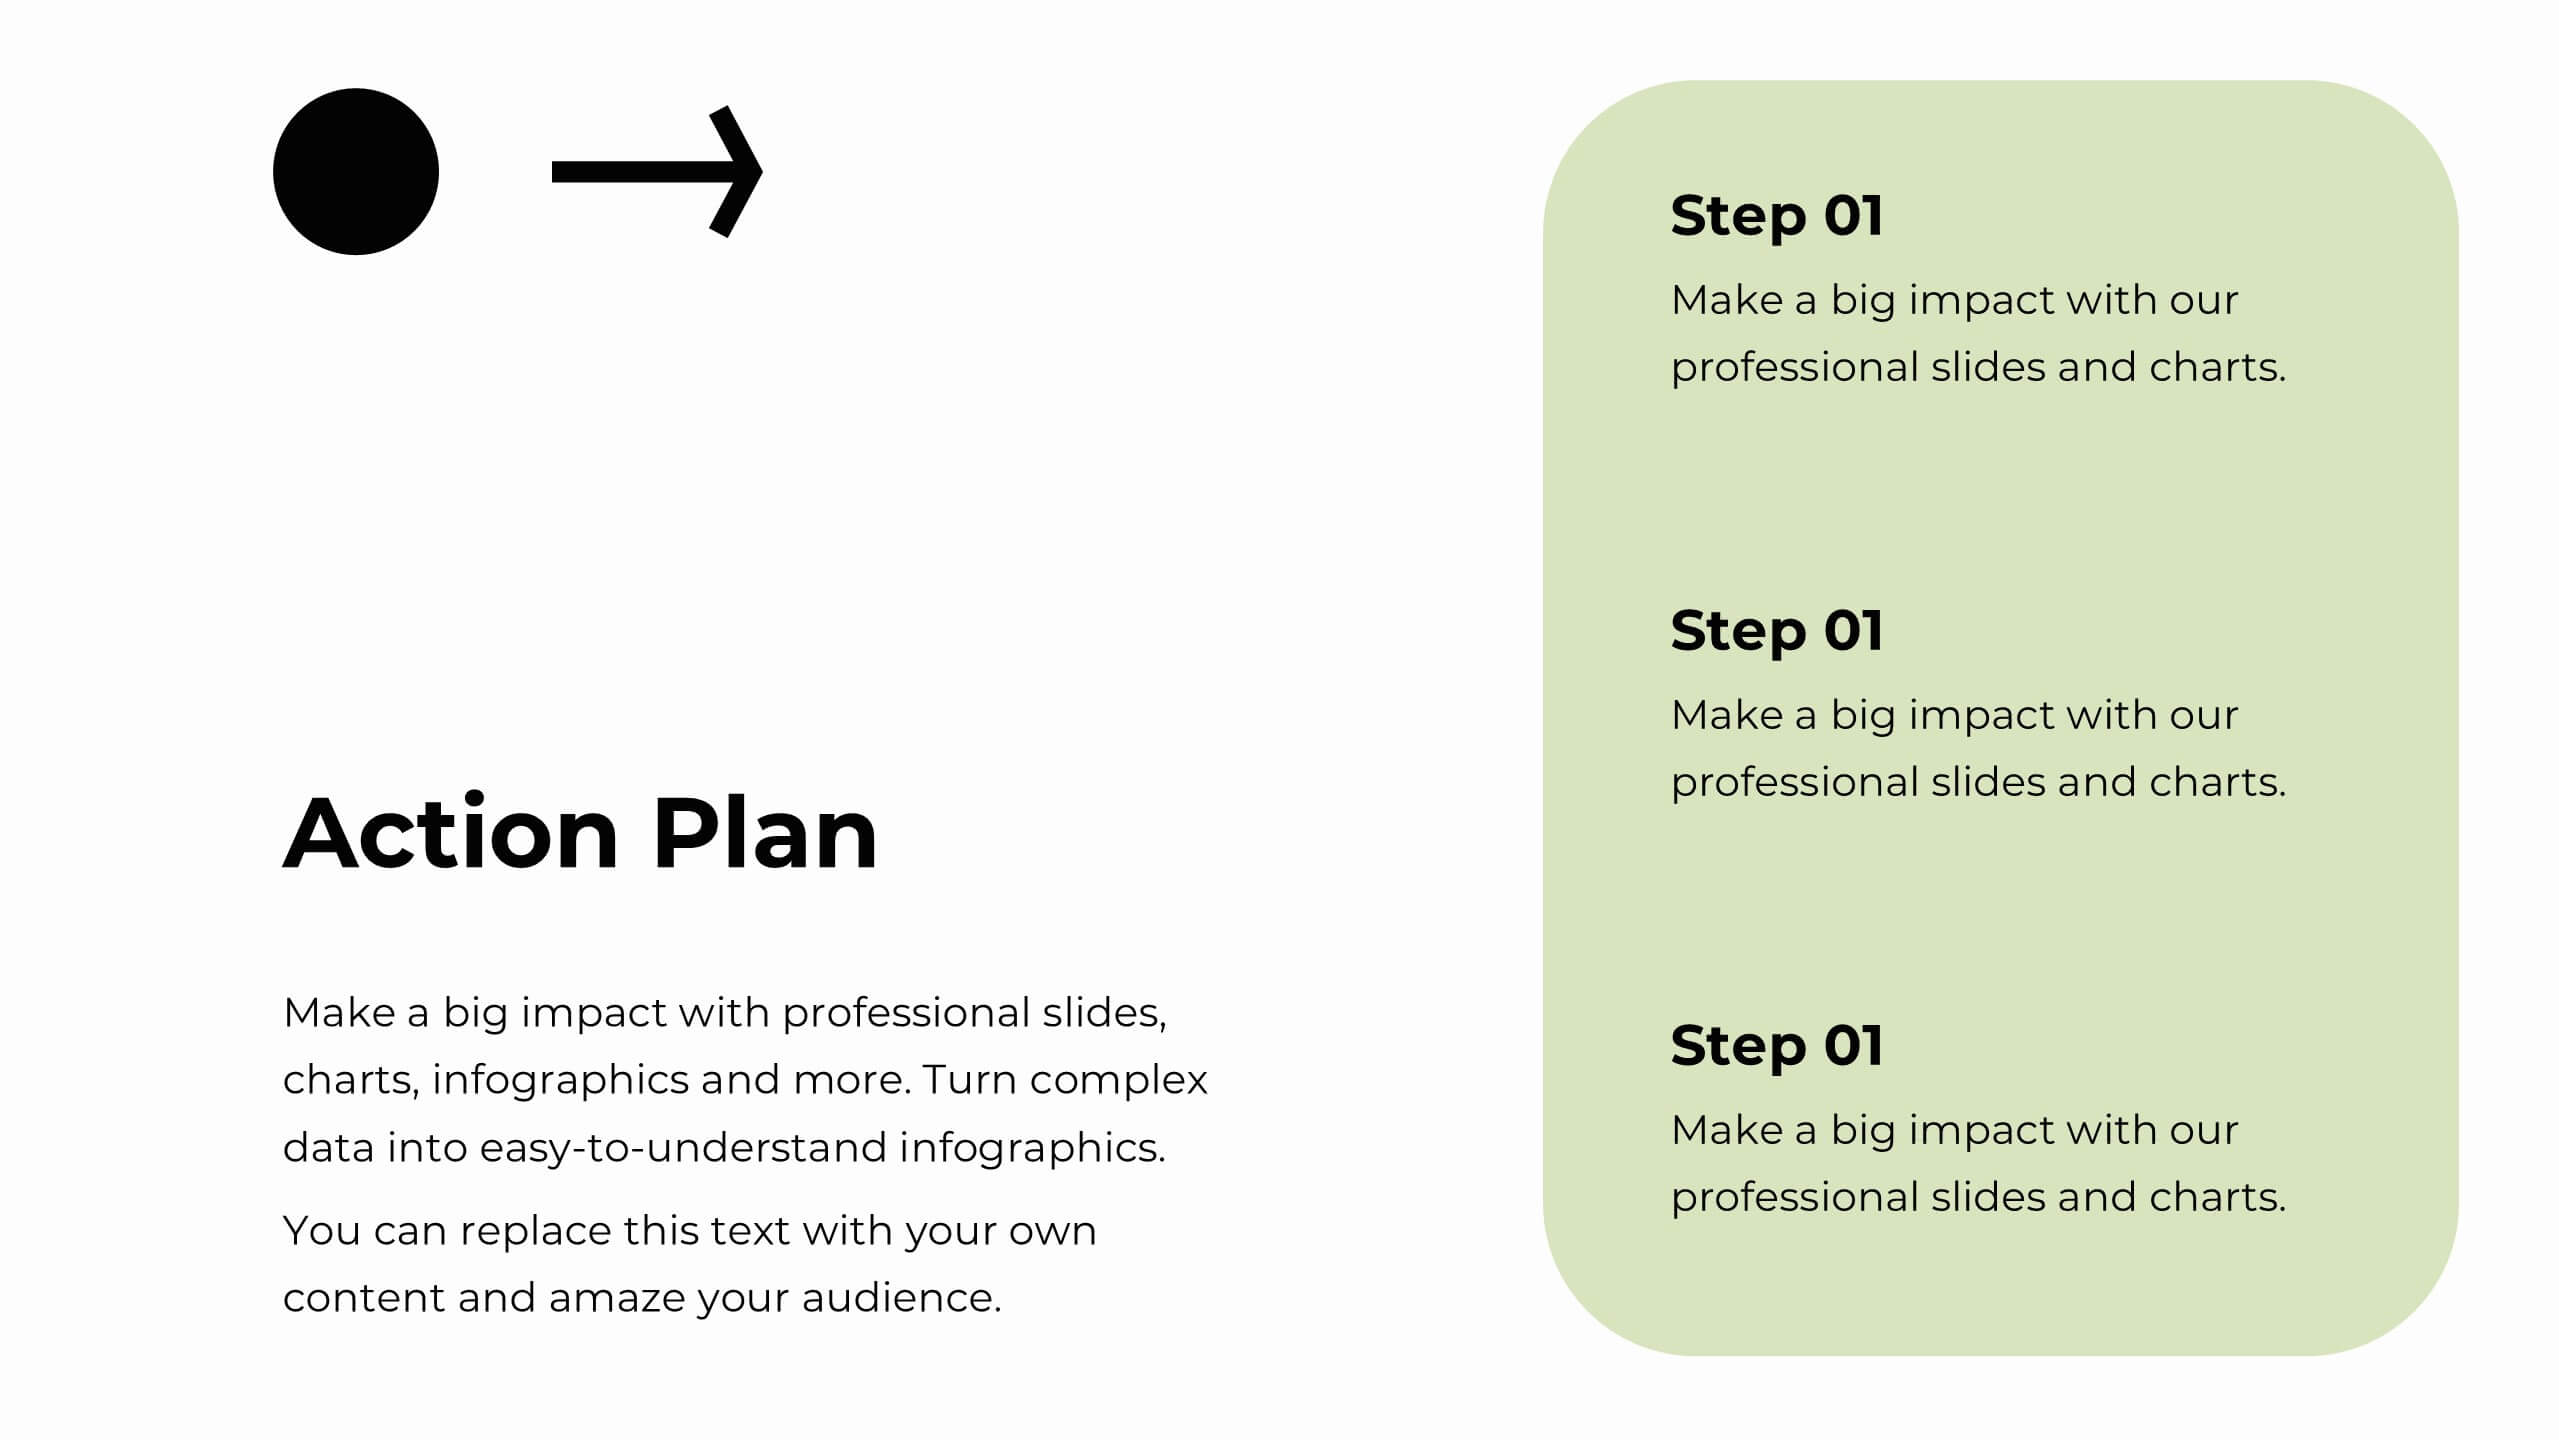
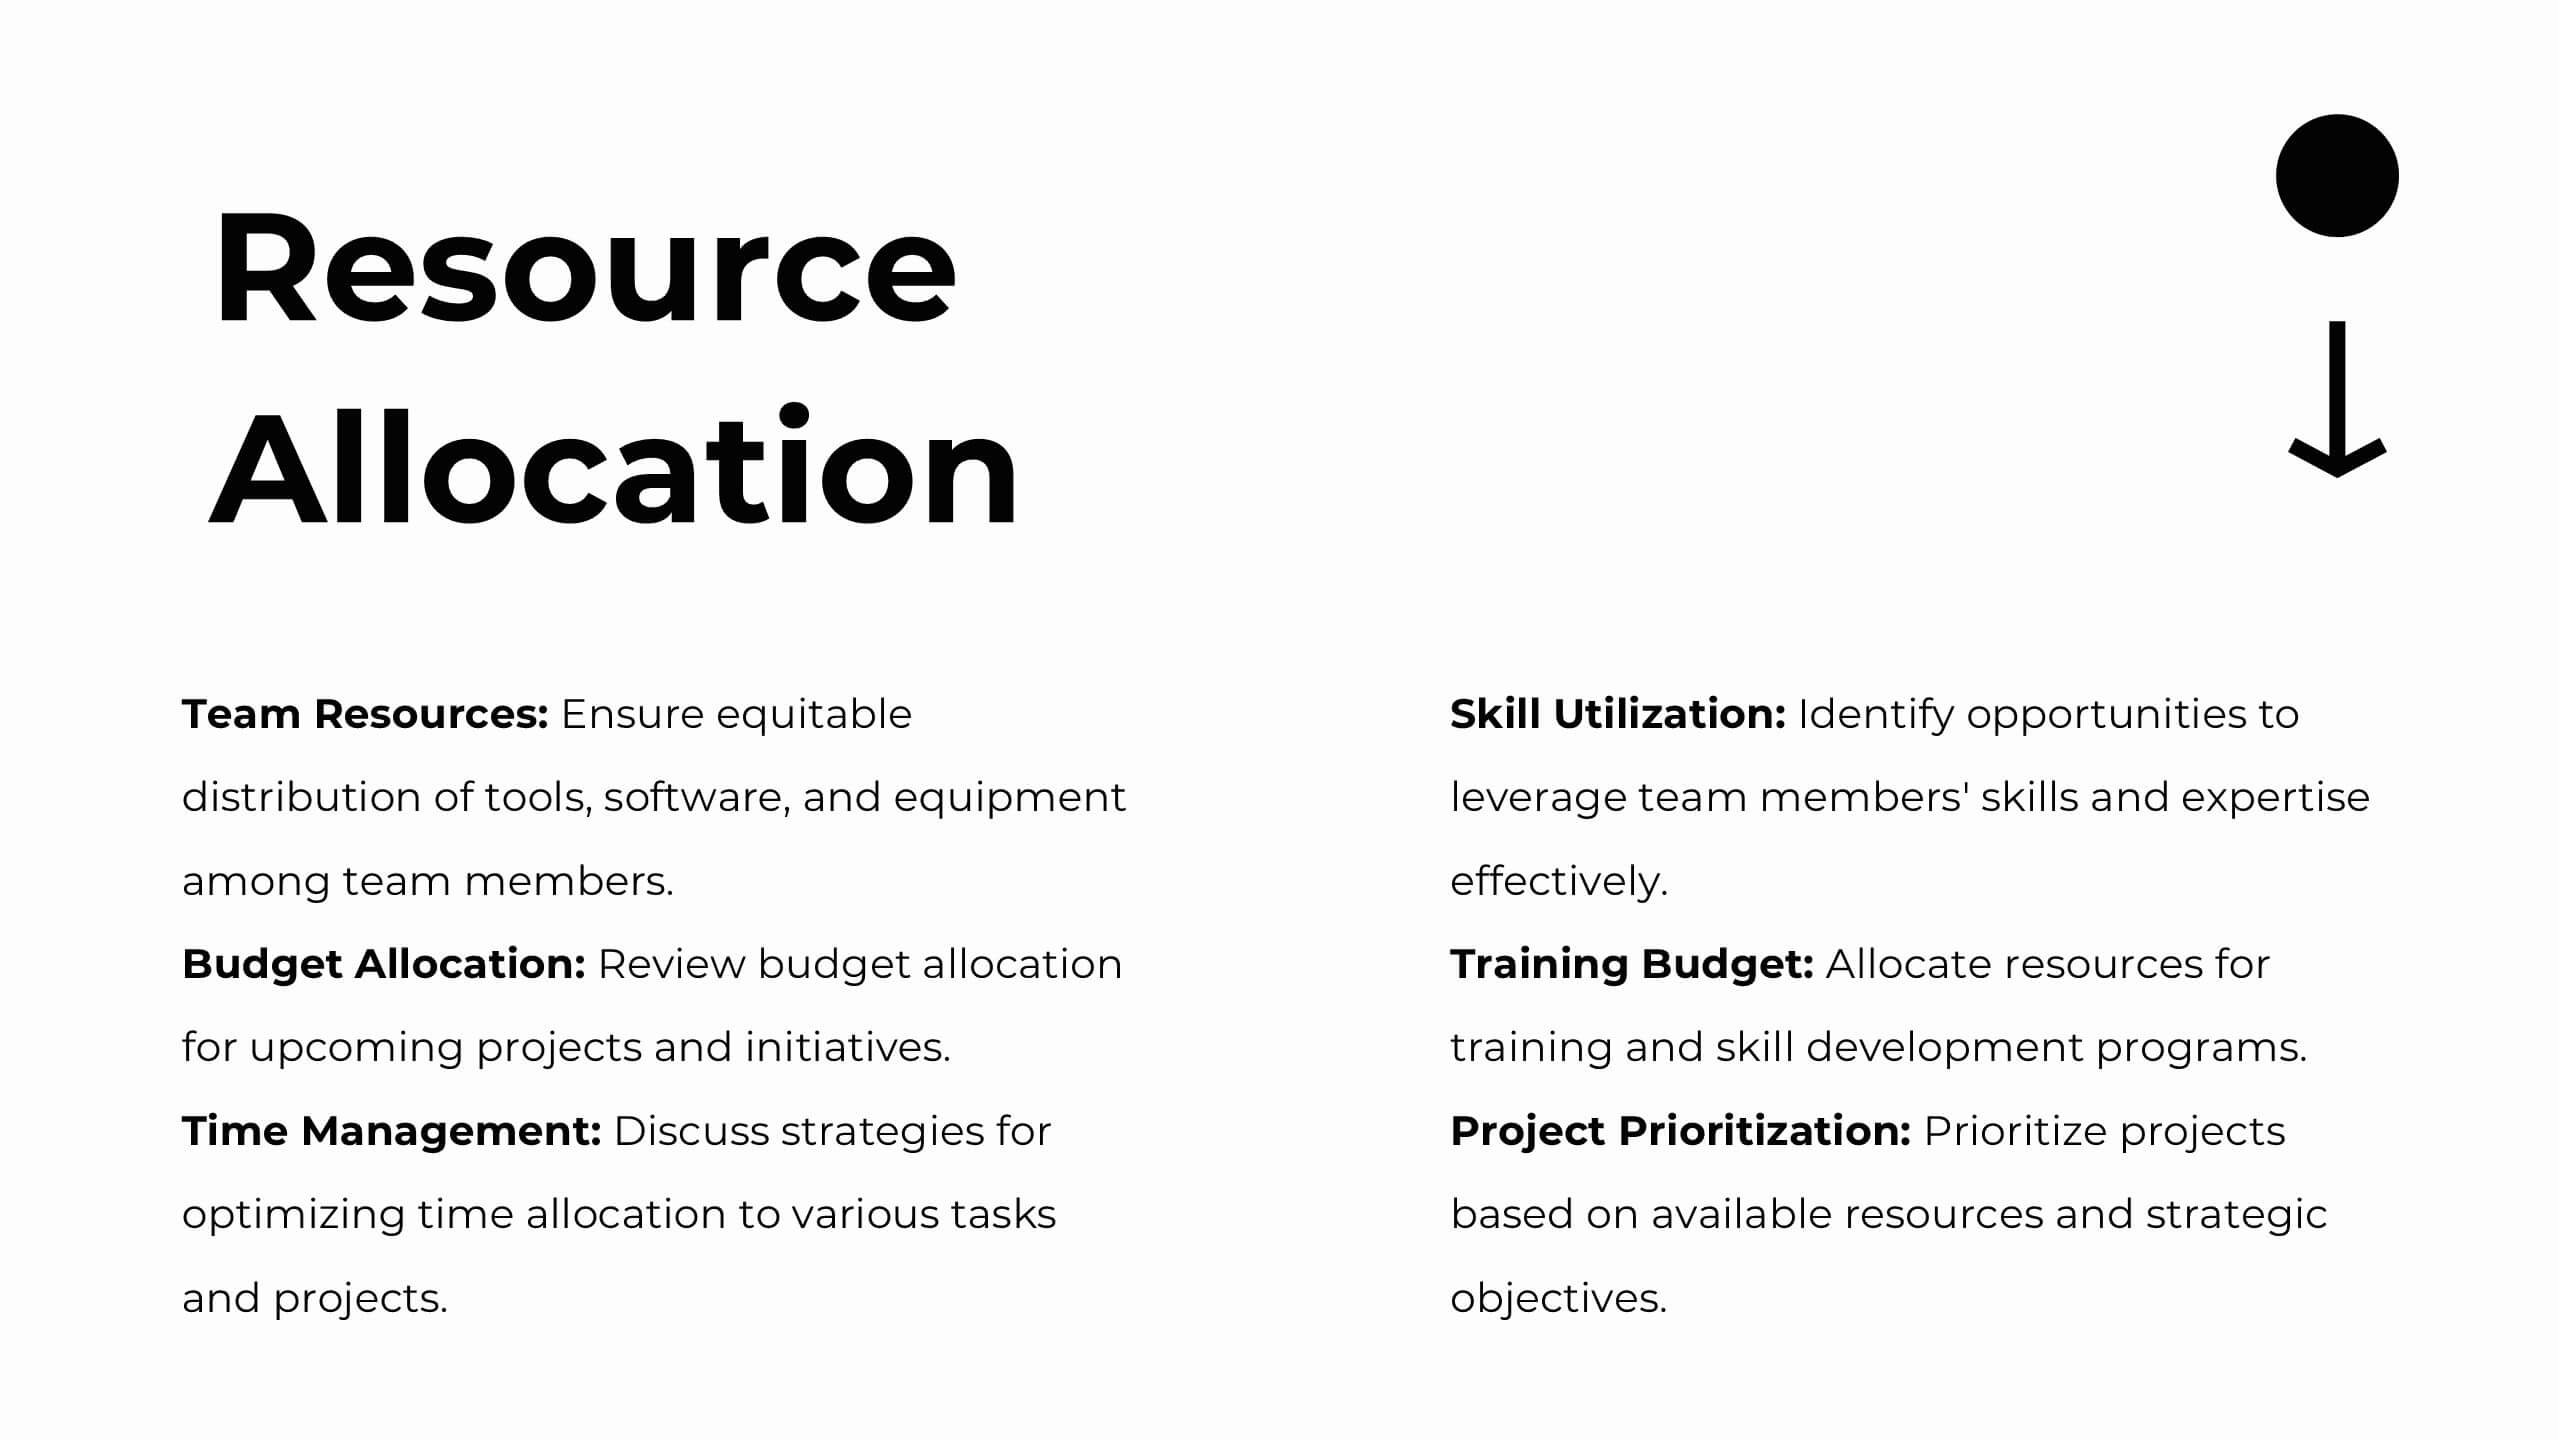
Plan and present your strategies with precision using this comprehensive strategic planning report template! Designed for clear communication of goals, market trends, SWOT analysis, and growth opportunities, it’s perfect for aligning team objectives and driving success. Fully customizable and compatible with PowerPoint, Keynote, and Google Slides, this template is ideal for strategic initiatives and performance reviews.


5 slides
Editable World Map Infographic Presentation
Bring your global insights to life with this clean, modern presentation designed to explain international data in a clear, engaging way. Visual markers and simple layouts help you highlight key regions, trends, and comparisons with ease. Fully compatible with PowerPoint, Keynote, and Google Slides.


6 slides
Hospital Management System Presentation
Bring structure and efficiency to your healthcare operations with this professional presentation. Designed to simplify complex hospital workflows, it helps visualize patient management, service coordination, and system processes with clarity. Ideal for administrators and consultants, it’s fully editable and compatible with PowerPoint, Keynote, and Google Slides for seamless customization.


10 slides
Profitability and Cost Analysis
Streamline your financial storytelling with this interlinked diagram template. Designed for business consultants, CFOs, and analysts, it helps visualize cost components and profit drivers across five stages. Each segment is clearly labeled and color-coded for easy comprehension. Fully customizable in PowerPoint, Keynote, and Google Slides.


4 slides
Break-Even Point Financial Analysis Presentation
Clearly define profitability with this break-even point financial analysis template. It visually maps costs, revenue, and profitability, helping businesses assess when they'll cover expenses and start making a profit. Perfect for financial forecasting and business planning. Fully customizable and compatible with PowerPoint, Keynote, and Google Slides for seamless editing and presentation.