


Features
- 6 Unique slides
- Fully editable and easy to edit in Microsoft Powerpoint, Keynote and Google Slides
- 16:9 widescreen layout
- Clean and professional designs
- Export to JPG, PDF or send by email


Do you have any questions?
Recommend


6 slides
Table of Content Layout Presentation
Kick off your presentation with a clean, modern layout that instantly guides your audience through each section with clarity and style. This design highlights key topics in a structured, easy-to-follow sequence, making navigation simple and intuitive. Fully compatible with PowerPoint, Keynote, and Google Slides for seamless use.


25 slides
Company Profile Presentation
Embark on a corporate expedition with a comprehensive view into the essence of our company, where every segment unfolds our identity, goals, and the values that steer our journey. Meet the dynamic team at the helm, diverse minds and talents crafting the future with innovation and dedication. Navigate through our strategic roadmap, from humble beginnings to ambitious horizons, spotlighting our customer-centric approach that underpins every achievement. Witness our milestones arrayed in a timeline that speaks volumes of progress and resilience, punctuated by major leaps and bounds in our industry. Grasp our ethos, 'Customer Satisfaction is our Top Priority,' a mantra evident in each service we render and product we craft. Within these slides lies a story of growth, learning, and unyielding commitment to excellence. As we project the chart of our achievements, a pattern of steady ascension emerges, painting a picture of a company that not only dreams big but also acts with precision to materialize those dreams. This profile is more than a showcase—it's an invitation to explore the depths of our corporate narrative, and a thank you to all who join us on this remarkable venture.


21 slides
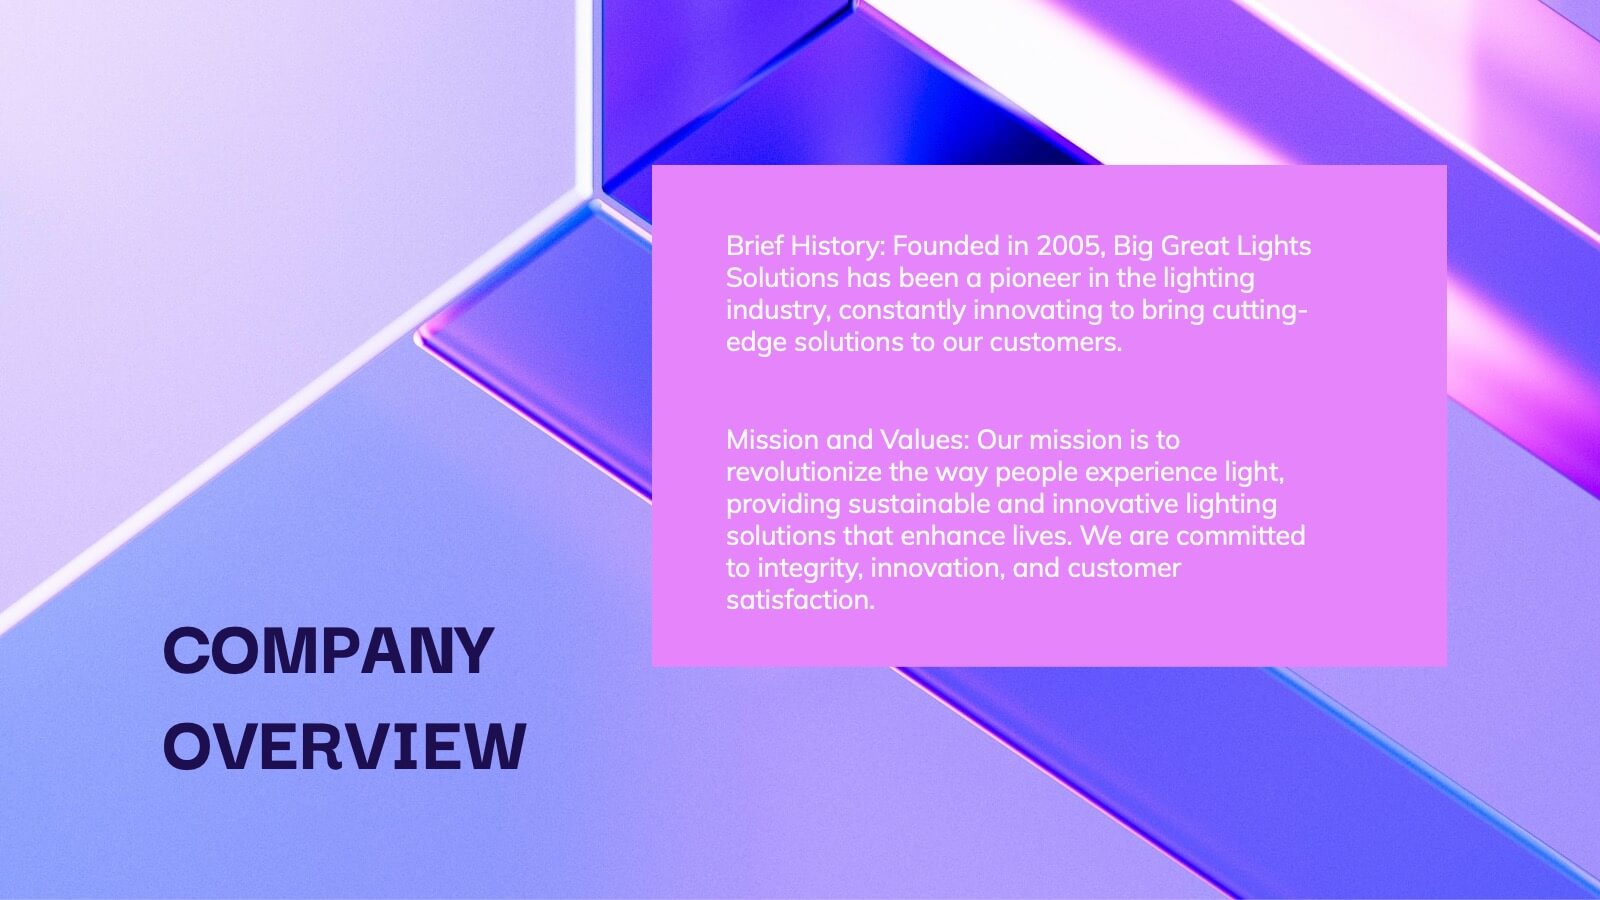
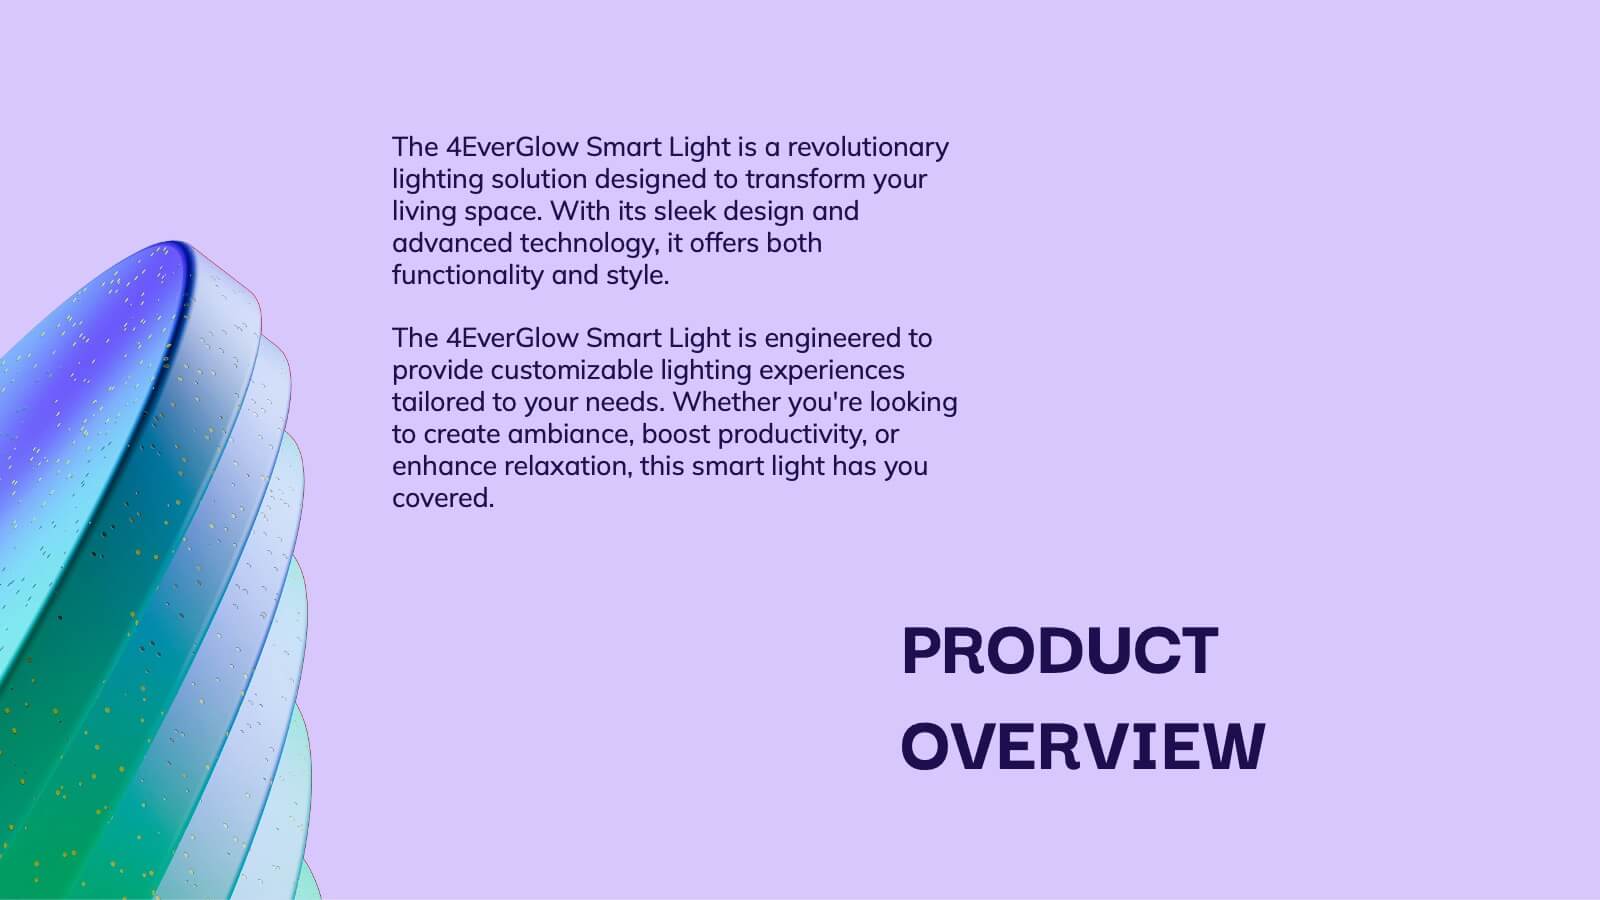
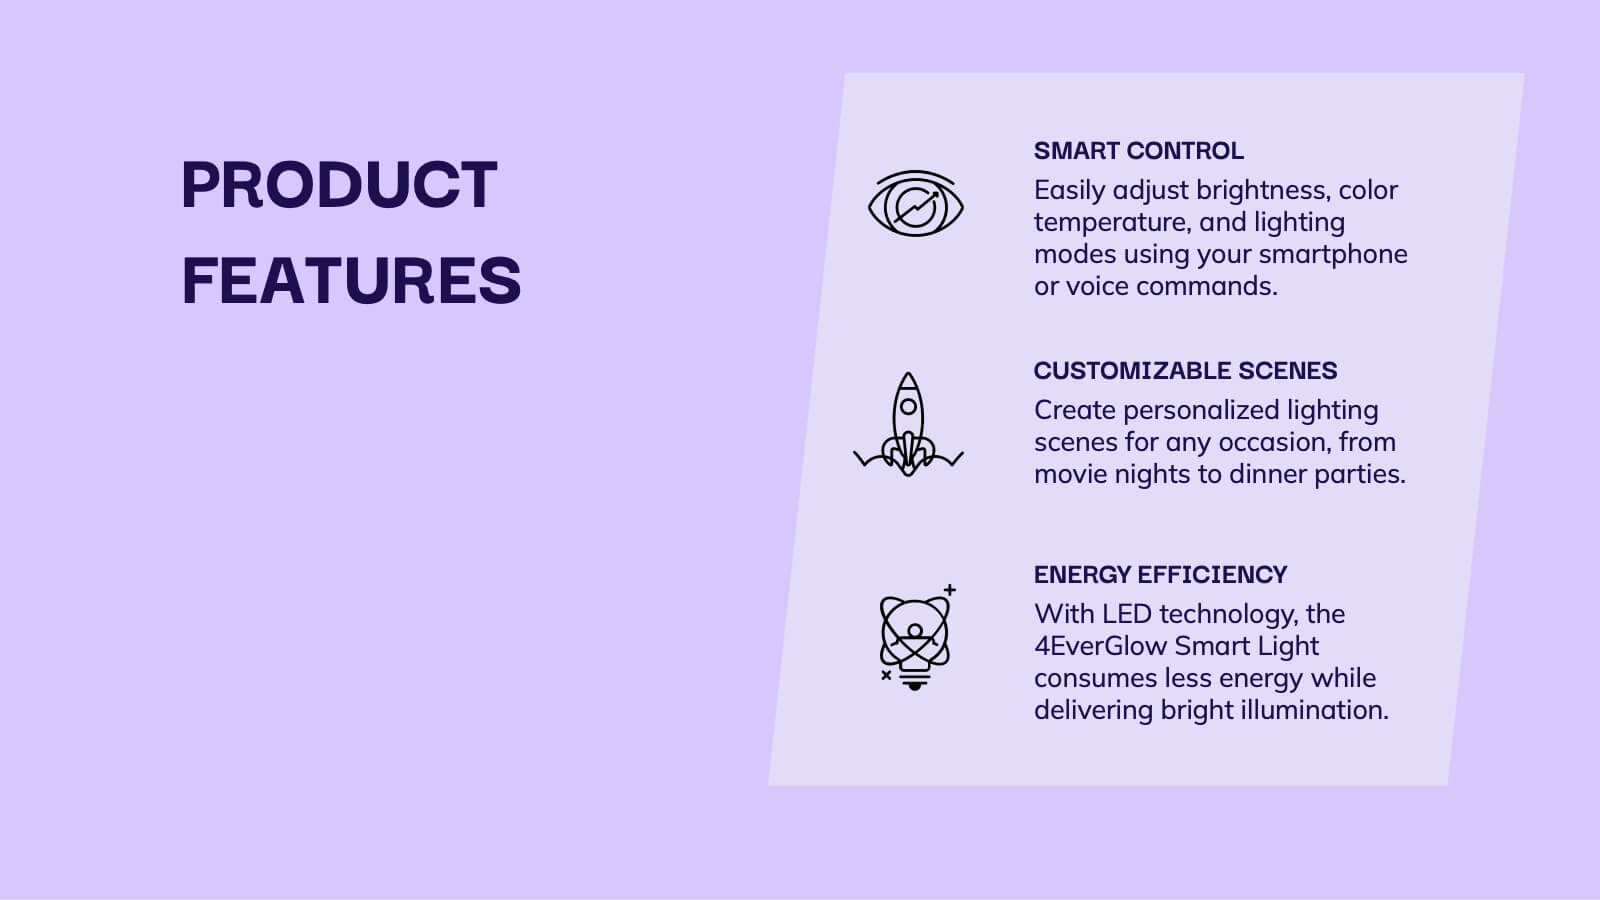
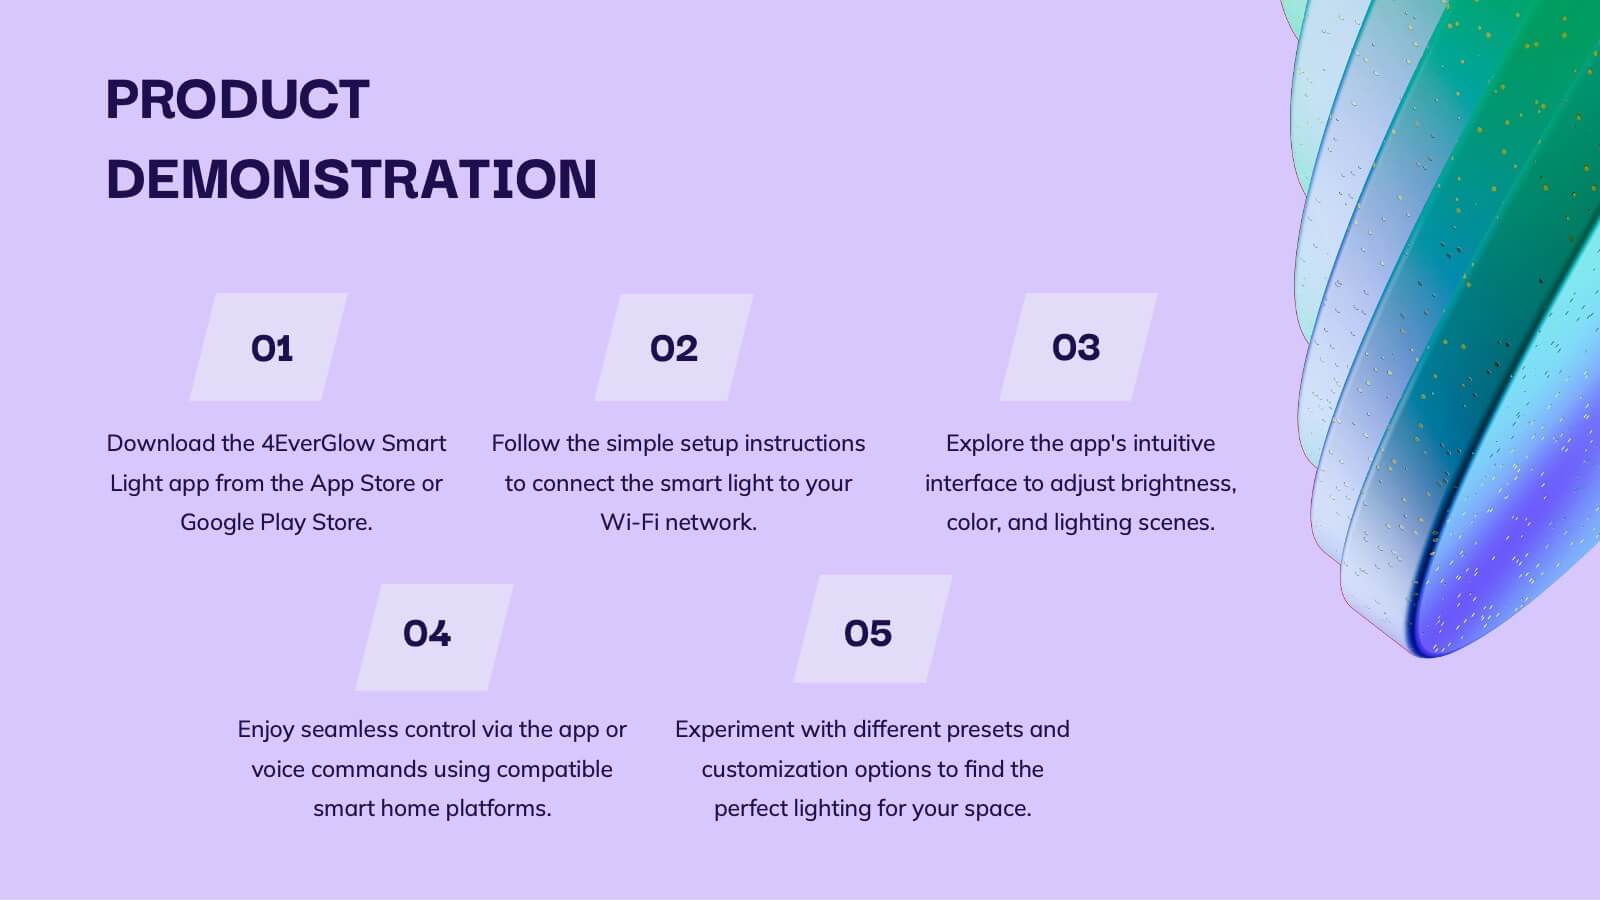
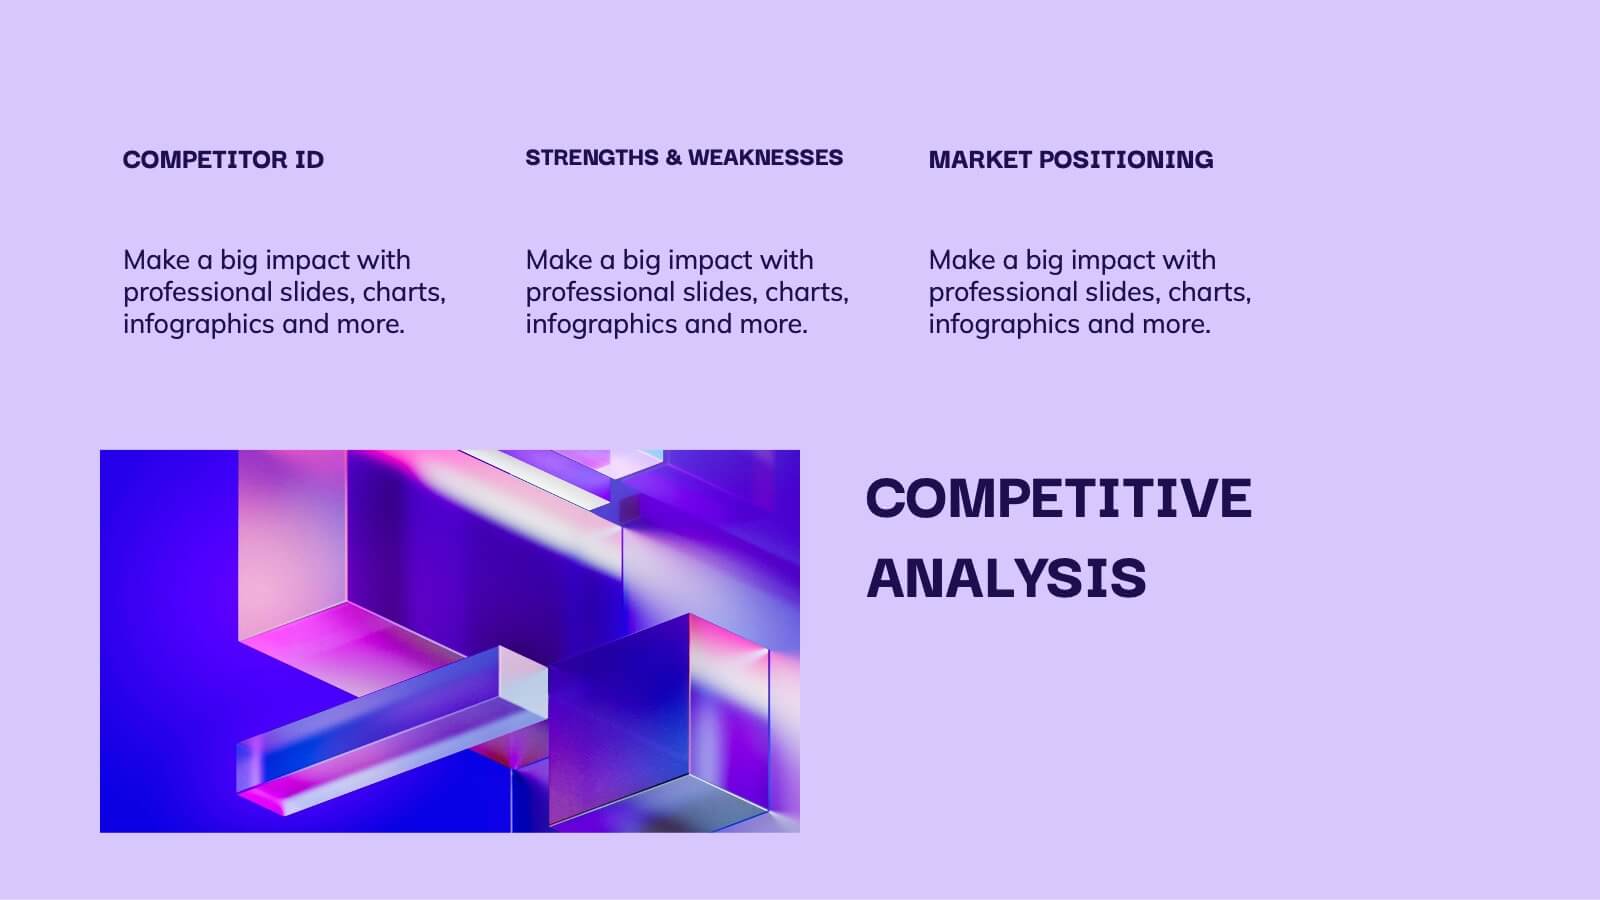
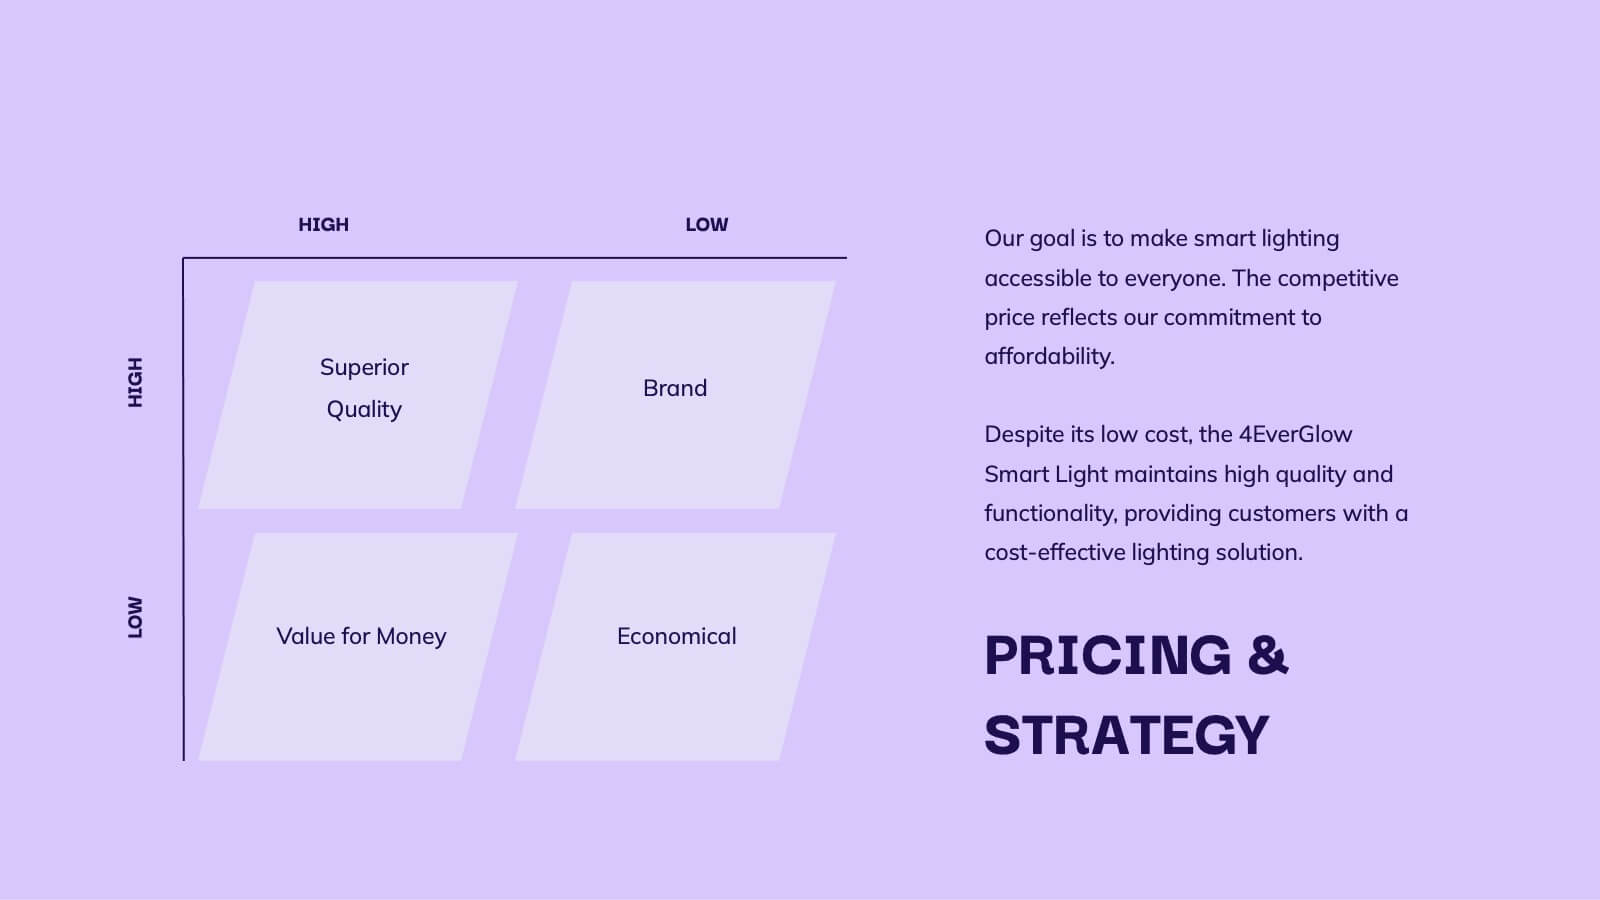
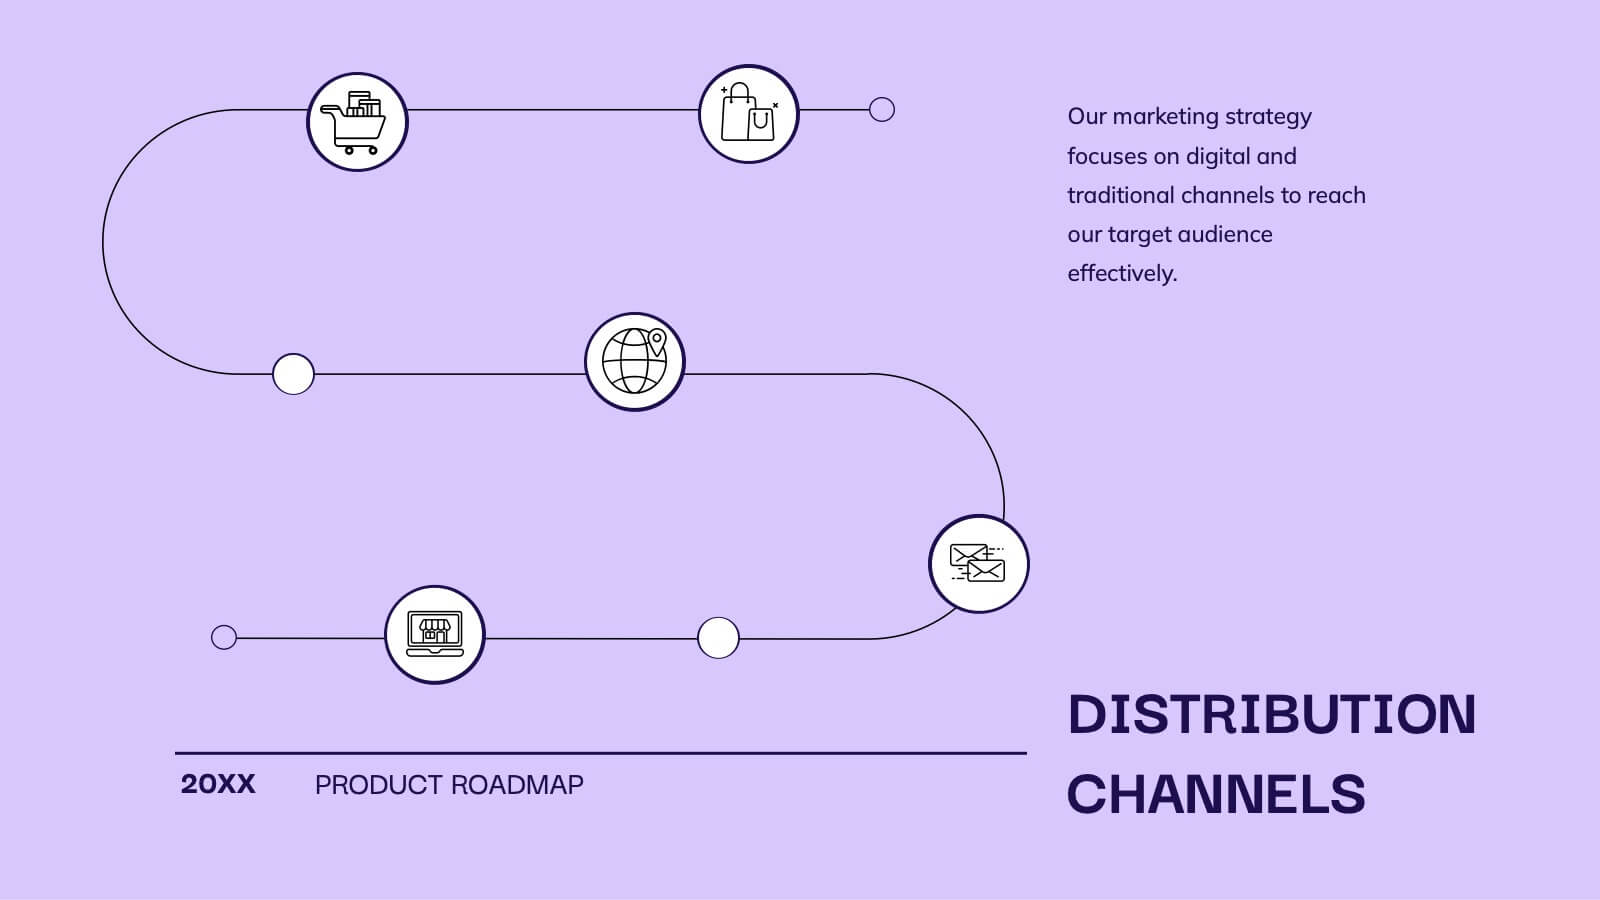
Glimmer Product Roadmap Presentation
Illuminate your product's future with this vibrant glimmer-themed presentation template! Perfect for outlining your product roadmap, it allows you to present key milestones, features, and timelines in a visually engaging way. Captivate your audience and keep them informed about your exciting journey ahead. Compatible with PowerPoint, Keynote, and Google Slides.


4 slides
Current Project Health and Status Report Presentation
Track progress with clarity using the Current Project Health and Status Report presentation slide. Featuring a modern clipboard layout with checkboxes and project tools like a pencil, magnifier, and ruler, this slide is perfect for highlighting task completion, pending issues, and project milestones. Ideal for weekly updates, stakeholder reviews, or status dashboards. Fully editable in PowerPoint, Keynote, and Google Slides.


4 slides
Comparative Assessment Using Harvey Ball Chart Presentation
Make your evaluations easier to understand with this Harvey Ball chart template. Designed for performance comparison, efficiency scoring, or feature benchmarking, this layout supports up to 4 items and 3 criteria. Each element is clearly visualized for quick decision-making. Fully editable in PowerPoint, Keynote, or Google Slides—ideal for business strategy, operations, or HR presentations.


10 slides
Watercolor Texture Infographic
Watercolor texture refers to the visual and tactile effect created by the application of watercolor paint on paper or any other porous surface. This infographic template is a creative representation that incorporates watercolor textures and elements to convey information or data. This infographic is designed to engage viewers with its artistic and unique aesthetic while effectively presenting complex information in a simplified manner. This infographic features a white with watercolor background that sets the tone for the entire design. The soft, flowing, and colorful watercolor patterns create a visually appealing backdrop for the content.


5 slides
Home Investment and Property Value Presentation
Visualize key real estate insights with this skyline-themed slide, ideal for showcasing home investment data and market value trends. Designed for realtors, analysts, or housing consultants, it features a cityscape layout for clear comparison. Fully editable in PowerPoint, Keynote, and Google Slides for effortless customization and polished presentations.


8 slides
Checklist and Action Item List
Bring order to your tasks with this modern checklist design, ideal for highlighting project milestones, team assignments, or key deliverables. Featuring three editable points with accompanying icons, this layout ensures clarity and professionalism in every update. Fully customizable in PowerPoint, Keynote, and Google Slides.


25 slides
Keystone Market Research Presentation
Present your market research with confidence using this stylish, contemporary template. Perfect for detailing research objectives, data collection, and key findings, it features a sleek design with vibrant colors. Highlight critical aspects like market trends, results interpretation, and recommendations to captivate your audience. Compatible with PowerPoint, Keynote, and Google Slides, it ensures seamless presentations on any platform.


8 slides
Architectural Design and Smart Home Trends Presentation
Showcase modern architecture insights and tech-savvy innovations with this layered home diagram slide. Ideal for real estate, construction, or smart home professionals, it highlights key features in a visually tiered format. Fully editable in PowerPoint, Keynote, and Google Slides—perfect for clean, tech-forward presentations with a sleek design.


4 slides
Productivity and Task Prioritization Presentation
Streamline efficiency with structured task prioritization using this Productivity and Task Prioritization template. Designed with rating indicators, pie charts, and color-coded sections, this slide helps visualize task importance, workload distribution, and performance evaluations. Ideal for team leaders, project managers, and business strategists, this template is fully customizable and compatible with PowerPoint, Keynote, and Google Slides.


5 slides
Business Cycle and Wheel Diagram
Illustrate key stages, continuous workflows, or strategic frameworks with this circular business diagram. Ideal for visualizing four connected steps in a clean, modern style. Easily editable in PowerPoint, Keynote, and Google Slides for full customization.


25 slides
Jasper Rebranding Project Plan Presentation
Elevate your brand transformation with this sleek rebranding presentation template! It covers everything from mission and values to market analysis and brand positioning. Perfect for showcasing your brand guidelines and touchpoints. Fully customizable, and compatible with PowerPoint, Keynote, and Google Slides, making your rebranding process seamless and professional.
9 slides
Arrow Security Infographic
Introducing our new "Arrow Security Infographic", this is a visually engaging and informative presentation template that focuses on various aspects of arrow infographics. This template can be used to provide an overview of different security measures, techniques, and technologies that can be implemented to enhance safety and protect against potential threats. This is designed with a variety of arrow infographics that can help help individuals and organizations understand the importance of security and make informed decisions to safeguard their assets and interests. Compatible with Powerpoint, Keynote, and Google Slides.


7 slides
World Maps Medical Security Infographic
Introducing our world map medical security infographic, a template designed to spotlight global medical security concerns and solutions. With a pristine white backdrop punctuated by shades of blue, this infographic offers a tranquil yet informative ambiance, reminiscent of the medical field. Embedded within are custom graphics of the world map, tailor-made to highlight regions based on their medical security levels, accompanied by relevant icons that represent various aspects of healthcare protection and risks. It’s compatibility with platforms such as PowerPoint, Keynote, and Google Slides ensures seamless presentations across various devices and audiences.


4 slides
Strategic Takeaways and Final Points Presentation
Summarize key insights and final thoughts with this clean, icon-based layout. Ideal for wrapping up business reviews, strategy decks, or executive briefings, each section includes room for concise summaries and visuals. Easily customizable in PowerPoint, Keynote, and Google Slides to match your brand and presentation goals.


5 slides
Team Role Distribution Matrix Presentation
Clarify responsibilities and improve collaboration with the Team Role Distribution Matrix Presentation. This RACI-style slide helps visualize team accountability across multiple tasks, making it ideal for project management, cross-functional teams, or workflow planning. Each layout option includes clearly labeled roles and color-coded responsibilities: Responsible, Accountable, Consulted, and Informed. Fully editable in Canva, PowerPoint, Keynote, and Google Slides.