


Features
- 6 Unique Slides
- Fully editable and easy to edit in Microsoft Powerpoint, Keynote and Google Slides
- 16:9 widescreen layout
- Clean and professional designs
- Export to JPG, PDF or send by email


Do you have any questions?
Recommend


3 slides
Strategic Planning and Business Model Presentation
Present your business roadmap with clarity using this Strategic Planning and Business Model slide. Featuring a modular grid layout, it allows you to break down initiatives, objectives, and action items into digestible segments. Perfect for business strategy sessions, planning workshops, or executive reports. Fully editable in PowerPoint, Canva, and Google Slides.


5 slides
Organizational Management Frameworks Overview Presentation
Clarify reporting lines and decision-making roles with the Organizational Management Frameworks Overview Presentation. This clean and color-coded hierarchy chart helps visualize team structure, leadership levels, or departmental breakdowns. Ideal for organizational design, onboarding, or strategic alignment discussions, each placeholder is fully customizable to reflect your company’s framework. Compatible with PowerPoint, Keynote, and Google Slides—perfect for HR professionals, managers, and consultants seeking structure and clarity.


6 slides
Travel Insurance Infographics
Our "Travel Insurance" infographic template, compatible with PowerPoint, Keynote, and Google Slides, is crafted for insurance companies, travel agencies, and financial advisors. This template is an excellent tool for explaining the benefits and details of travel insurance to clients and customers. The template comprehensively covers vital elements such as coverage options, emergency assistance services, and claim procedures. Its clear and organized layout makes it easy to convey complex insurance information in a manner that is both accessible and engaging. This is particularly useful for presentations aimed at educating travelers about the importance and benefits of travel insurance. Designed with a bright and inviting travel-themed color scheme, the template incorporates elements that reflect global travel and security. This not only makes the presentation visually appealing but also resonates with the theme of travel and protection. Whether used in client consultations, marketing materials, or informational workshops, this template ensures that the key aspects of travel insurance are presented clearly and attractively.


10 slides
Success Stories and Case Findings Presentation
Celebrate achievements with clarity using the Success Stories and Case Findings Presentation. Featuring a vertical trophy infographic layout, this template allows you to present up to 5 milestones, results, or insights in a visually rewarding format. Ideal for showcasing progress, case highlights, or performance wins. Fully editable in PowerPoint, Keynote, and Google Slides.


7 slides
Simple Schedule Infographic
Effortlessly structure your time with our simple schedule infographic. Rendered in a clean white canvas, enhanced with dependable blue tones and anchored with timeless black, our template is the epitome of clarity and organization. Equipped with streamlined infographics, universal icons, and adaptable image placeholders, it facilitates easy time management and daily planning. Seamlessly tailored for Powerpoint, Keynote, or Google Slides. A fundamental tool for project managers, event planners, educators, or any professional aiming to efficiently allocate their time. Plan with ease; let every slide bring order to your daily chaos.


5 slides
Root Cause Analysis Fishbone Slide Presentation
Give your problem-solving sessions a fresh visual spark with a tree-style diagram that makes tracing causes feel clear and intuitive. This presentation helps you break down issues, organize insights, and present findings with clean, structured flow. Perfect for teams and workshops. Fully compatible with PowerPoint, Keynote, and Google Slides.


20 slides
Solstice Startup Funding Proposal Presentation
This sleek startup funding proposal deck showcases your company’s objectives, services, sales process, and pricing strategy. Perfect for pitching investors or stakeholders, its modern design ensures a professional presentation. Compatible with PowerPoint, Keynote, and Google Slides, it's ideal for making a strong impression with minimal effort.


5 slides
Healthcare Industry Report
Deliver key medical insights with this modern, stethoscope-themed slide. Ideal for showcasing health metrics, clinical data, or medical updates, the layout includes four sections with health icons and clear callouts for easy readability. Fully customizable in PowerPoint, Keynote, and Google Slides.


8 slides
Value Creation Strategy
Present your strategic pillars with clarity using this linear, milestone-style layout. Ideal for business consultants, growth strategists, and product teams aiming to showcase value drivers, innovation stages, or competitive differentiators. Fully editable in PowerPoint, Keynote, and Google Slides—customize icons, colors, and text for a branded, professional finish.


6 slides
Organizational Change Management Presentation
Visualize transformation with clarity using this structured slide, perfect for outlining your change roadmap, initiatives, or strategic phases. The layout features six labeled steps with icons and editable text for seamless communication of your process—from awareness to adoption. Ideal for HR leaders, consultants, and operations managers. Fully editable in PowerPoint, Keynote, and Google Slides.


7 slides
Money Exchange Infographic Presentation
Money exchange is an important aspect of international trade and commerce, and it serves many important functions. Create a professional visual aid for your next presentation with this infographic on money exchange. The template includes customizable layouts, charts and 7 unique photo layouts. You can add or delete columns of information as desired, change fonts and sizes as well as fill text boxes with titles, descriptions and more. This colorful design is great for reporting on business growth, expenses and more. This presentation is designed in Powerpoint, Keynote and Google Slides.


7 slides
Strategic Business Execution Playbook Presentation
Streamline your execution roadmap with this Strategic Business Execution Playbook. Featuring a sleek, step-by-step layout, it’s ideal for showcasing business stages, workflows, or strategic planning phases. Easy to customize in PowerPoint, Keynote, and Google Slides, this template helps teams visualize priorities and align goals with precision and clarity.


5 slides
Scientific Research Presentation
Break down complex processes with clarity using this Scientific Research Presentation Template. Featuring a modern lab flask visual segmented into four stages, it’s perfect for illustrating experimental phases, research progress, or scientific data. Ideal for educators, researchers, and science-based companies. Fully compatible with PowerPoint, Keynote, and Google Slides for effortless editing.


7 slides
Flow Chart Diagram Presentation
Flow charts are important because they provide a visual representation of a process or system, which helps to simplify complex information and make it easier to understand. Our Infographic flow charts are easy to use because they combine visual elements such as icons, and colors with concise text, making complex information more digestible and memorable. These highly adaptable flow charts are ideal due to their complete customizability, allowing for universal utilization to cater to the unique requirements of any individual. Do not waste any more precious time and get started right away.


21 slides
Cupid Sales Proposal Presentation
Elevate your next proposal with this sleek and professional presentation template! Ideal for outlining project goals, scope of work, and timelines, this template ensures that every detail is presented with clarity and impact. It includes sections for budget breakdowns, team expertise, and risk management strategies. Compatible with PowerPoint, Keynote, and Google Slides, it’s designed for flexibility and success.


7 slides
Vision Infographic
Elevate your presentations with our range of Slide Templates, tailored to showcase long-term objectives and strategies. These designs vary from simple and clean to bold and engaging, ensuring that every slide effectively communicates your forward-looking plans. Each template is crafted for easy customization to suit your brand's style, including areas for essential details, data representation, and motivational elements. They are perfect for aligning your team, engaging stakeholders, and promoting strategic discussions. Ideal for business presentations, team meetings, and motivational sessions, these templates offer a professional way to present your future goals and engage your audience effectively.
22 slides
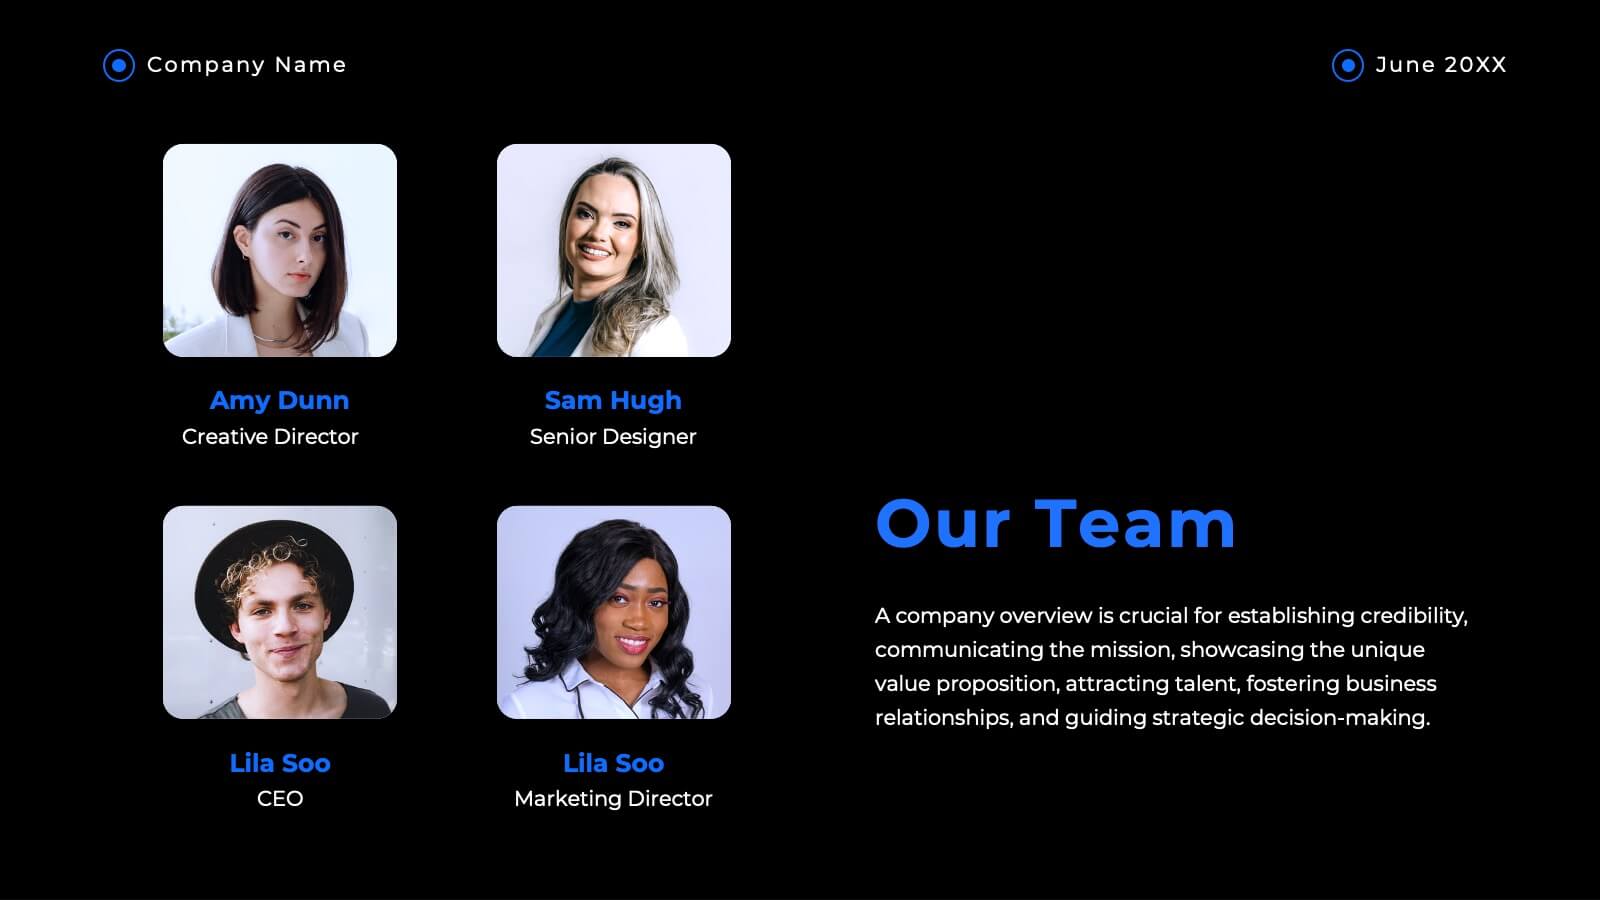
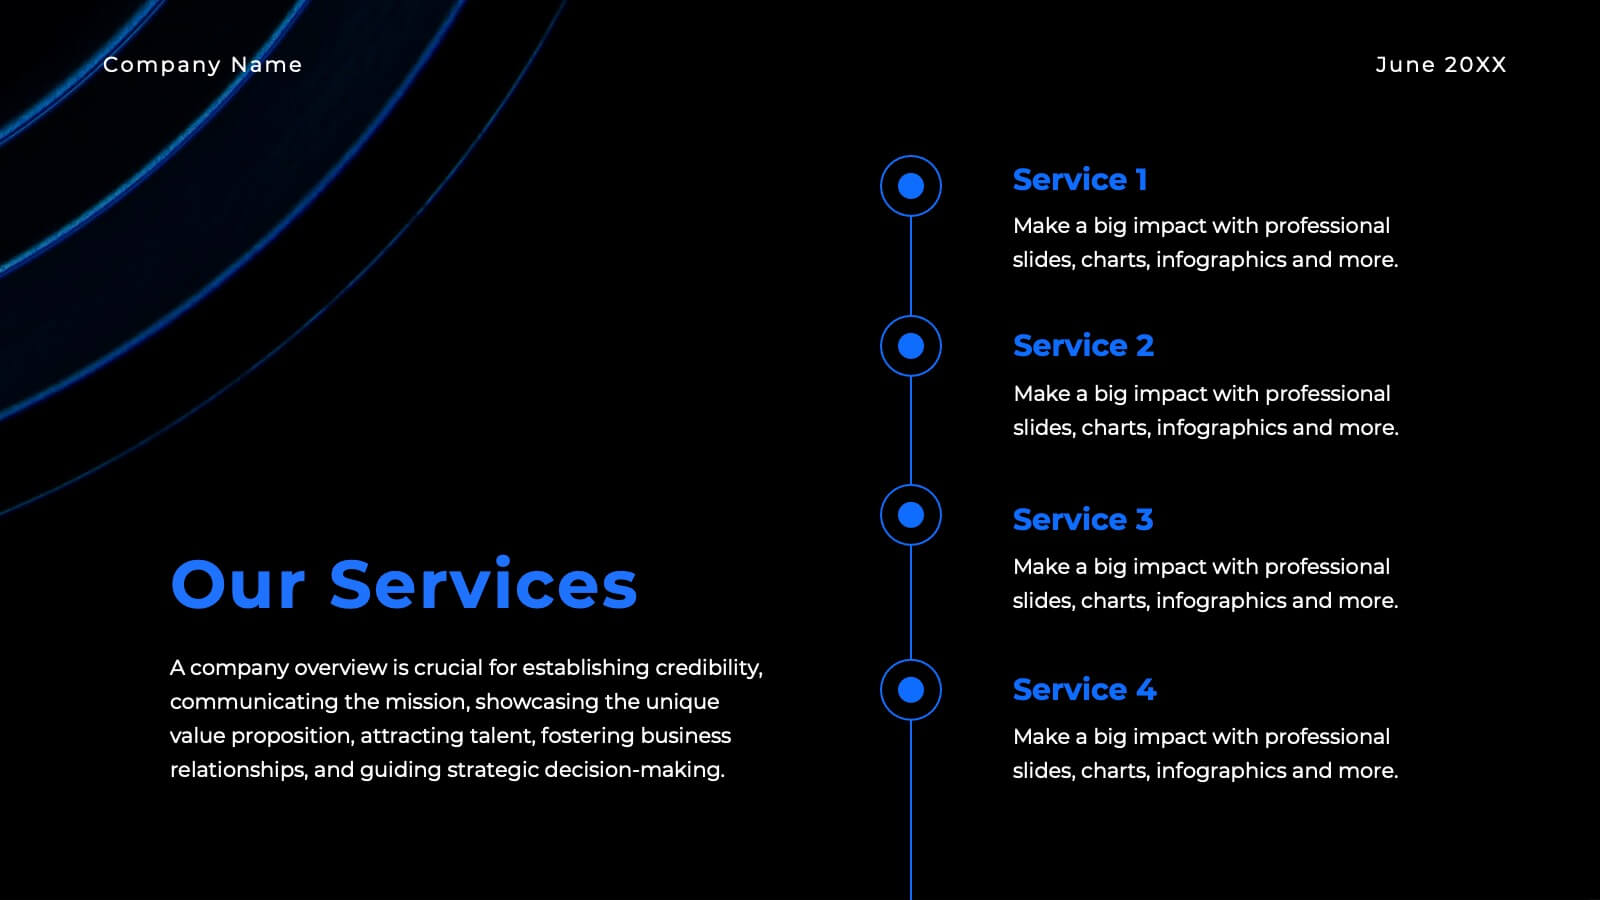
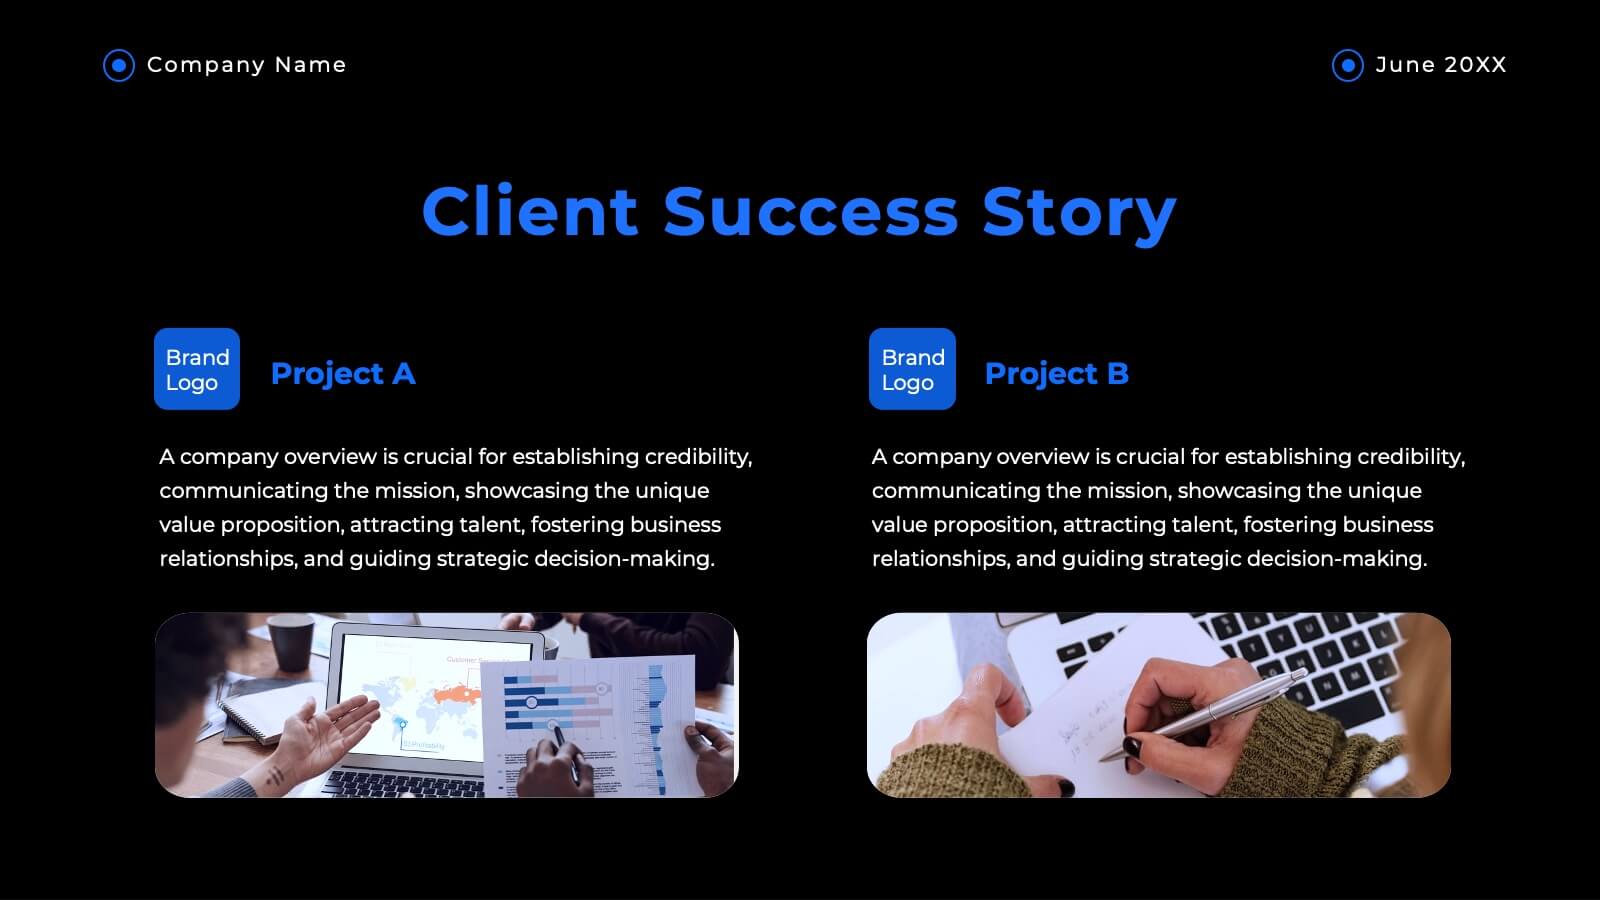
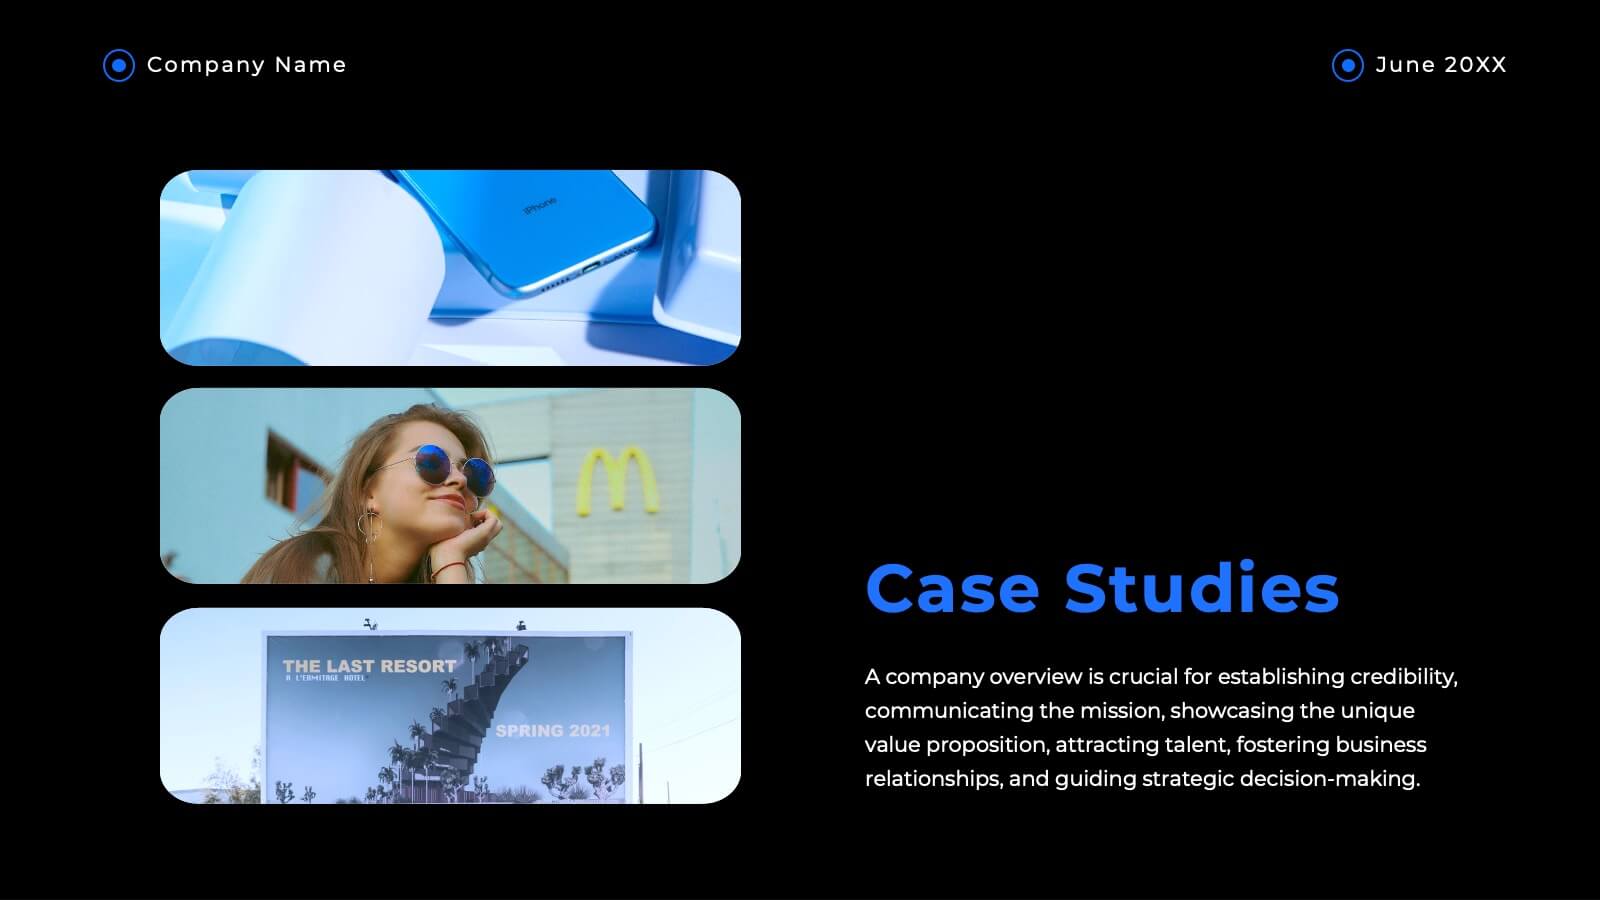
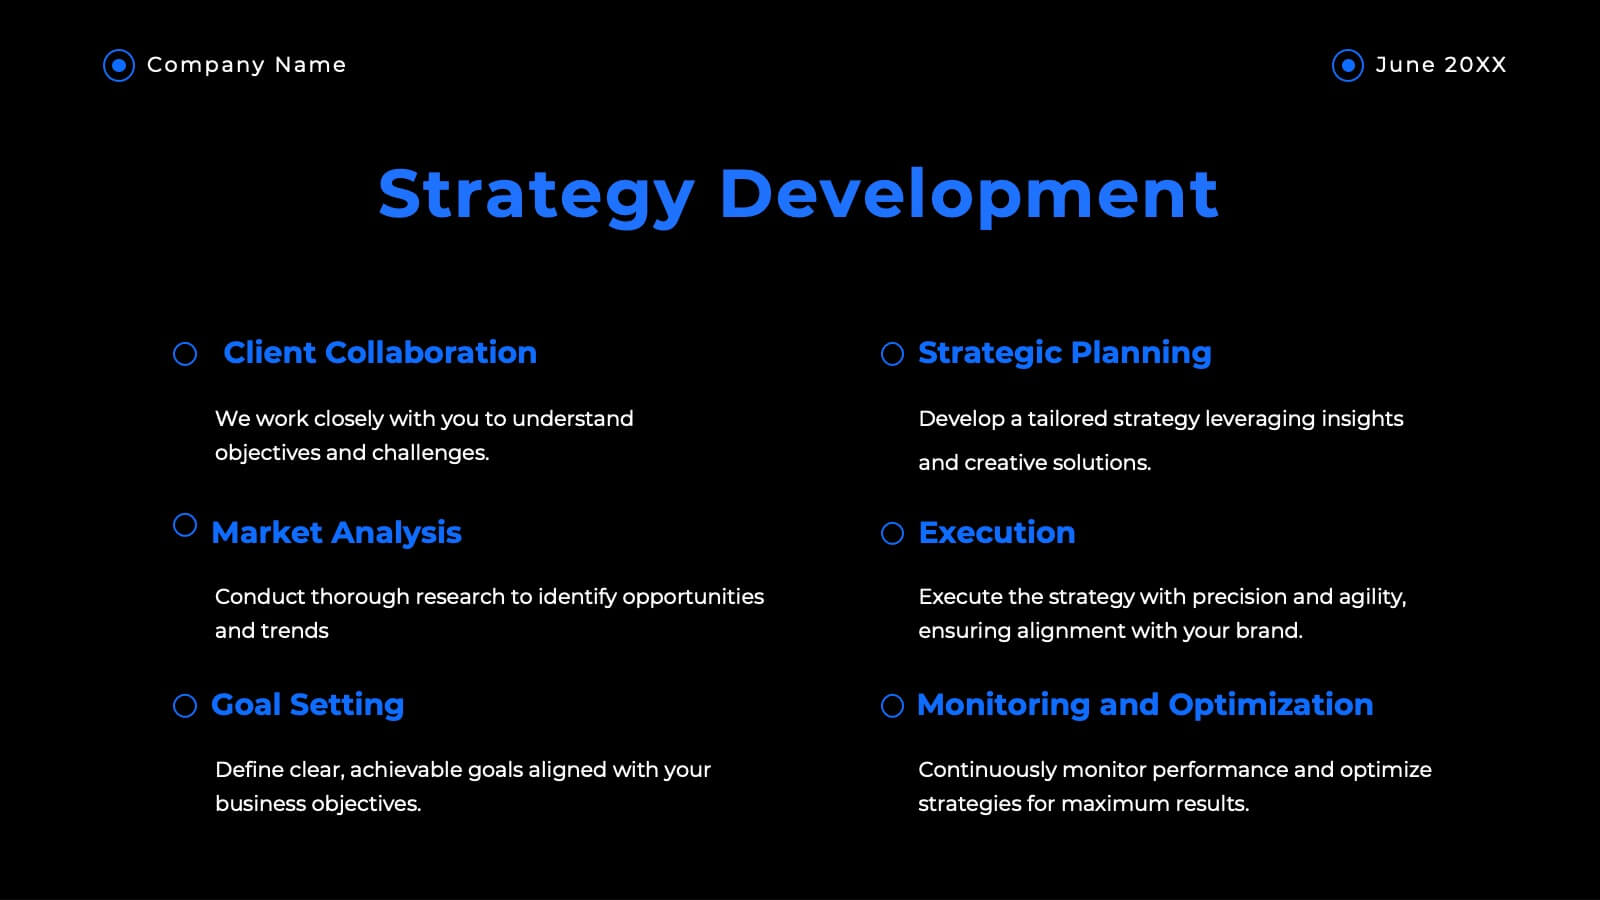
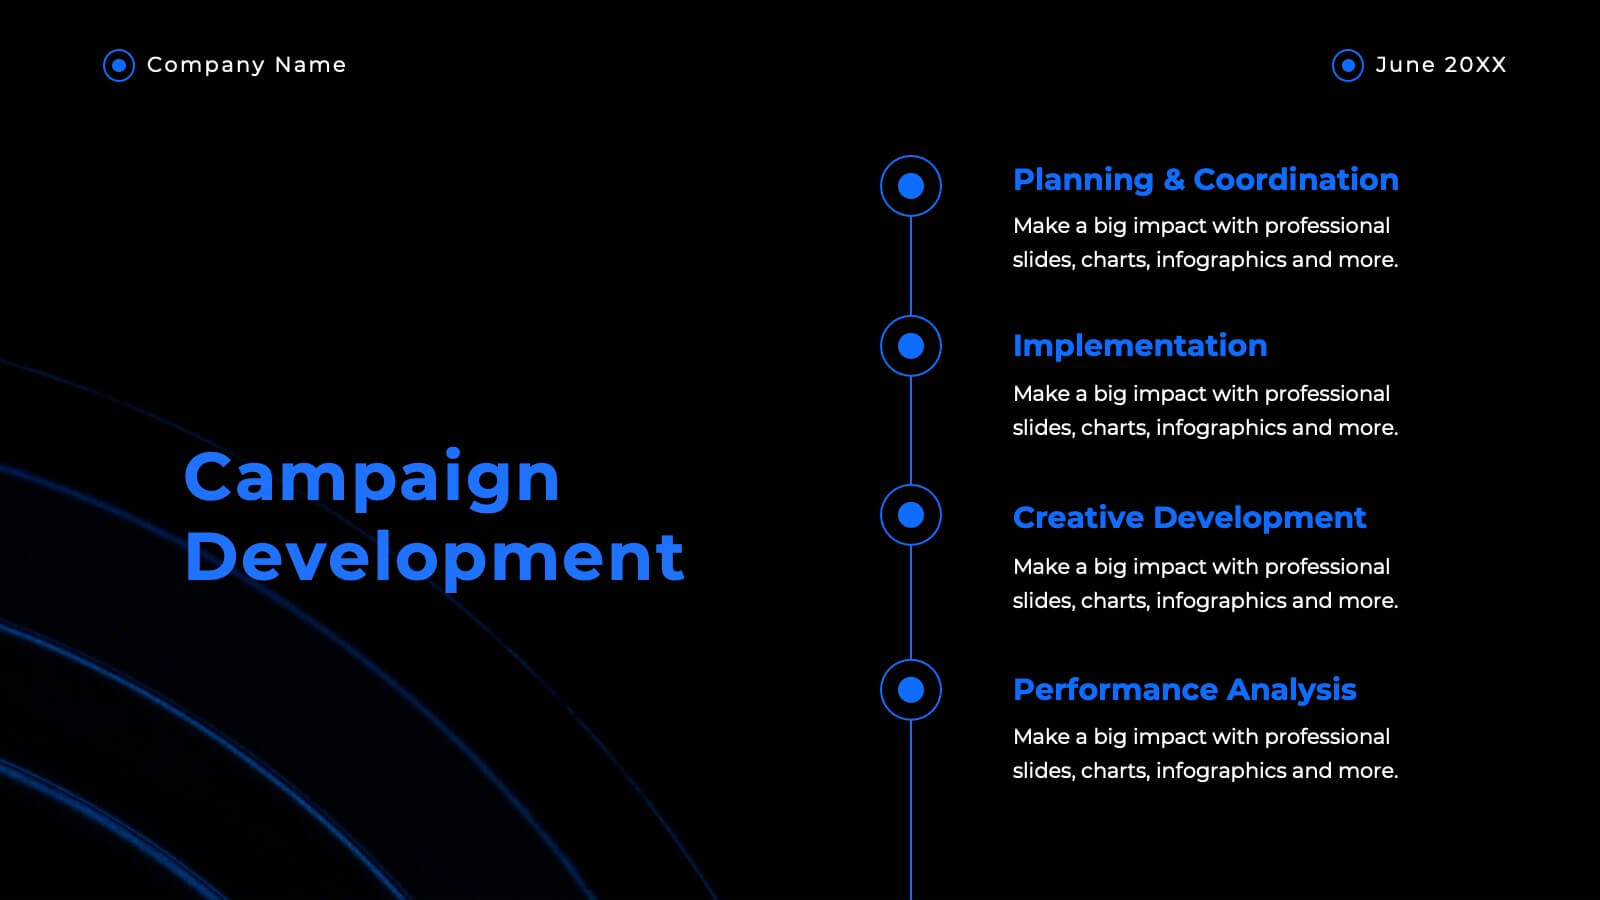
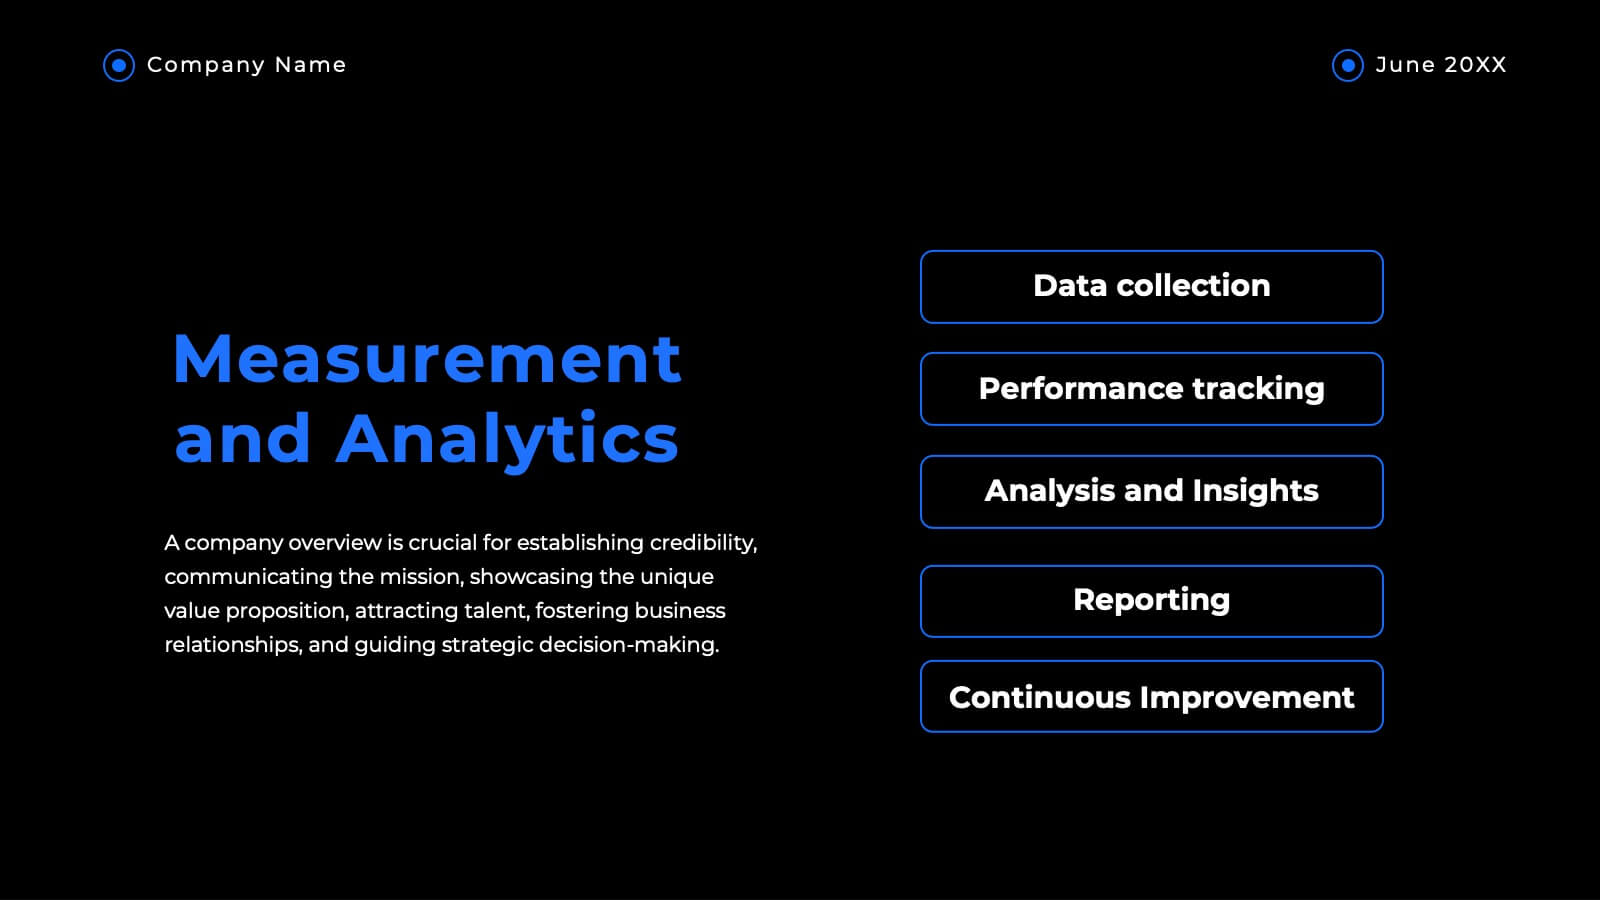
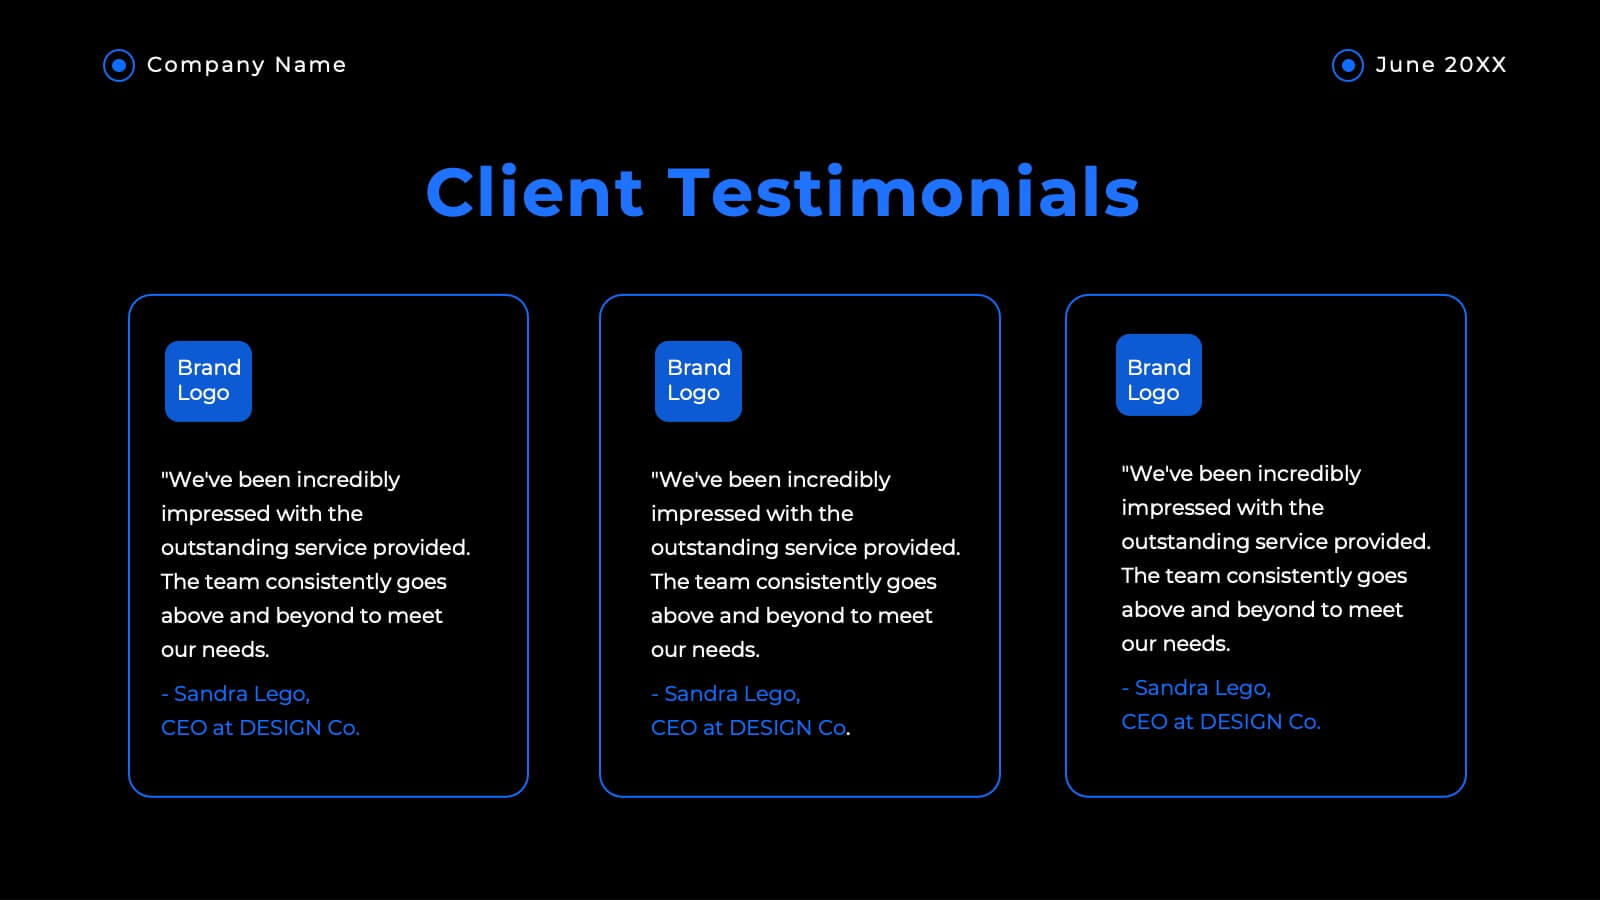
Haven Advertising Agency Proposal Presentation
Wow your clients with this sophisticated agency presentation template! Perfect for showcasing your services, client success stories, and market analysis. Ideal for agencies looking to impress and secure new business. Compatible with PowerPoint, Keynote, and Google Slides, this template ensures your proposals stand out with professional elegance. Perfect for any pitch or proposal.