


Features
- 5 Unique slides
- Fully editable and easy to edit in Microsoft Powerpoint, Keynote and Google Slides
- 16:9 widescreen layout
- Clean and professional designs
- Export to JPG, PDF or send by email


Do you have any questions?
Recommend


2 slides
Professional Closing Thank You
End your presentation with clarity and professionalism using this bold yet minimalist "Thank You" slide. Designed with modern aesthetics and contact detail placeholders, it’s ideal for business reports, marketing decks, and corporate pitches. Fully customizable in PowerPoint, Keynote, and Google Slides.


4 slides
Stakeholder Analysis Template for Projects Presentation
Turn complex stakeholder relationships into clear, actionable insights with this dynamic and modern quadrant design. Ideal for visualizing influence, communication strategies, and engagement priorities, it helps teams build stronger collaboration frameworks. Fully editable and compatible with PowerPoint, Keynote, and Google Slides for effortless professional use.


10 slides
Process Flow Chart Presentation
Visualize your process with clarity using the Process Flow Chart Presentation. Featuring a central hexagon design branching out into four sequential steps, this layout is perfect for showcasing workflows, procedures, or business strategies. Color-coded options and dark/light theme variations add versatility. Fully customizable in PowerPoint, Keynote, and Google Slides.


21 slides
Mystara Project Status Report Presentation
Keep stakeholders informed with this clean and professional project status report template. Cover key areas such as performance metrics, financial summaries, team productivity, and future priorities. Perfect for tracking progress and making data-driven decisions. Fully customizable for PowerPoint, Keynote, and Google Slides.


5 slides
Customer Survey Results Presentation
Gain valuable insights with this Customer Survey Results Presentation. Featuring a clean and data-driven layout, this template allows you to visualize customer feedback, satisfaction scores, and key performance metrics using interactive charts, graphs, and tables. Fully customizable in PowerPoint, Keynote, and Google Slides, you can adjust colors, edit labels, and modify content to fit your survey needs.


6 slides
Change Management Process Infographic
Change management is a structured approach used by organizations to transition from their current state to a desired future state. This infographic template is designed to showcase the steps and components involved in managing organizational changes effectively. This template helps viewers understand the process and key elements required for successful change management. This informative infographic can be shared with employees, managers, or students to provide a clear understanding of the steps and strategies involved in successfully implementing organizational changes. Compatible with Powerpoint, Keynote, and Google Slides.


6 slides
Machine Learning and Data Science Presentation
Deliver insights with precision using this data-driven presentation template tailored for machine learning, AI, and analytics topics. Featuring a central hub-and-spoke design, this layout allows you to showcase key components like algorithms, tools, processes, or data sources. Each segment includes clean icons and customizable titles for seamless editing. Ideal for data scientists, tech professionals, and academic presentations. Fully editable in PowerPoint, Keynote, and Google Slides.


23 slides
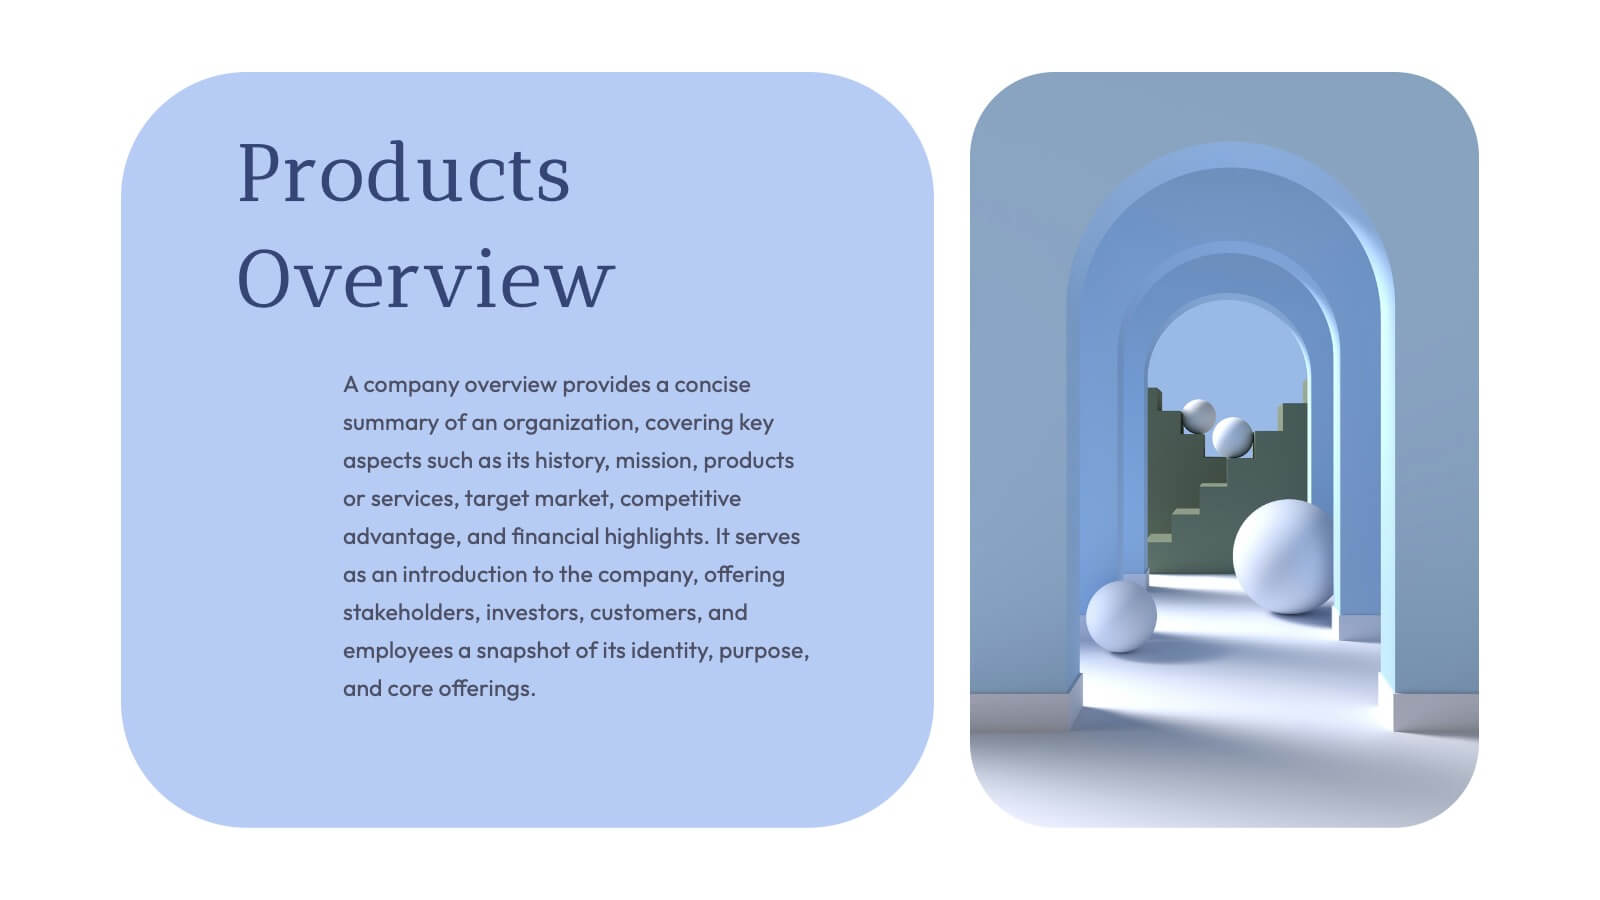
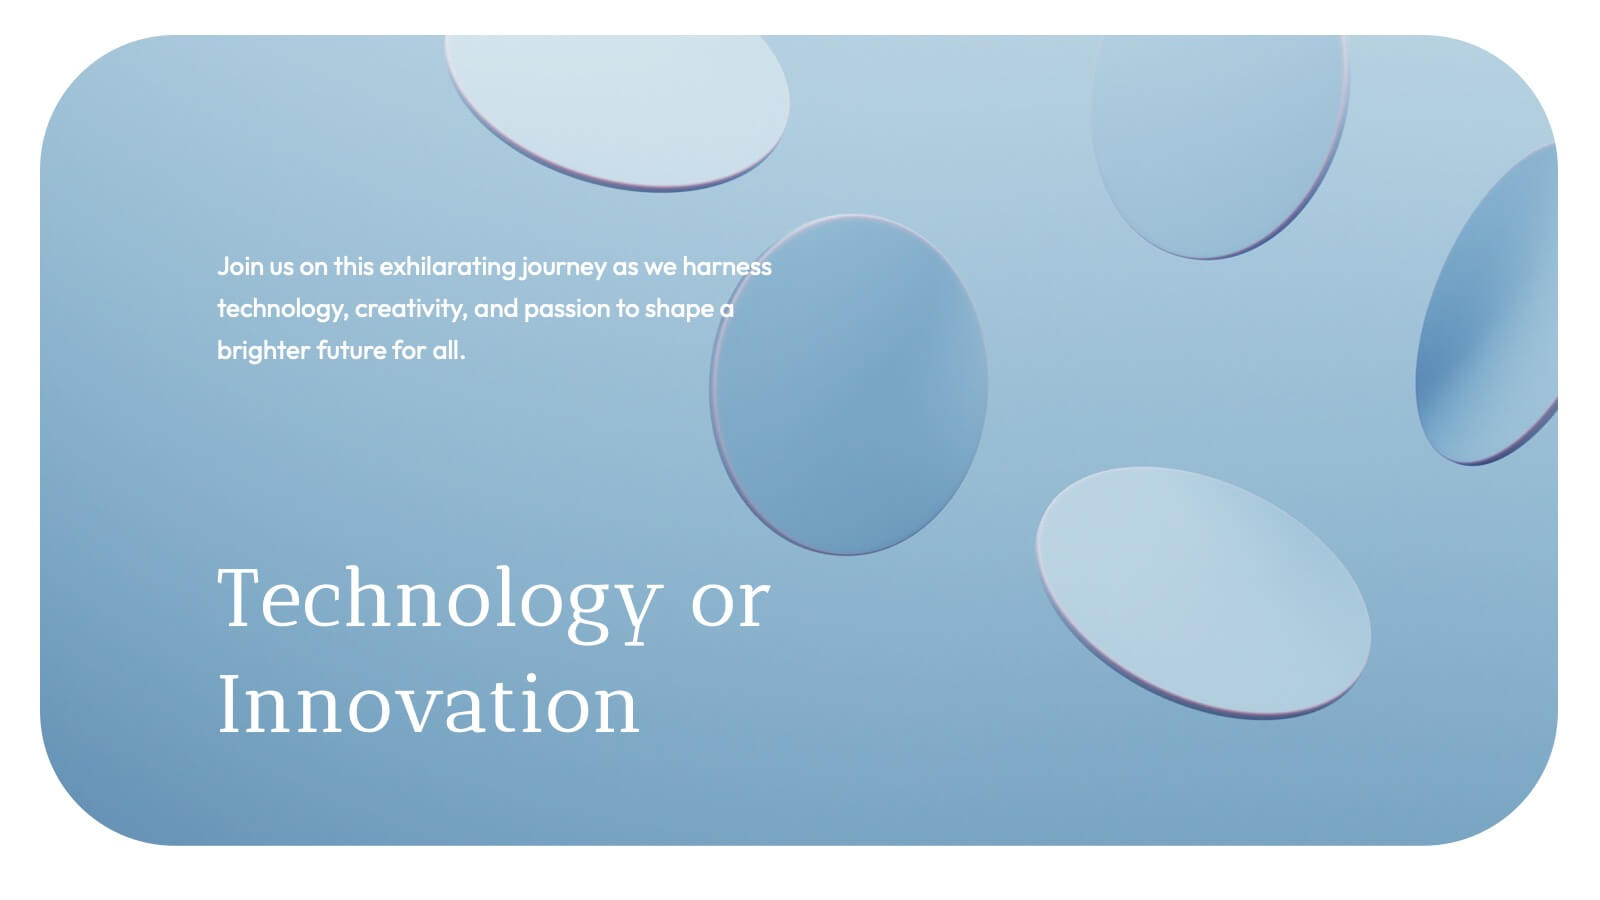
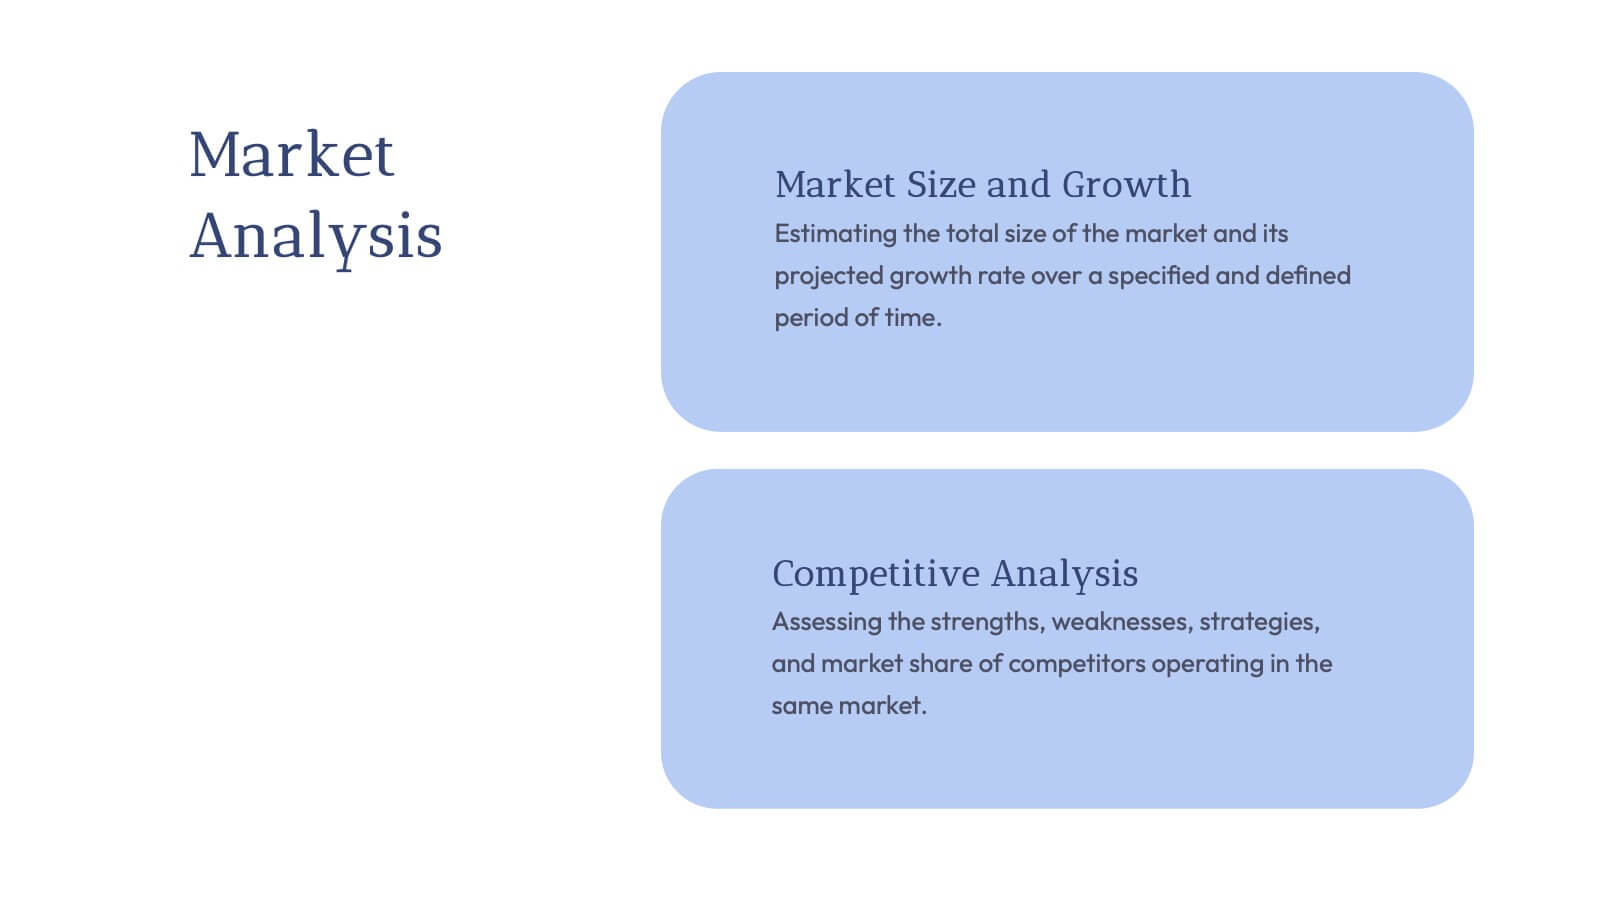
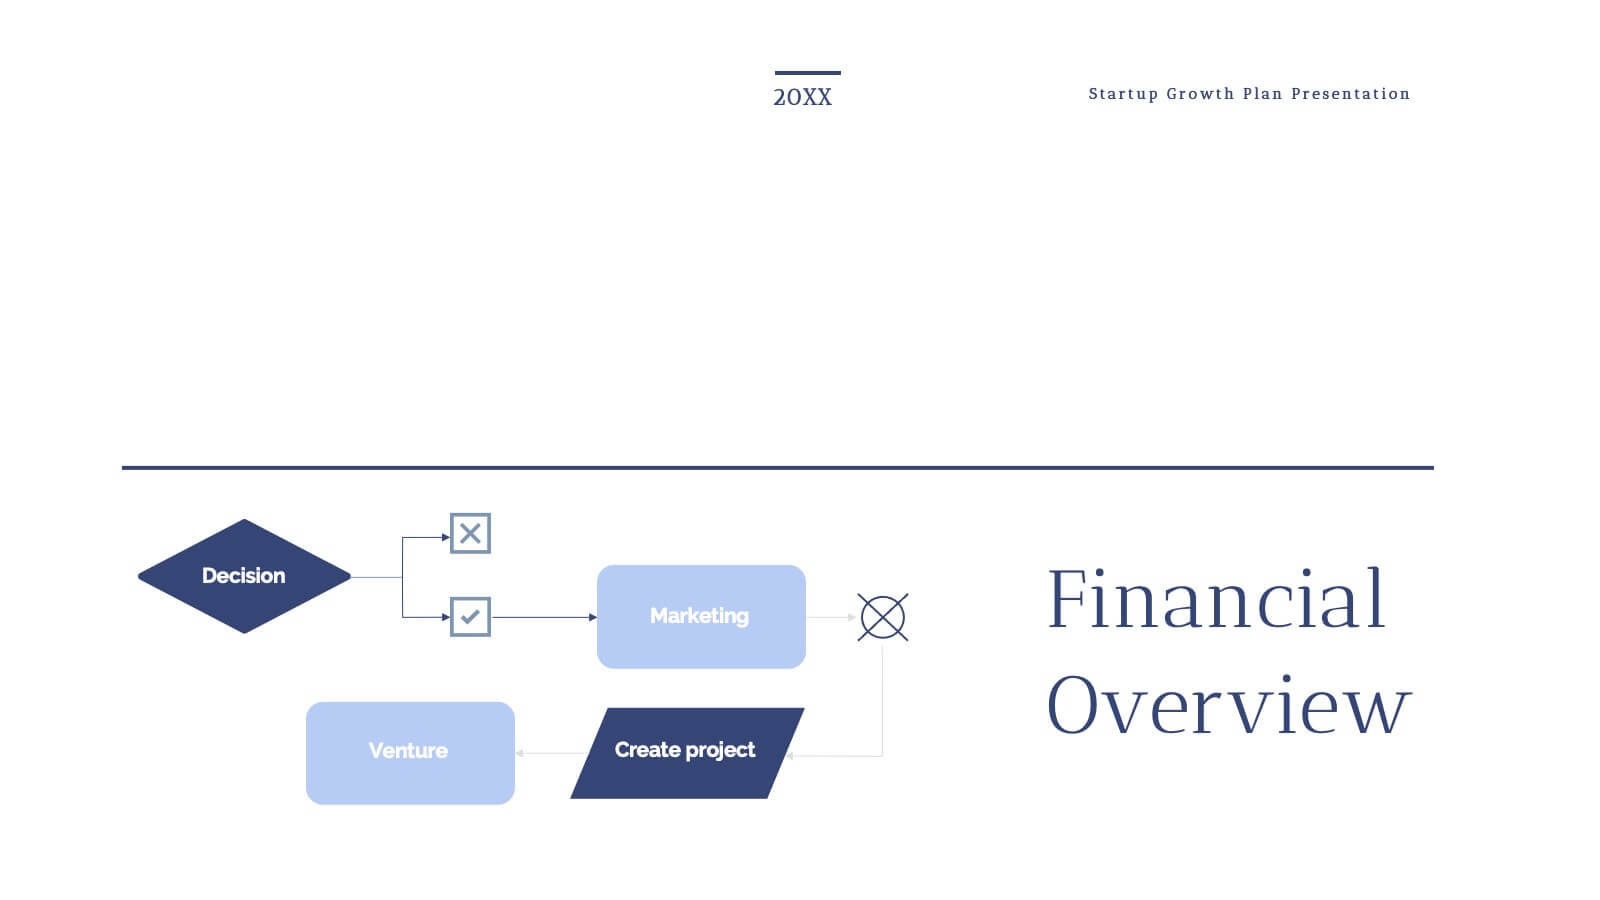
Grecian Startup Growth Plan Presentation
Elevate your pitch with this stunning Grecian-inspired presentation template, perfect for outlining your startup's growth plan! Showcase your business strategy, revenue projections, and scaling opportunities with a clean, elegant design that grabs attention. Impress investors and stakeholders with every slide. Compatible with PowerPoint, Keynote, and Google Slides for seamless customization.
6 slides
Performance Tracking Using OKRs
Visualize your team’s progress across people, process, and products with this OKR-focused performance tracking slide. Designed for managers and leaders aiming to align execution with key results. Compatible with PowerPoint, Keynote, and Google Slides for full customization.


7 slides
Customer Question for Support Infographic
Step into the spotlight with our vibrant Infographic Template, where every inquiry is a star! Designed to dazzle, this template offers a show-stopping way to address customer queries with flair and precision. Imagine vibrant backdrops and playful fonts that turn ordinary support interactions into captivating visual stories.Tailor-made for businesses eager to shine in customer service, this template transforms FAQs into eye-popping, memorable visuals. Whether it’s tech glitches, product how-tos, or service details, your answers will not only be seen—they’ll be remembered. Customize to fit your brand’s personality, deploying colors and styles that resonate with your audience.Ideal for help centers, product support pages, or digital kiosks, it makes customer support not just helpful, but spectacularly engaging. Ready for use with popular graphic design tools, it’s your backstage pass to standing ovations in customer care.


4 slides
Harvey Ball Chart Business Analysis
Simplify your data-driven storytelling with this Harvey Ball chart slide—perfect for consultants, analysts, and strategy teams. Visualize percentage-based insights across four categories using clean, easy-to-read circular progress visuals. Fully editable in PowerPoint, Keynote, and Google Slides to match your branding and message.


26 slides
Dax Presentation Template
Dax is a professional and clean template that was created to make your presentations stand out. It has a vibrant color scheme and engaging graphics that are easy to edit. The clean look has plenty of room for you to display your content, and this high-quality design will make an impression in your meeting or presentation for your targeted audience. It also allows you to present your content in a way that is professional and engaging. Its vibrant style also makes it stand out from other presentations. This template is suitable for all types of businesses. Don't think twice this one if for you!


8 slides
RACI Matrix Role Assignment Presentation
The "RACI Matrix Role Assignment" presentation template is designed to clarify role responsibilities in project management contexts. Each slide presents a clear visual breakdown of who is responsible, accountable, consulted, and informed (RACI) for each task within a project. This approach helps in preventing overlap and ensuring all team members are clear about their roles and responsibilities, promoting more effective communication and project management.


8 slides
Geometric Design Elements Presentation
The "Geometric Design Elements" presentation template features a modern layout utilizing geometric shapes to organize and present data effectively. Each slide provides a unique configuration of circles or connected shapes, facilitating clear visualization of interconnected topics or categories. These design elements are ideal for displaying business insights, relationships between concepts, or summarizing key points in a visually appealing and easily digestible format. The use of varied colors helps to distinguish between different sections or ideas, enhancing the viewer's ability to follow and absorb the presented information efficiently. This template is suitable for business presentations that require a balance of aesthetic appeal and functional design to communicate complex information clearly.


7 slides
Safety Infographics Presentation Template
Our safety infographic is a visual representation of information related to safety, designed to present important safety concepts and practices in a simple and visually appealing way. Safety infographics are used to promote safety in various settings, such as workplaces, public spaces, schools, and homes. This template will present your information in the form of images, charts, graphs, and other visual elements. The main goal of our safety infographics is to help you increase safety awareness and promote safe behavior. Present safety information in an engaging and easily understandable format!


8 slides
Sustainable Operation & Ethical Practice Presentation
Illustrate your ethical initiatives and operational sustainability with this water drop flow diagram. Ideal for outlining four key actions or principles, it features a faucet visual and icon-based content drops. Fully customizable in PowerPoint, Keynote, and Google Slides—perfect for ESG reporting, CSR updates, and eco-conscious business presentations.


7 slides
North America Language Map Infographic
Embark on a visual odyssey across the vast terrains of North America with our expertly crafted map infographic. Painted in the expansive blue, the lush green, the vibrant yellow, and the warm orange, our template captures the essence of North America's diverse geographies and cultures. Adorned with accurate infographics, distinct icons, and region-specific image placeholders, it provides a panoramic view of the continent's multifaceted landscape. Flawlessly tailored for Powerpoint, Keynote, or Google Slides. An indispensable tool for educators, travelers, geographers, or businesses targeting the North American market. Navigate with purpose; let every slide be a step into North America's captivating expanse.