


Features
- 10 Unique slides
- Fully editable and easy to edit in Microsoft Powerpoint, Keynote and Google Slides
- 16:9 widescreen layout
- Clean and professional designs
- Export to JPG, PDF or send by email


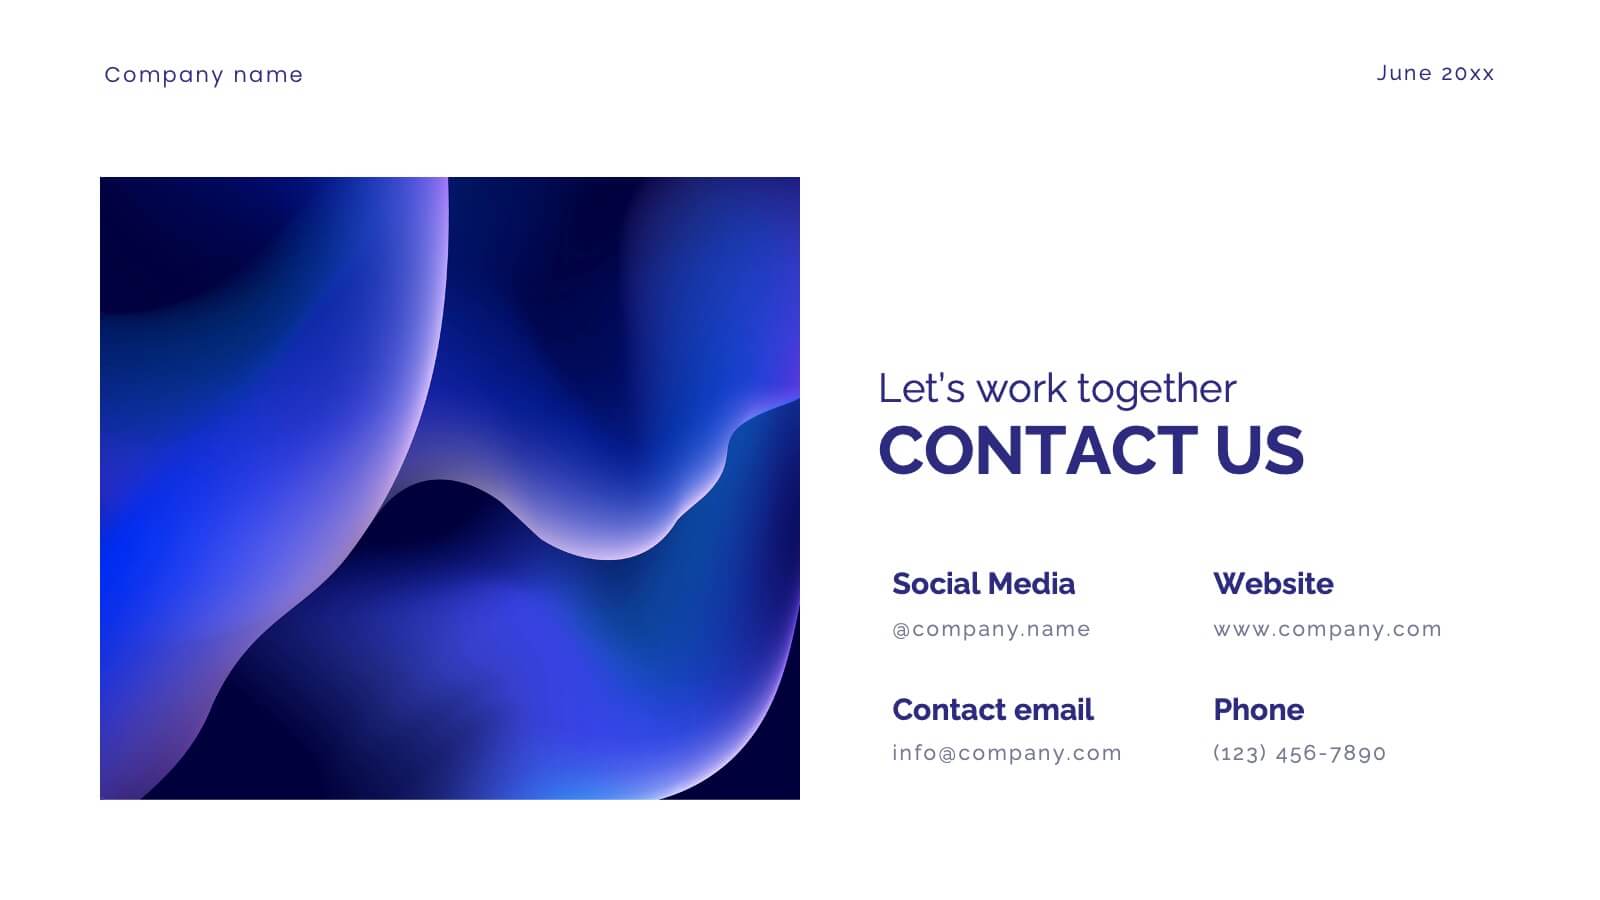
Do you have any questions?
Recommend


6 slides
Machine Learning Systems Overview
Get ready to light up your next tech talk with a bold, clean layout that simplifies even the most complex systems. This infographic presentation template is designed to break down how intelligent algorithms function, analyze data, and learn patterns—perfect for explaining how machine learning fits into real-world applications. Each slide uses smart visuals and icons to guide viewers through each system stage with clarity. Ideal for educators, developers, or startups pitching AI-powered solutions, it’s a creative and professional way to keep your audience engaged. Fully compatible with PowerPoint, Keynote, and Google Slides.


6 slides
Supply Chain Management Infographics
Elevate your presentation with our Supply Chain Management template, designed for clarity and impact. The slides are a blend of professional and engaging visuals, perfect for showcasing the intricacies of supply chain operations. Ideal for professionals and educators, they simplify complex logistics concepts into understandable visuals. The design is clean, making it perfect for business presentations that need to convey detailed processes and strategies effectively. With these slides, you're equipped to deliver a powerful message about the importance of streamlined supply chain management.


26 slides
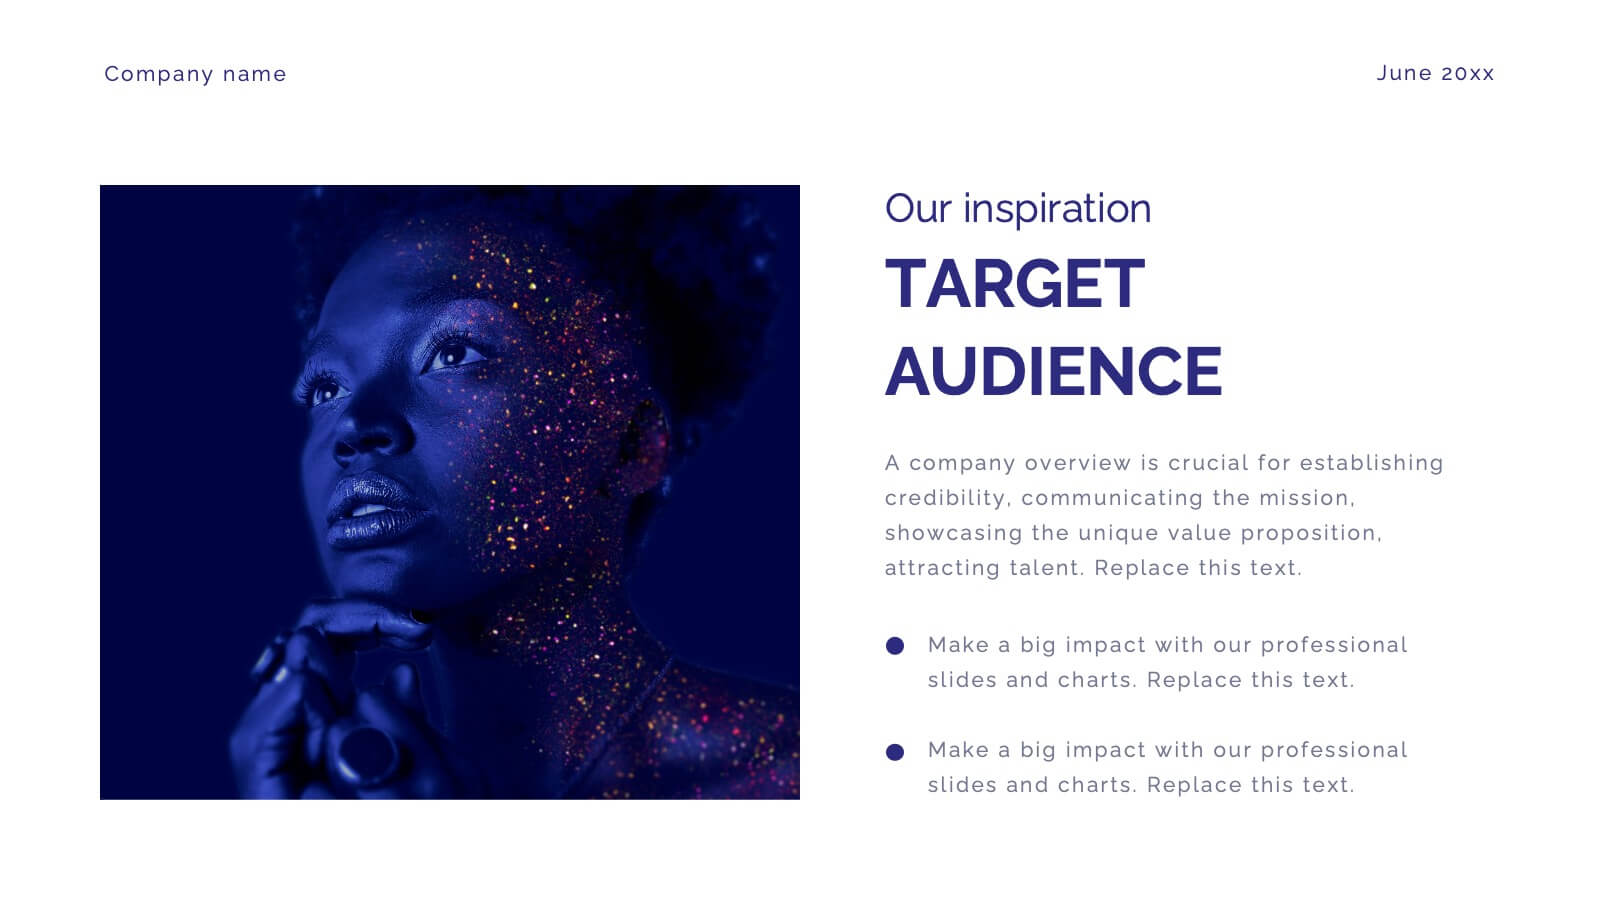
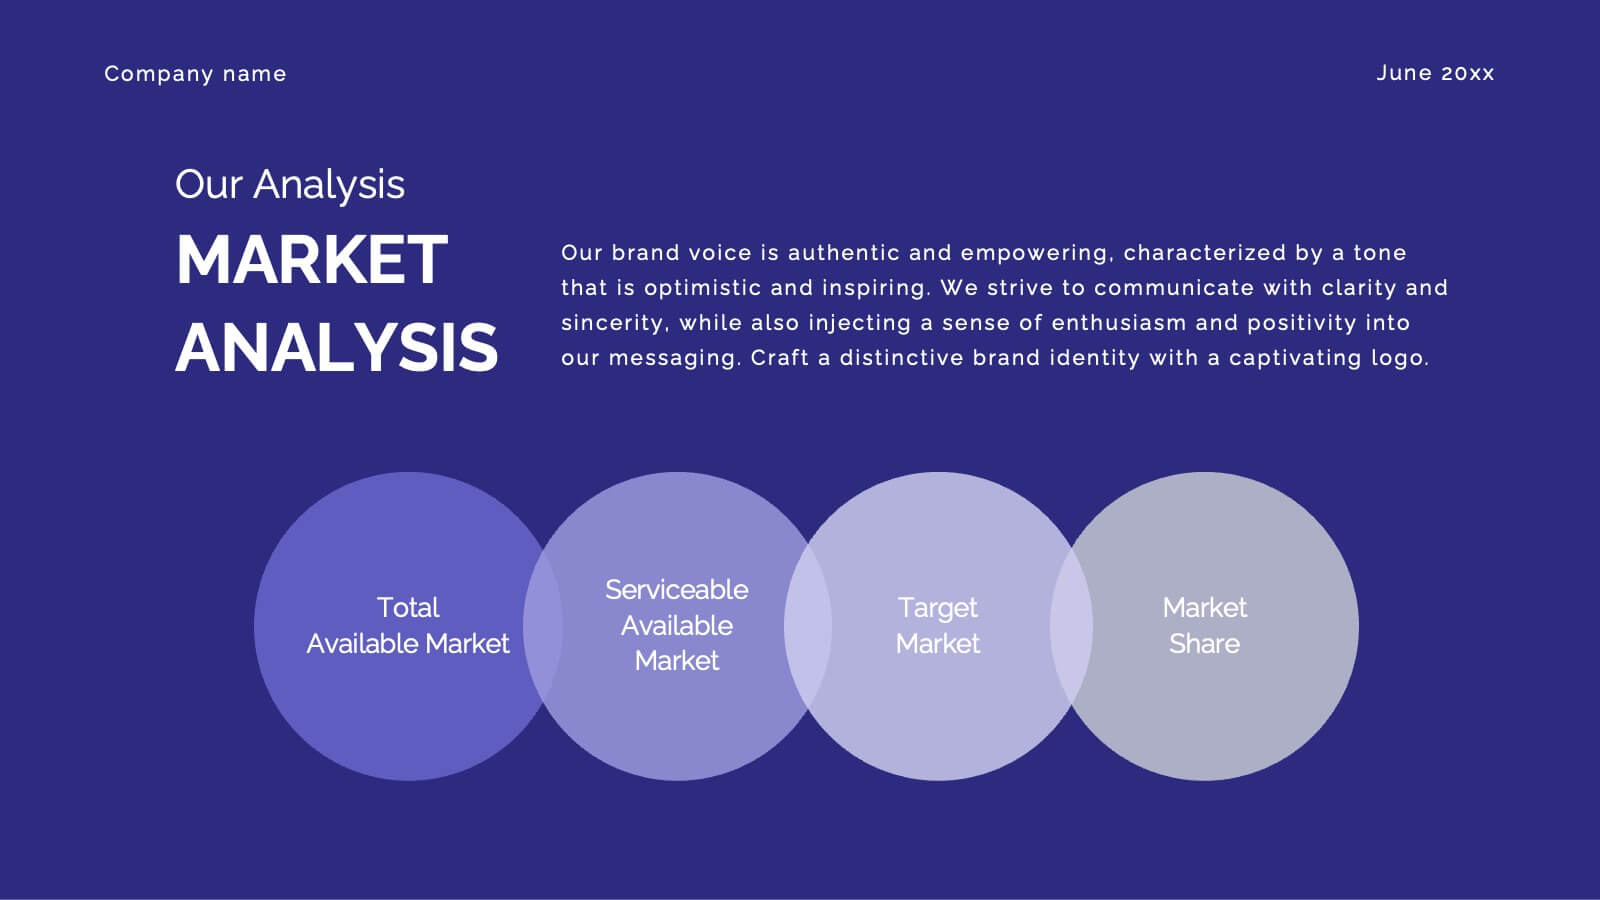
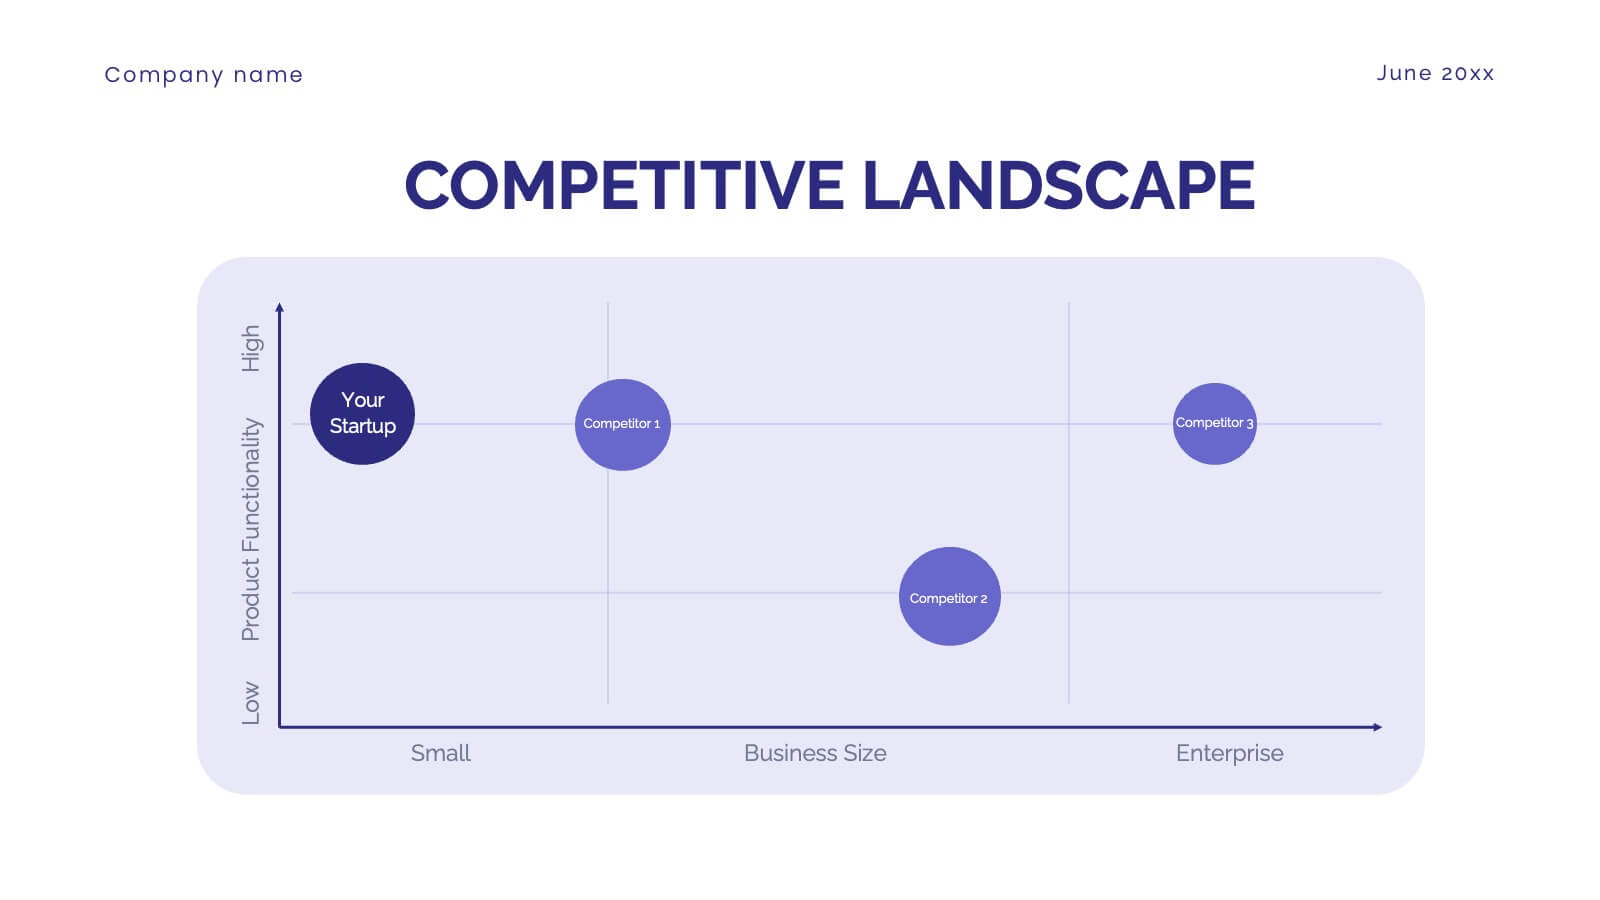
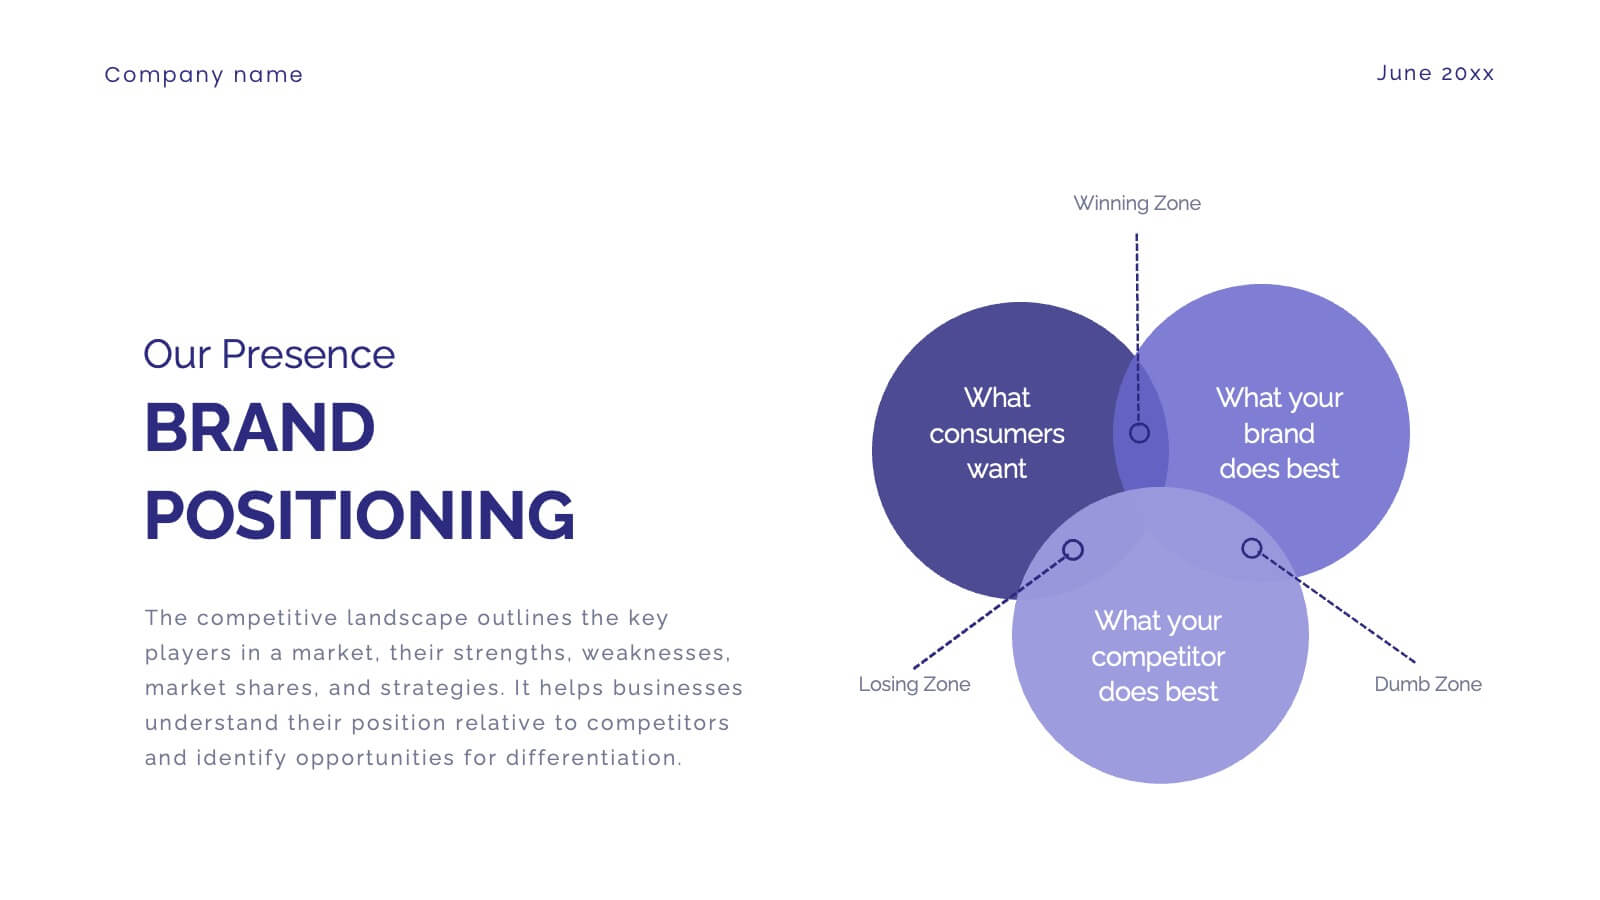
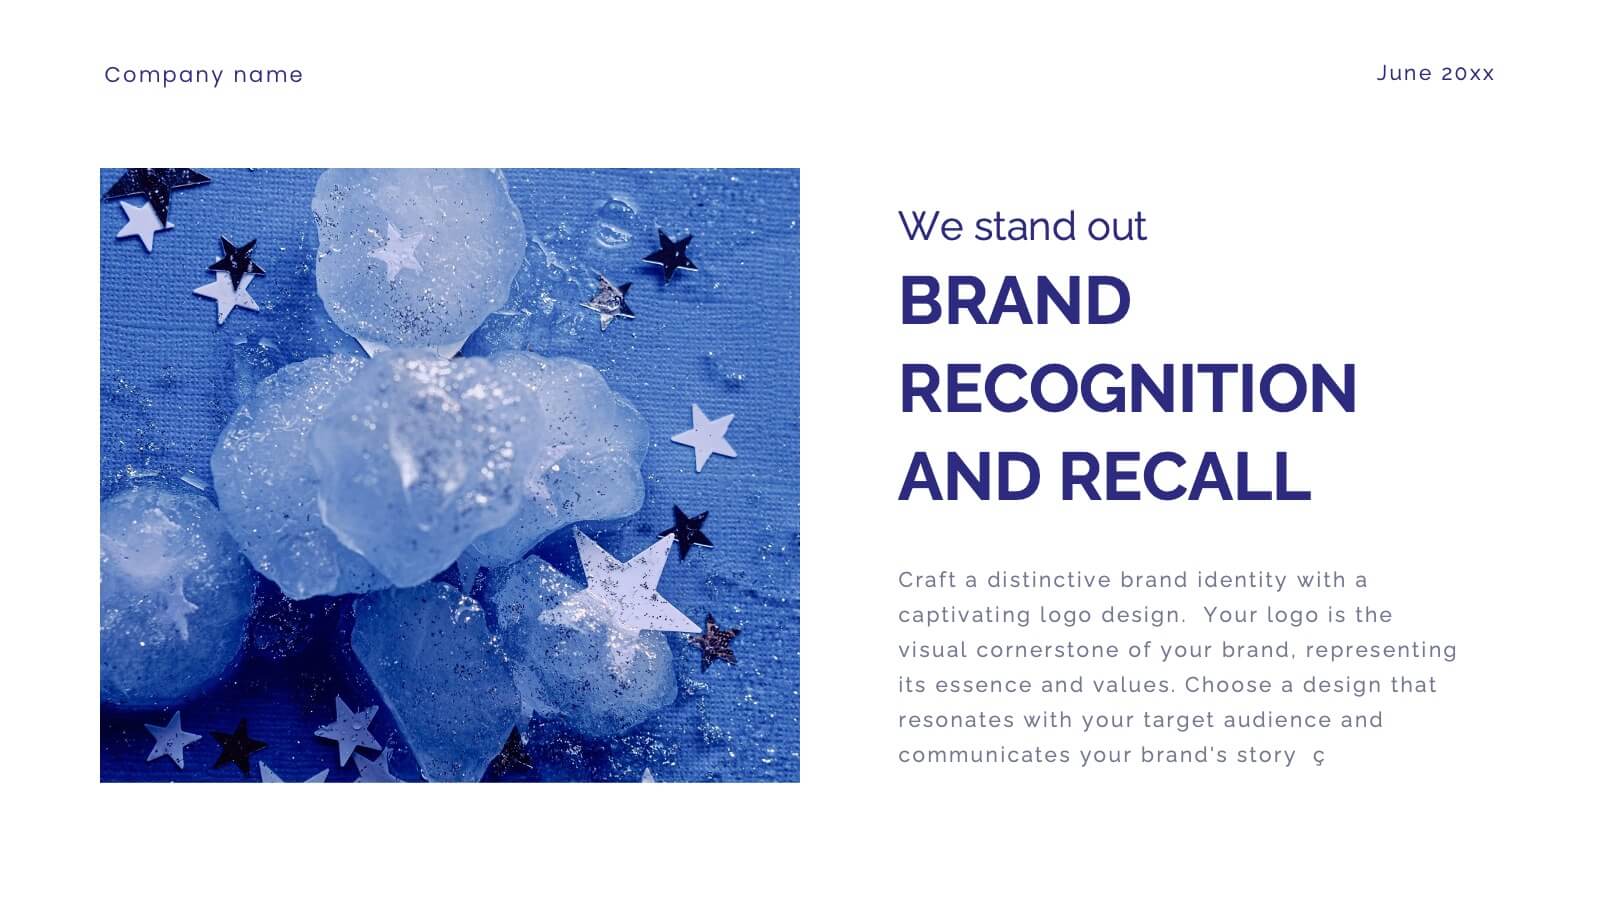
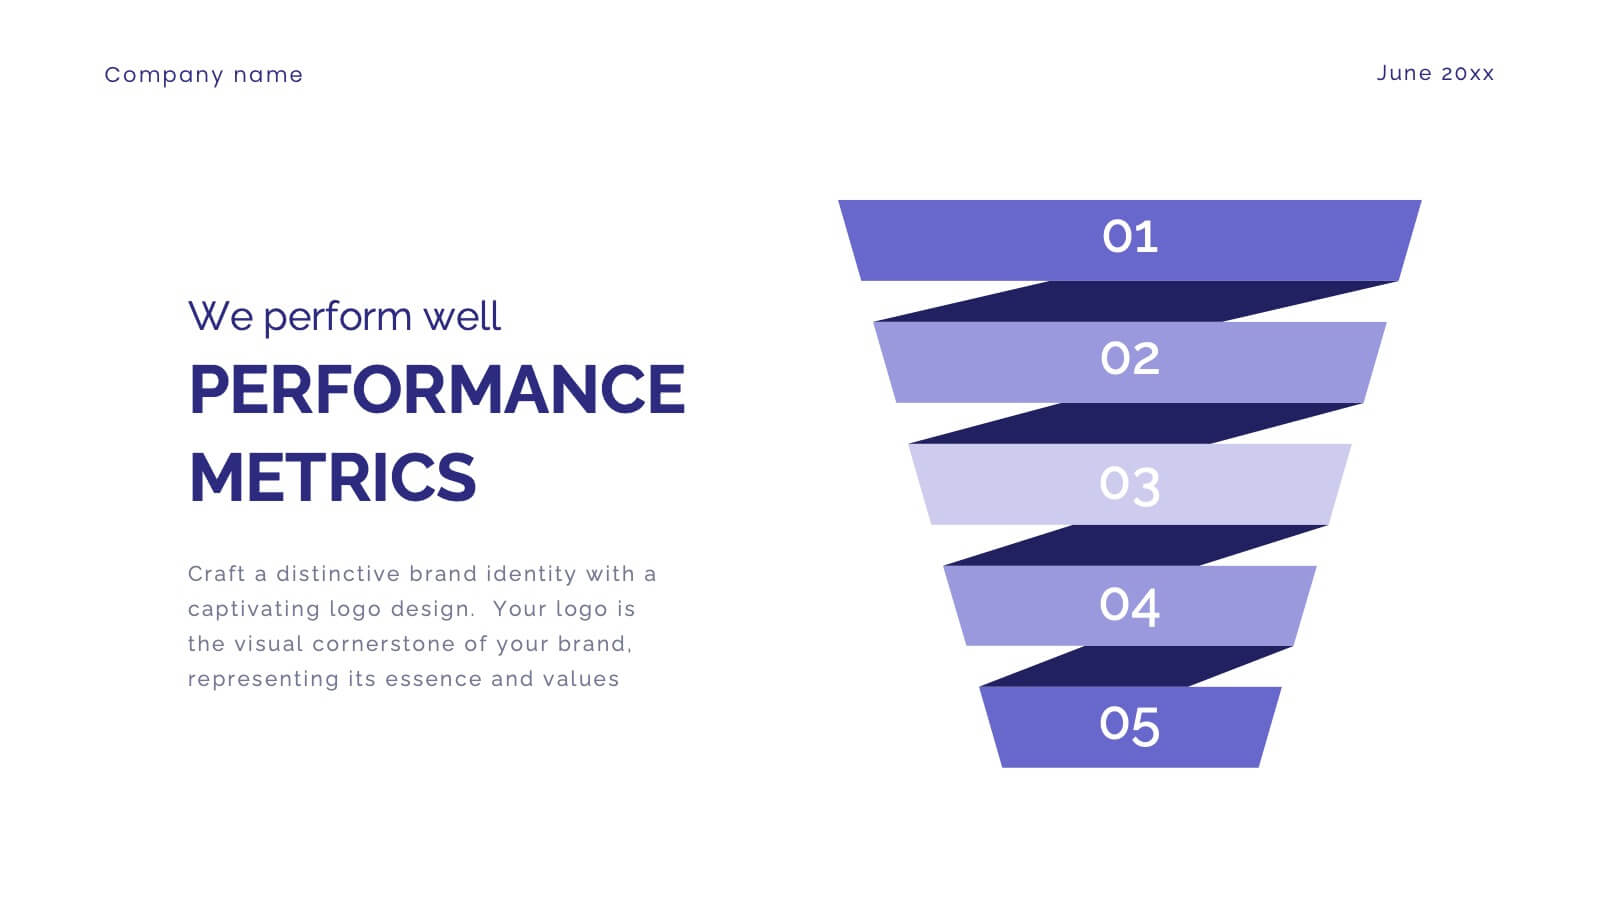
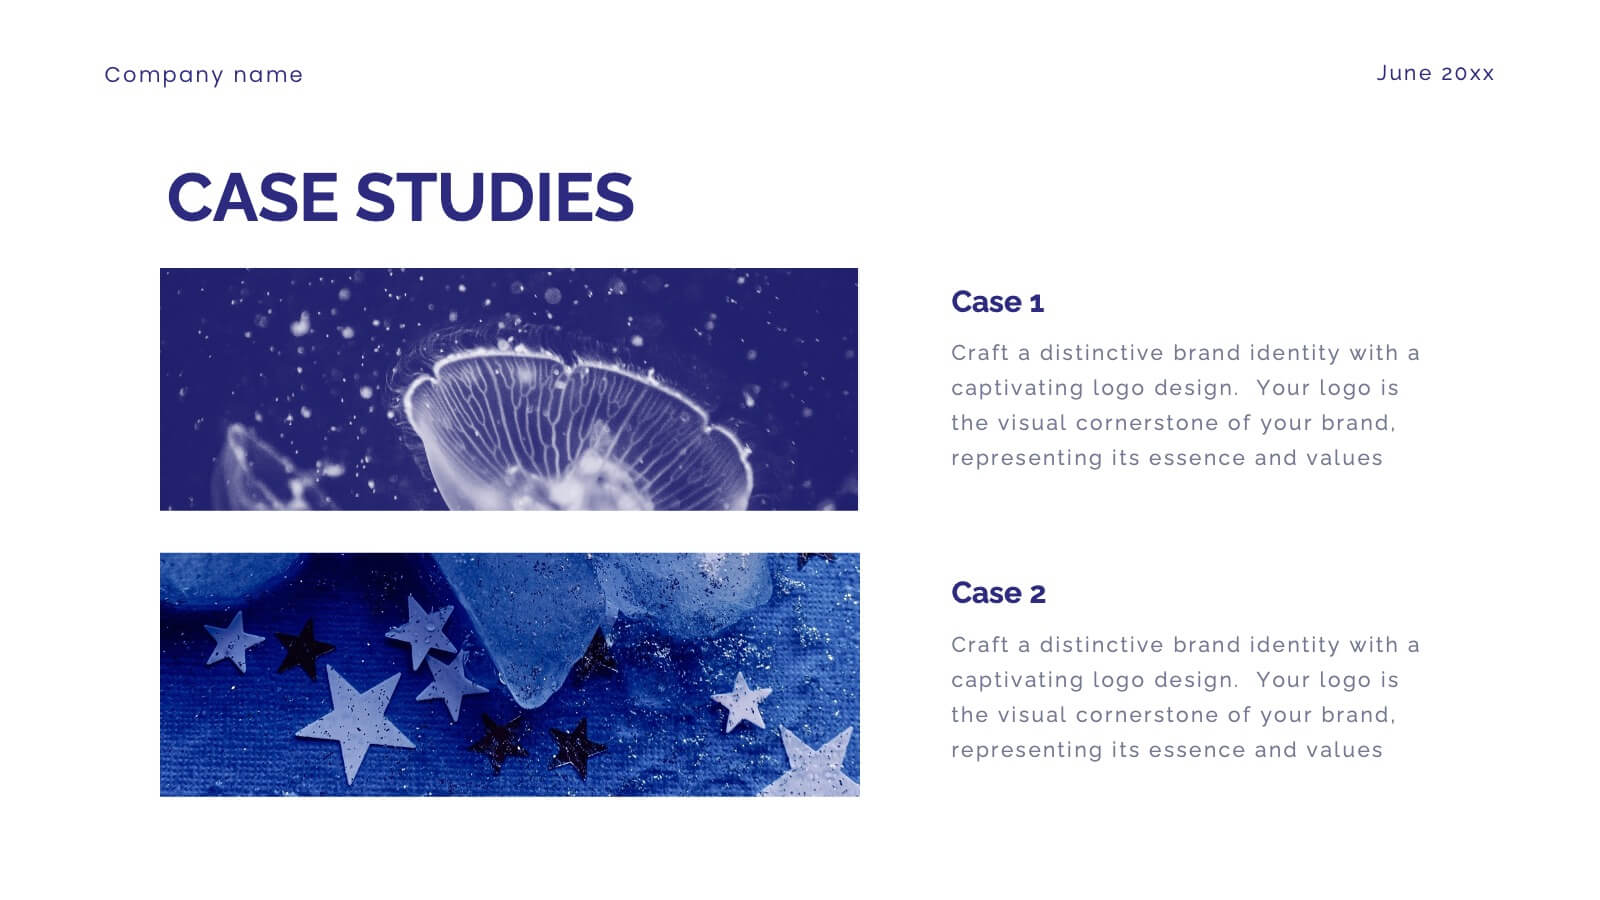
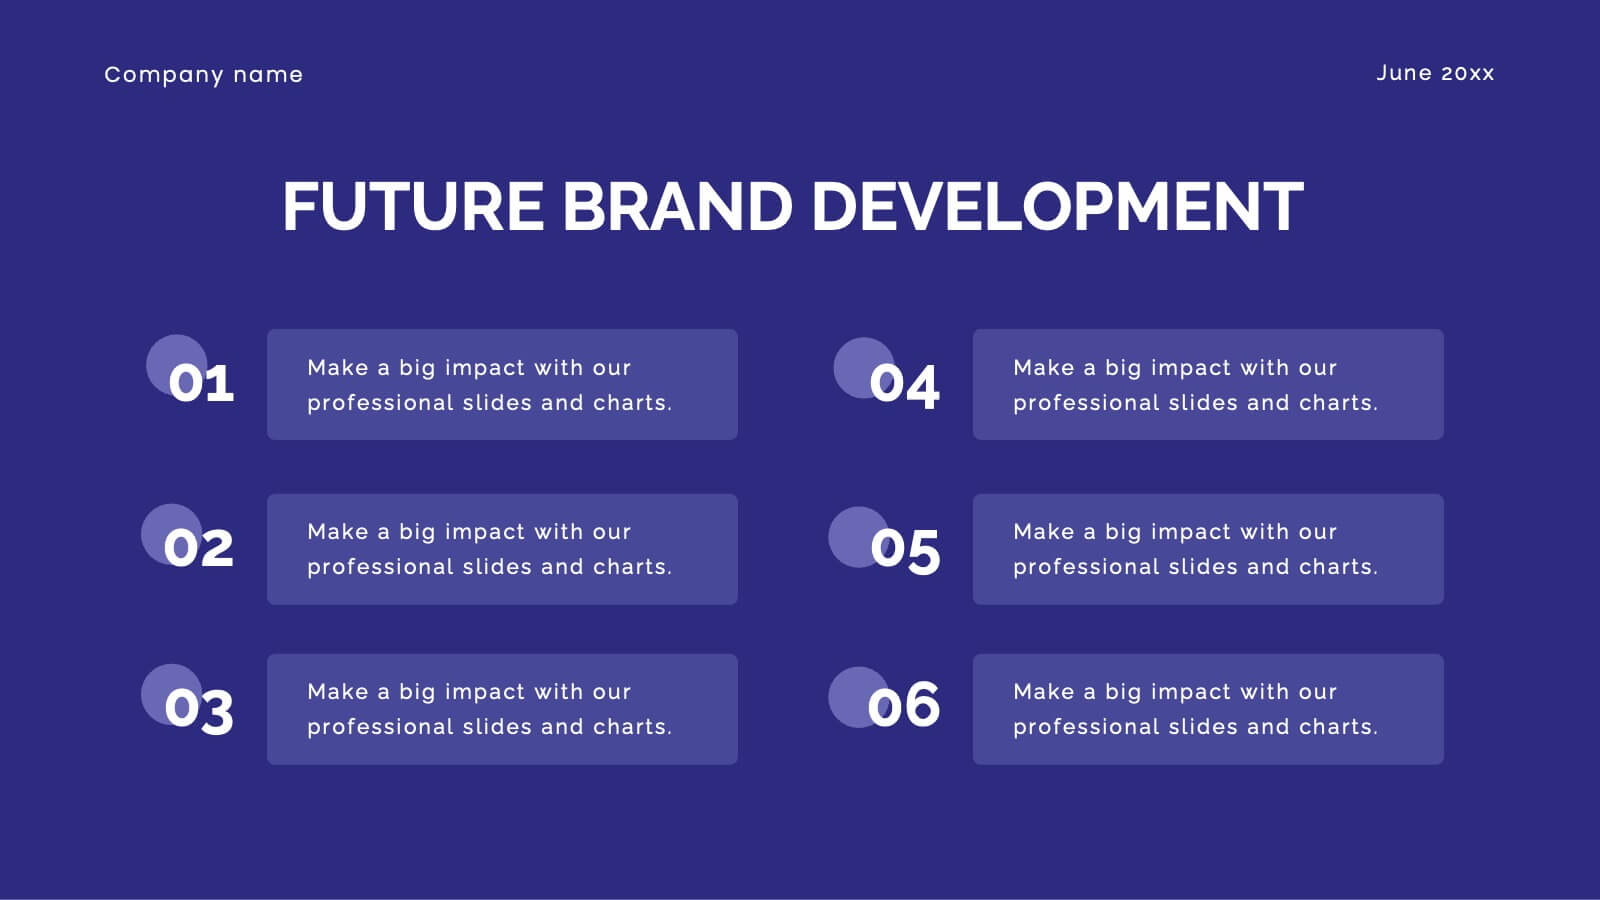
Glimmer Brand Development Pitch Deck Presentation
Elevate your brand with this comprehensive rebranding presentation template! Perfect for detailing your logo, color scheme, and market analysis, it includes slides for brand positioning, competitive landscape, and performance metrics. Engage your audience with clear visuals and structured content. Compatible with PowerPoint, Keynote, and Google Slides for seamless presentations on any platform.


6 slides
Business Process Checklist Overview Presentation
Simplify your workflow presentations with the Business Process Checklist Overview Presentation. This circular layout is ideal for outlining five sequential or cyclical steps in a business process, featuring icon-labeled checkpoints and editable titles. Each step is visually marked with subtle checkmarks, making it perfect for status tracking, task progression, or implementation plans. Clean, professional, and fully customizable in PowerPoint, Keynote, and Google Slides.


5 slides
Business Influence Stakeholder Analysis
Highlight influence and interest with this layered stakeholder analysis pyramid. Designed for strategic presentations, this layout categorizes engagement levels—Pull Communications, Push Communications, Consultant, Participation, and Partnership—across a 3D stacked model. Ideal for stakeholder mapping, influence management, and communication strategy planning. Fully editable in PowerPoint, Keynote, and Google Slides.


4 slides
Omnichannel Marketing Plan Overview Presentation
Visualize your cross-channel marketing strategy with this modern, megaphone-themed slide. Ideal for showcasing campaigns across multiple platforms, this layout helps communicate key marketing touchpoints in a clear and impactful format. Fully editable in PowerPoint, Keynote, and Google Slides—perfect for aligning marketing teams and presenting strategic plans with ease.


6 slides
Porter's Five Forces Management Infographic
Porter's Five Forces is a framework, that helps businesses understand the attractiveness and profitability of an industry by examining five key forces that shape its competitive landscape. These infographic templates provide a visually appealing and concise overview of Porter's Five Forces framework. They are designed to help businesses and professionals analyze the competitive dynamics of an industry and make informed strategic decisions. By using this to help your audience understand the forces that shape industry competitiveness, they can identify potential threats and opportunities to make informed decisions, and gain a competitive edge.


26 slides
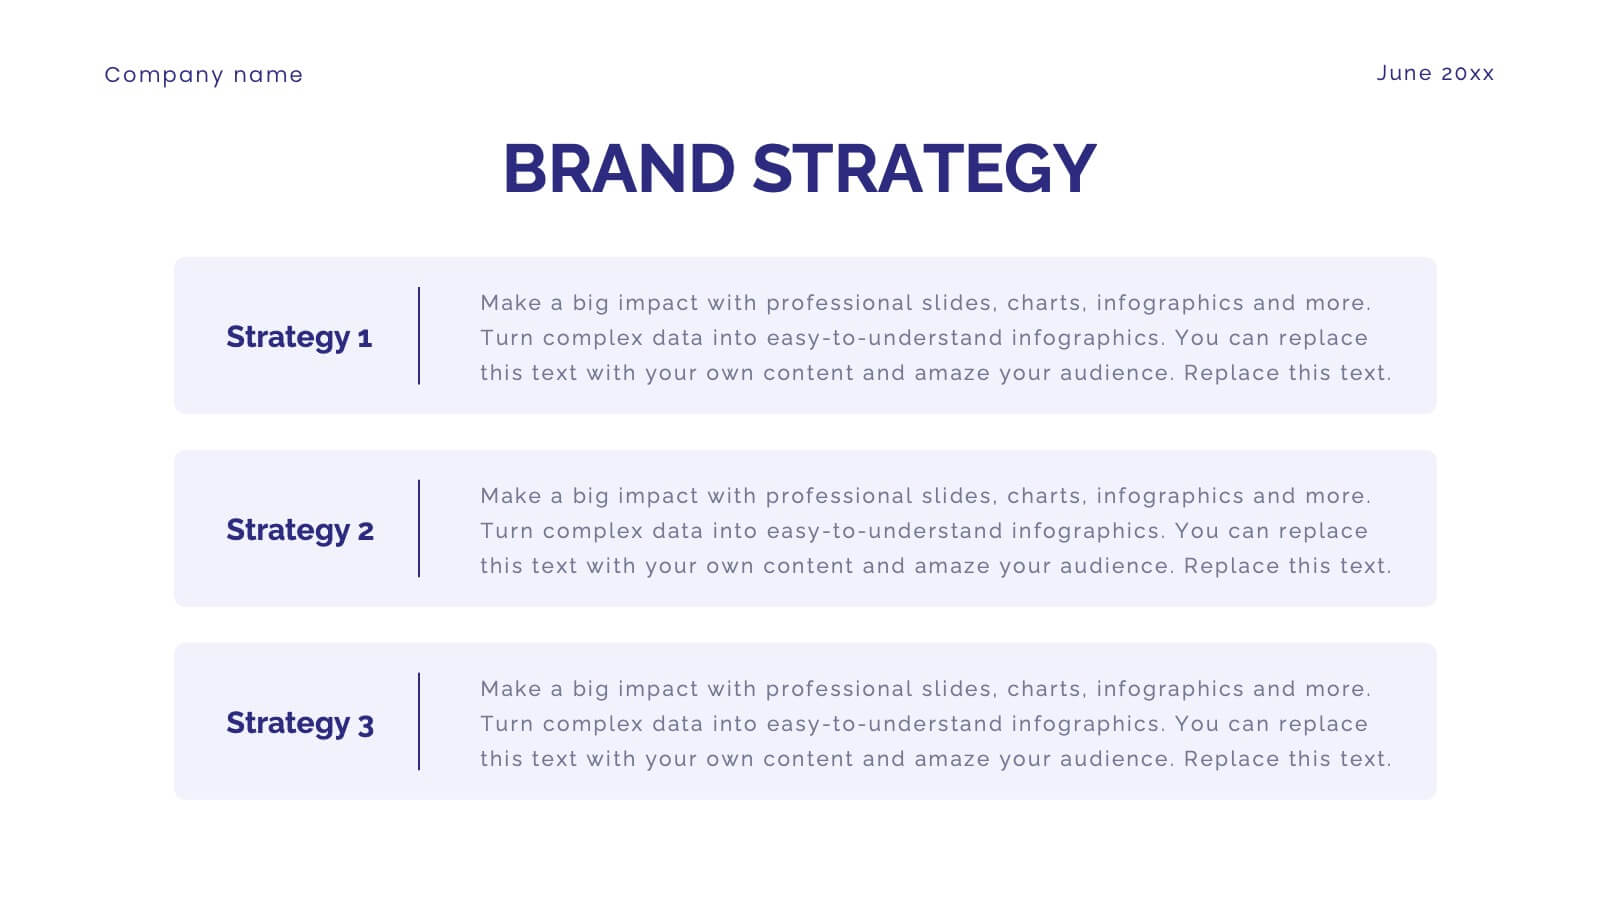
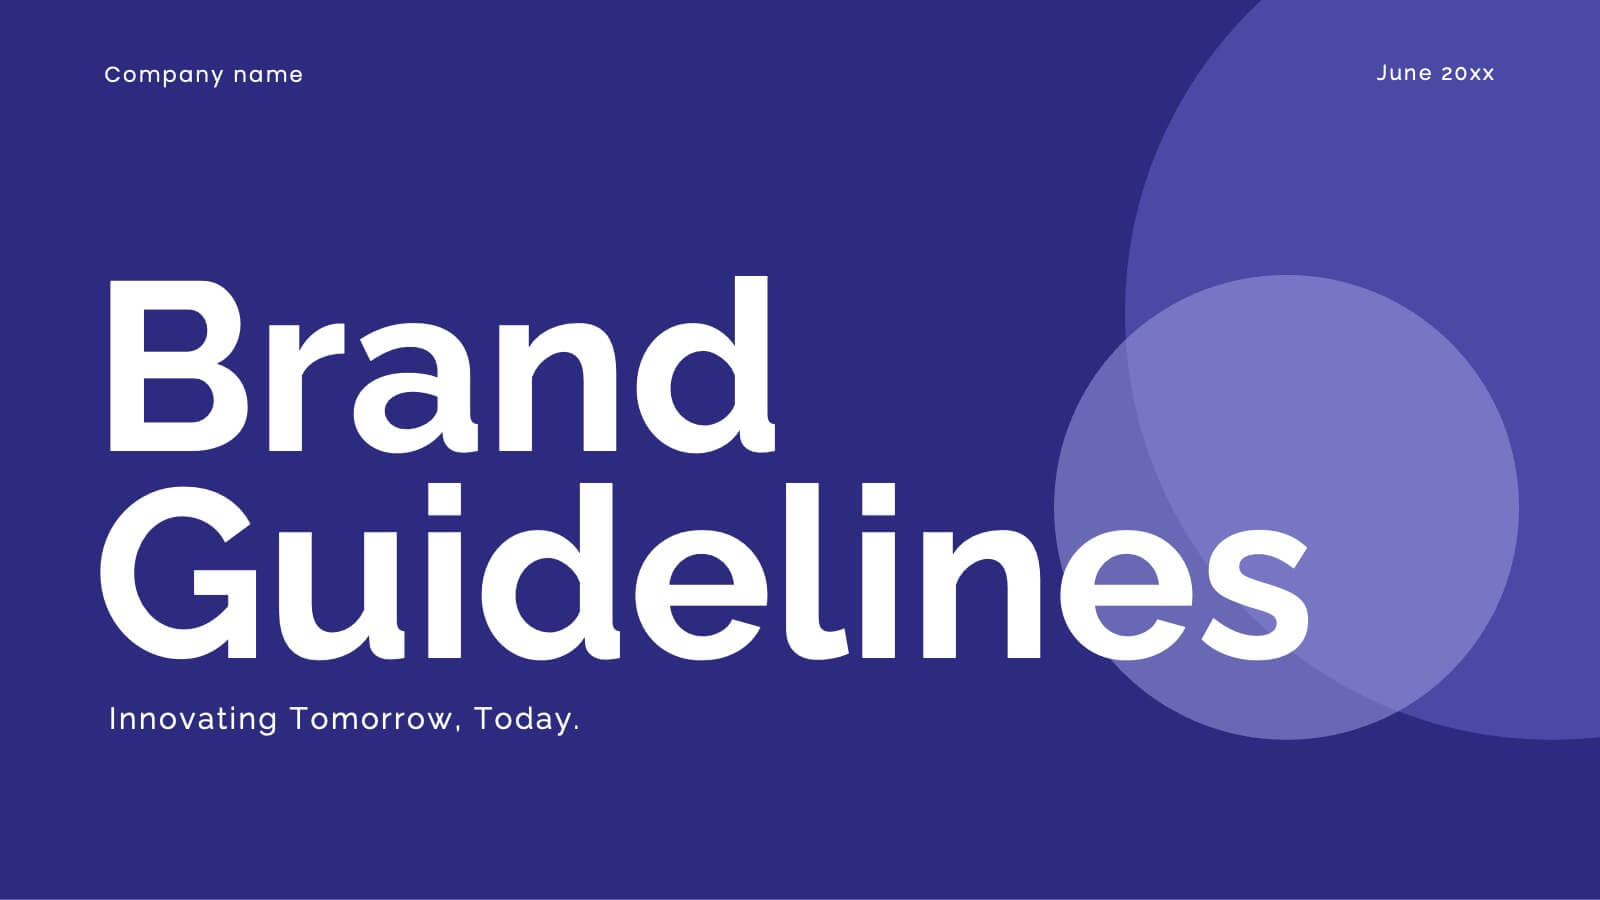
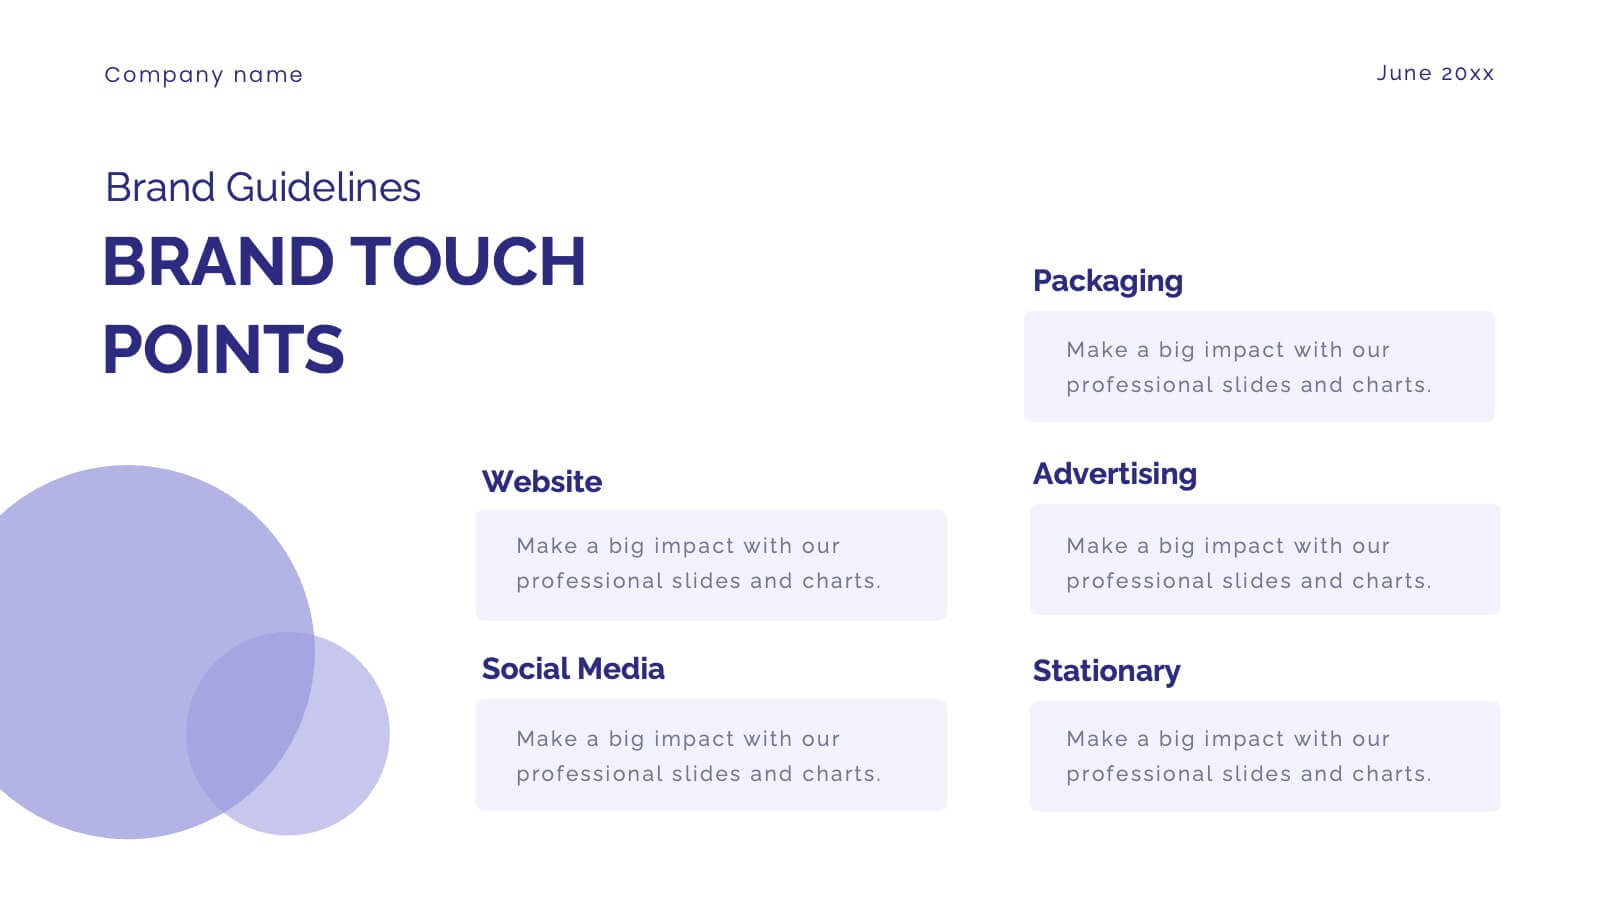
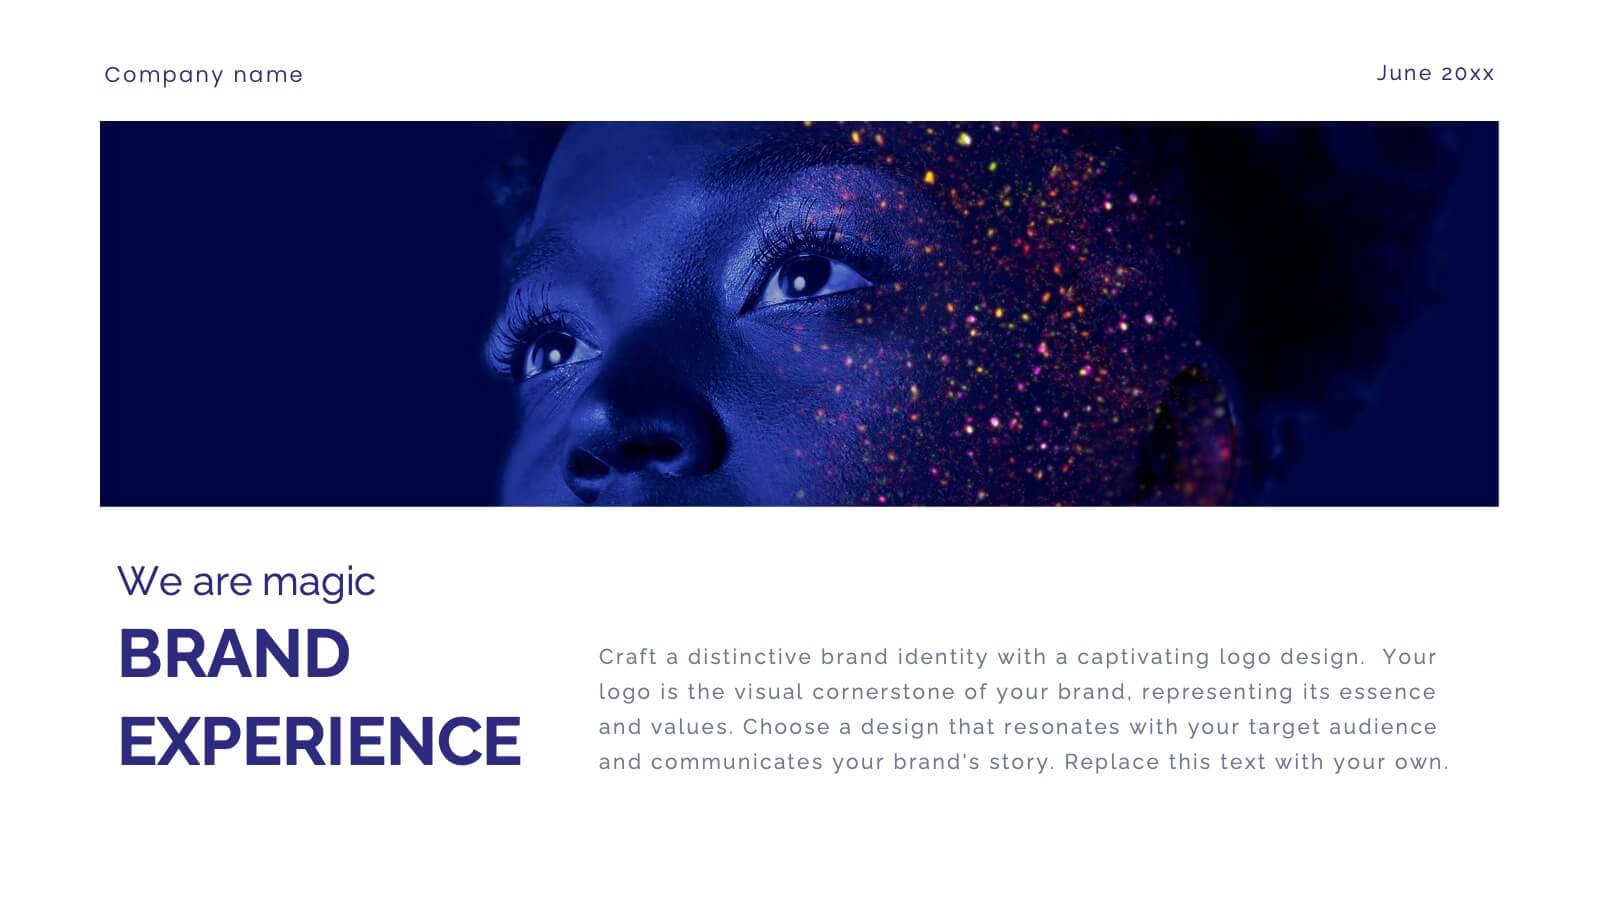
Forge Brand Strategy Report Presentation
The Brand Strategy Presentation Template is a sleek solution for showcasing brand identity. Highlight mission, values, audience personas, and future growth plans across 26 structured slides. Fully customizable for PowerPoint, Keynote, and Google Slides, it’s ideal for presenting brand insights to clients or stakeholders with professionalism and clarity.


22 slides
Arachne Digital Marketing Strategy Plan Presentation
Weave a powerful digital marketing strategy with this sleek, Arachne-inspired presentation! Perfect for outlining your digital marketing plans, this template helps you highlight key strategies, analytics, and campaign goals in a structured and visually engaging way. Its modern design keeps your audience focused. Compatible with PowerPoint, Keynote, and Google Slides.


6 slides
Social Science Infographics
The "Social Science" infographic template is an intellectually stimulating and visually engaging tool, thoughtfully designed for PowerPoint, Keynote, and Google Slides. This template is a brilliant resource for educators, researchers, and students who seek to present the multifaceted aspects of social sciences in a clear and compelling manner. This template skillfully encompasses various disciplines within social science, such as anthropology, sociology, psychology, and political science. It presents key theories, methodologies, and findings in an organized and digestible format. This makes it an invaluable aid for academic presentations, research proposals, or educational discussions, facilitating a deeper understanding of human society and social relationships. The design is as thought-provoking as the subject it represents, with a color scheme that stimulates intellectual curiosity while maintaining clarity and focus. This not only enhances the visual appeal of the presentation but also complements the analytical and reflective nature of social science. Whether used in a lecture hall, a conference, or a study group, this template ensures that the complex world of "Social Science" is presented in an engaging, informative, and visually captivating manner.


5 slides
Types of Pets Infographics
There are a wide variety of pets that people can choose from, depending on their preferences, lifestyle, and the level of care they are willing to provide. These infographic templates offer an engaging way to showcase different types of pets and provide valuable information to viewers. Its customizable features, visually appealing elements, and modern design make it an effective tool for educational presentations, pet-related events, or any presentation related to pet types and their characteristics. These infographics are perfect to showcase various types of pets that people can keep as companions.


6 slides
Numeric Data Slide Layout Presentation
Bring your numbers to life with a clean, flowing visual that turns data into an easy-to-follow story. This presentation guides viewers through each step of your process, helping them understand key insights without overwhelm. Ideal for analytics, reporting, and planning. Fully compatible with PowerPoint, Keynote, and Google Slides.


7 slides
Project Summary Infographic
This collection of project summary slides is designed to streamline the presentation of project outcomes and statuses effectively. The slides feature a variety of layouts tailored to emphasize critical data and conclusions, making them an ideal choice for project managers and teams who need to report on progress and results. Each slide is crafted with a clear focus on visual hierarchy, which helps in directing the viewer's attention to the most important information. Use of bullet points, charts, and infographics enhances the viewer's understanding by breaking down complex data into easy-to-digest visuals. Color coding is effectively utilized to differentiate between themes or topics, which aids in quick comprehension. These slides are versatile enough to be used in various scenarios, such as end-of-project presentations, stakeholder updates, or team meetings. They provide a professional and polished way to showcase project achievements, timelines, and future steps. Overall, these summary slides are a valuable tool for anyone looking to present project information clearly and concisely, ensuring that key points are communicated effectively and are memorable.


5 slides
Financial Market Trends and Forecast Presentation
Visualize economic shifts and data insights with this upward growth line infographic. Ideal for presenting financial forecasts, investment strategies, and market milestones, this layout features a stylized arrow path with icons, letter markers, and space for detailed annotations. Fully editable and compatible with PowerPoint, Keynote, and Google Slides.


7 slides
Europe Countries Map Infographic
This Europe Countries Map infographic template is a versatile presentation tool for showcasing various data across European nations. The template is fully compatible with PowerPoint, Google Slides, and Keynote and features different infographic styles, such as color-coded maps, bar charts, and statistical representations. It is perfect for displaying country-specific information like population size, economic statistics, or any other relevant data. The clear and concise design ensures that viewers can easily interpret the information, making it suitable for educators, students, business professionals, and anyone needing to present European data in an engaging and informative manner.


6 slides
Competitive Research and Strategy Review Presentation
Present your market insights with clarity using the Competitive Research and Strategy Review Presentation. This puzzle-style layout is ideal for showing strategic steps or comparing research points in sequence. Fully editable in Canva, PowerPoint, Keynote, and Google Slides, it’s perfect for marketing teams, business analysts, and strategy consultants.


5 slides
5G Use Cases and Industry Applications Presentation
Unlock the possibilities of next-generation connectivity with a clear, visual explainer designed to showcase how different industries benefit from faster, smarter networks. This presentation breaks down key applications, technology shifts, and real-world 5G impact in an easy, engaging format. Fully compatible with PowerPoint, Keynote, and Google Slides.