


Features
- 5 Unique slides
- Fully editable and easy to edit in Microsoft Powerpoint, Keynote and Google Slides
- 16:9 widescreen layout
- Clean and professional designs
- Export to JPG, PDF or send by email


Do you have any questions?
Recommend


4 slides
Circular Data Flow in Systems Presentation
Visualize relationships and flow within your systems using the Circular Data Flow in Systems Presentation. Ideal for showcasing input-output dynamics, data loops, or stakeholder interaction, this diagram presents centralized nodes with surrounding connectors for clarity. Each element is editable and works seamlessly in PowerPoint, Google Slides, and Canva.


4 slides
Aviation Industry Overview Presentation
Bring your data in for a smooth takeoff with this clean and modern visual layout. Perfect for presenting industry insights, market trends, or operational performance, this design helps convey complex information with clarity and flow. Fully editable and compatible with PowerPoint, Keynote, and Google Slides for seamless customization.


5 slides
Dealing With Cyberbullying Infgraphics
Cyberbullying refers to the act of using digital communication platforms such as social media, instant messaging, online forums, or email to harass, intimidate, or harm others. This infographic template is designed to raise awareness about cyberbullying and provide guidance on how to effectively deal with it. This template aims to educate individuals, parents, educators, and organizations about the impact of cyberbullying and empower them to prevent and address this issue. This template can be used by schools, community organizations, or online safety advocates to raise awareness about cyberbullying, and foster a safer online environment.


8 slides
Three Phase 30-60-90 Strategy Presentation
Give your roadmap a dynamic, flowing rhythm with a clean three-phase layout that makes each milestone feel clear, actionable, and easy to present. This presentation helps you outline priorities, track progress, and communicate strategic goals with confidence and simplicity. Fully editable and compatible with PowerPoint, Keynote, and Google Slides.


7 slides
6 Steps Circle Diagram
Streamline complex processes with our "6 Steps Circle Diagram" template. This visually appealing infographic elegantly organizes interconnected stages in a circular layout, ideal for outlining workflows, development cycles, or project phases. Each segment is color-coded and provides ample space for detailed descriptions, enhancing the clarity and effectiveness of presentations. This format allows viewers to easily grasp relationships and dependencies, improving comprehension and retention. Perfect for educators, project managers, and business analysts, this template ensures that all stages are interconnected and clearly communicated. Compatible with PowerPoint, Keynote, and Google Slides, it's a versatile tool for professional and educational environments.


4 slides
Ishikawa Diagram for Process Review Presentation
Visualize cause-and-effect relationships with the Ishikawa Diagram for Process Review Presentation. Also known as a fishbone diagram, this template is perfect for identifying potential root causes during quality control or team brainstorming sessions. Easily editable in Canva, PowerPoint, and Google Slides to match your workflow and style.


20 slides
Crescendo Creative Design Report Presentation
Transform your creative design report into a captivating presentation with a dynamic and professional template. This versatile format is tailored for designers, agencies, and creatives who want to showcase their design process, strategic approach, and project outcomes effectively. From design briefs and target audience insights to mood boards and prototypes, every slide is crafted to enhance clarity and visual appeal. Highlight unique elements, design systems, and implementation strategies with organized layouts that leave a lasting impression. Use the project timeline and feedback sections to narrate your journey and collaboration efforts seamlessly. Compatible with PowerPoint, Google Slides, and Keynote, this fully editable template adapts to your brand's needs. Engage stakeholders and clients with a polished, modern design that reflects your creative excellence.


5 slides
Business Statistics Infographic Report Presentation
Present data with clarity using the Business Statistics Infographic Report presentation. This layout combines clean bar graphs, donut charts, and legends to showcase KPIs, progress benchmarks, and segmented insights. Ideal for quarterly reviews, executive updates, or client reporting. Fully editable in PowerPoint, Keynote, or Google Slides.


6 slides
Business Model Hexagon Infographic Presentation
Break down complex strategies with the Business Model Hexagon Infographic Presentation. This sleek, six-part hexagonal layout is perfect for illustrating interconnected components like operations, value propositions, and customer segments. Fully editable and easy to customize in PowerPoint, Keynote, or Google Slides—ideal for startups, consultants, and corporate teams.


5 slides
Eco-Friendly Practices Summary Presentation
Bring your green initiatives to life with a vibrant, city-inspired visual that makes sustainability easy to explain and engaging to explore. This presentation helps you outline key eco-friendly efforts, goals, and results in a clean, modern layout. Fully customizable and compatible with PowerPoint, Keynote, and Google Slides.


21 slides
Logos Content Marketing Pitch Deck Presentation
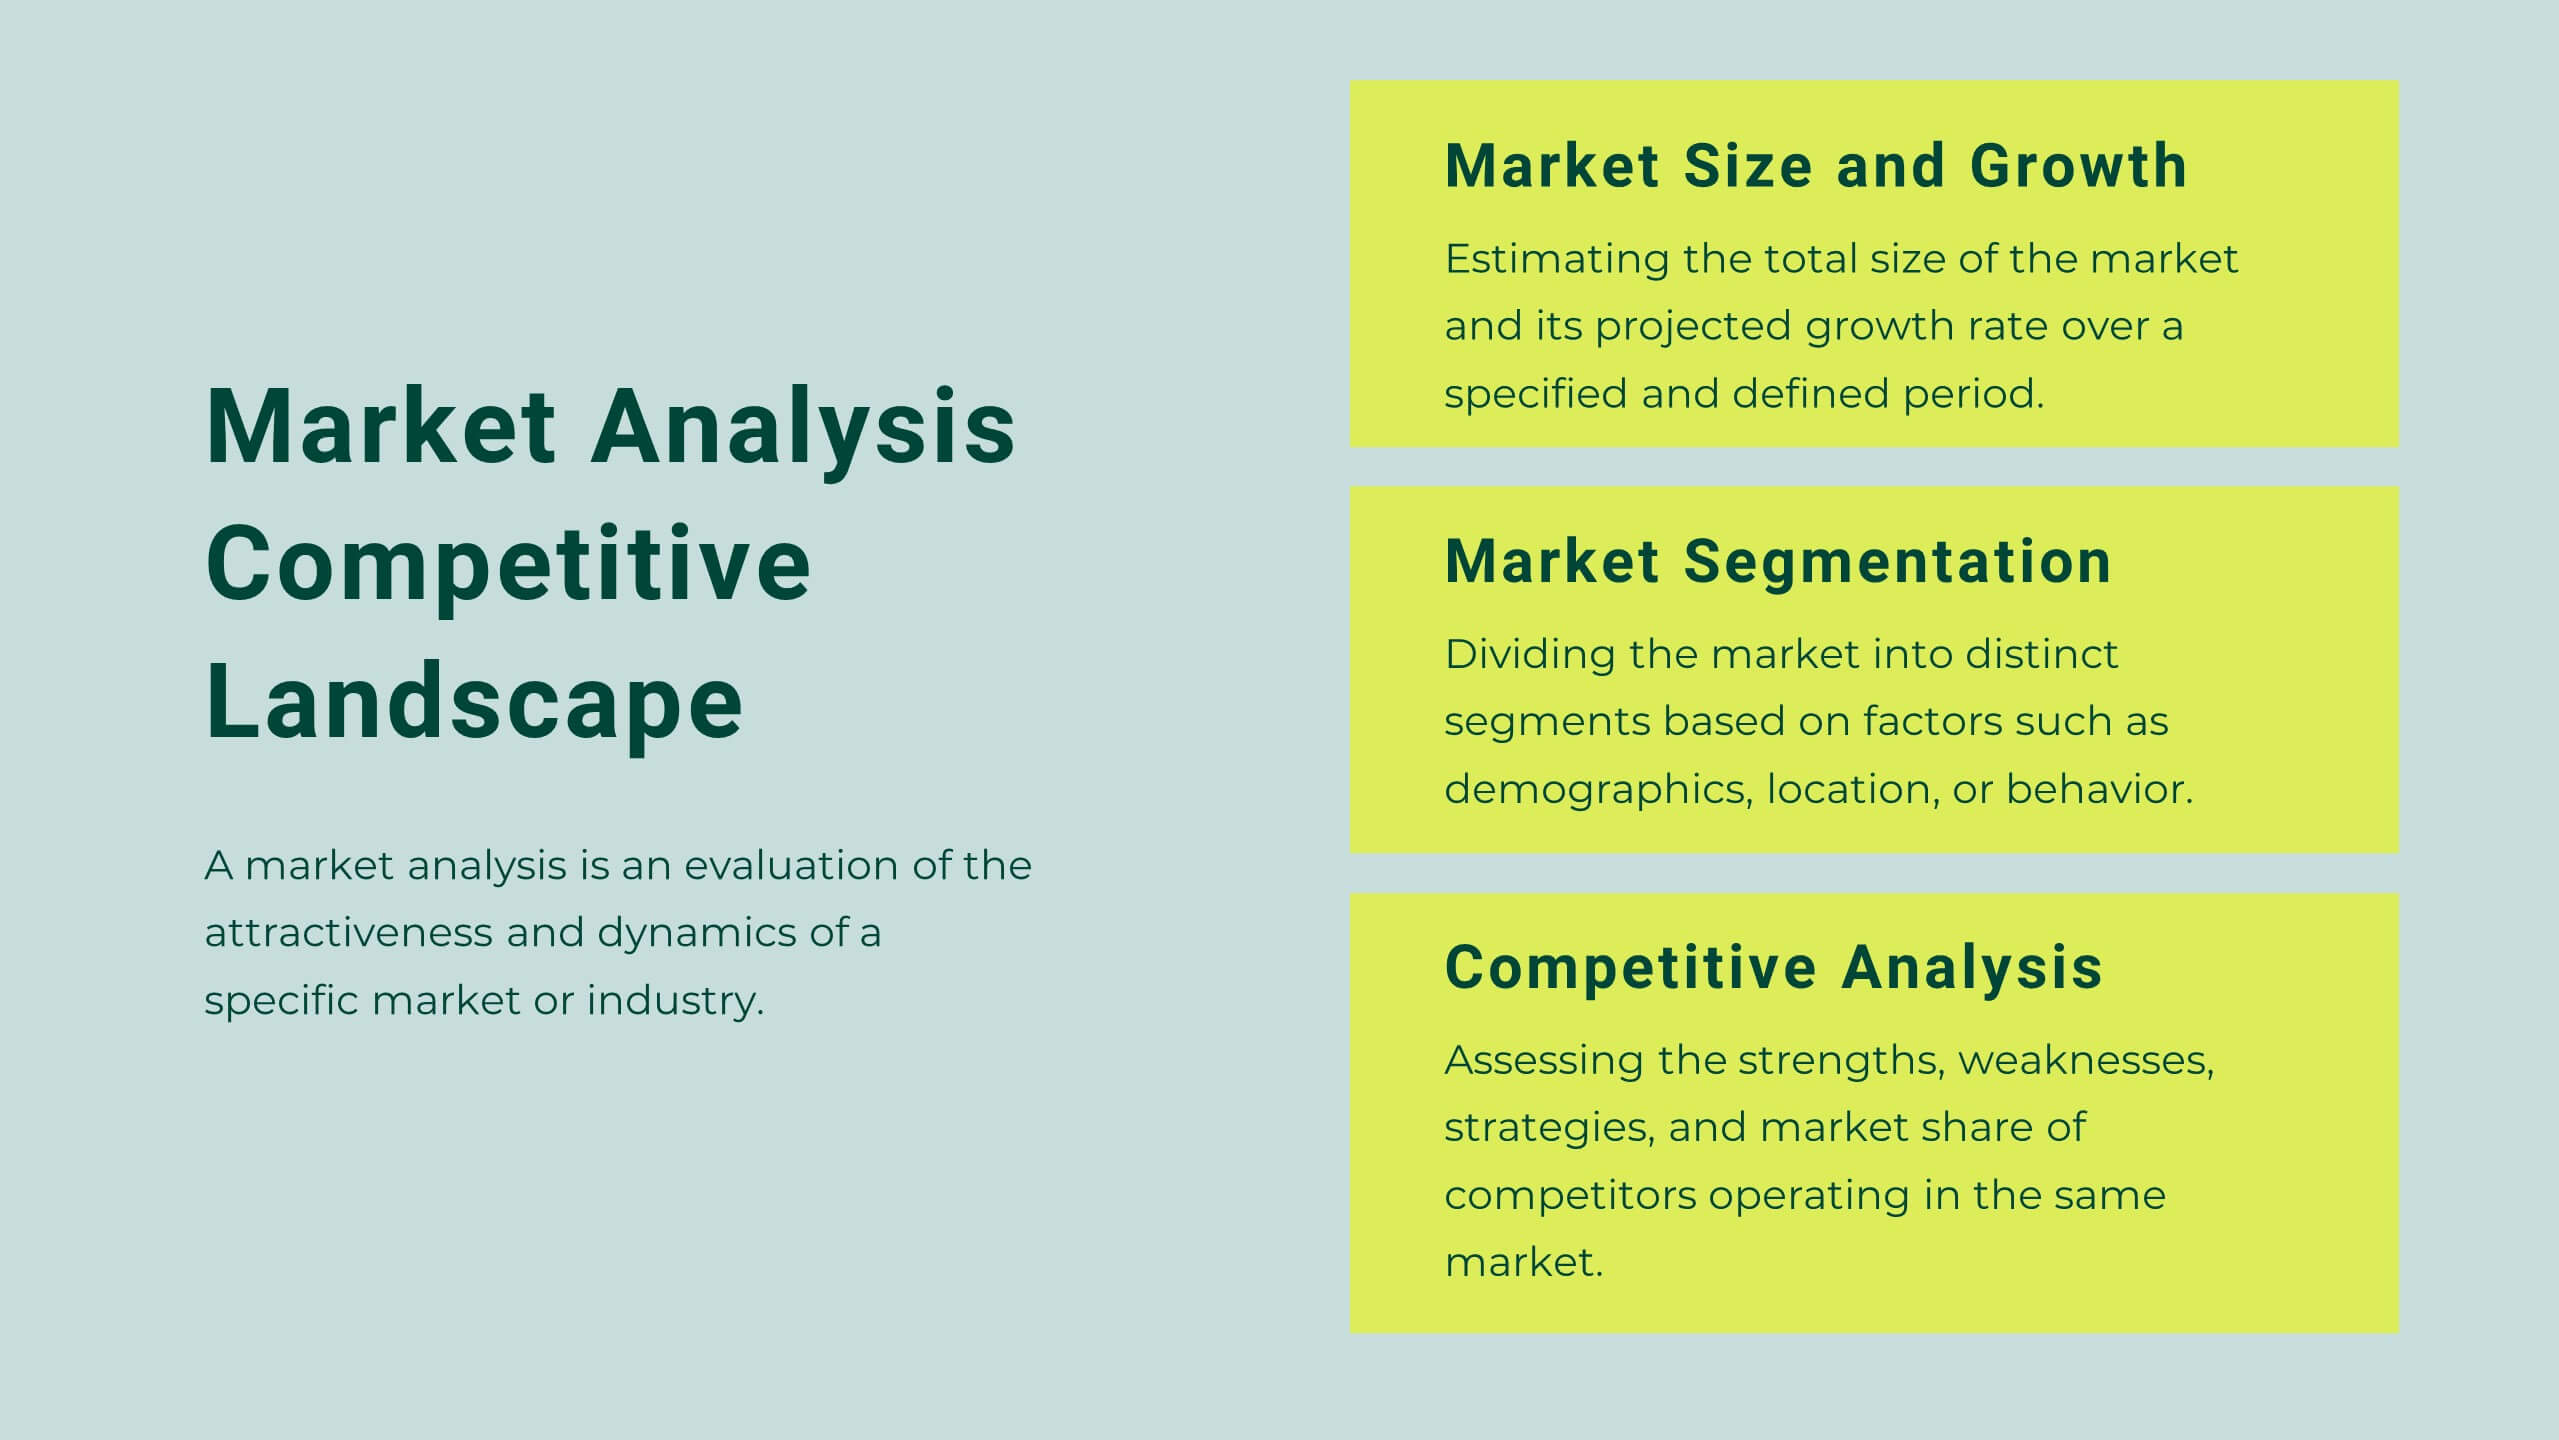
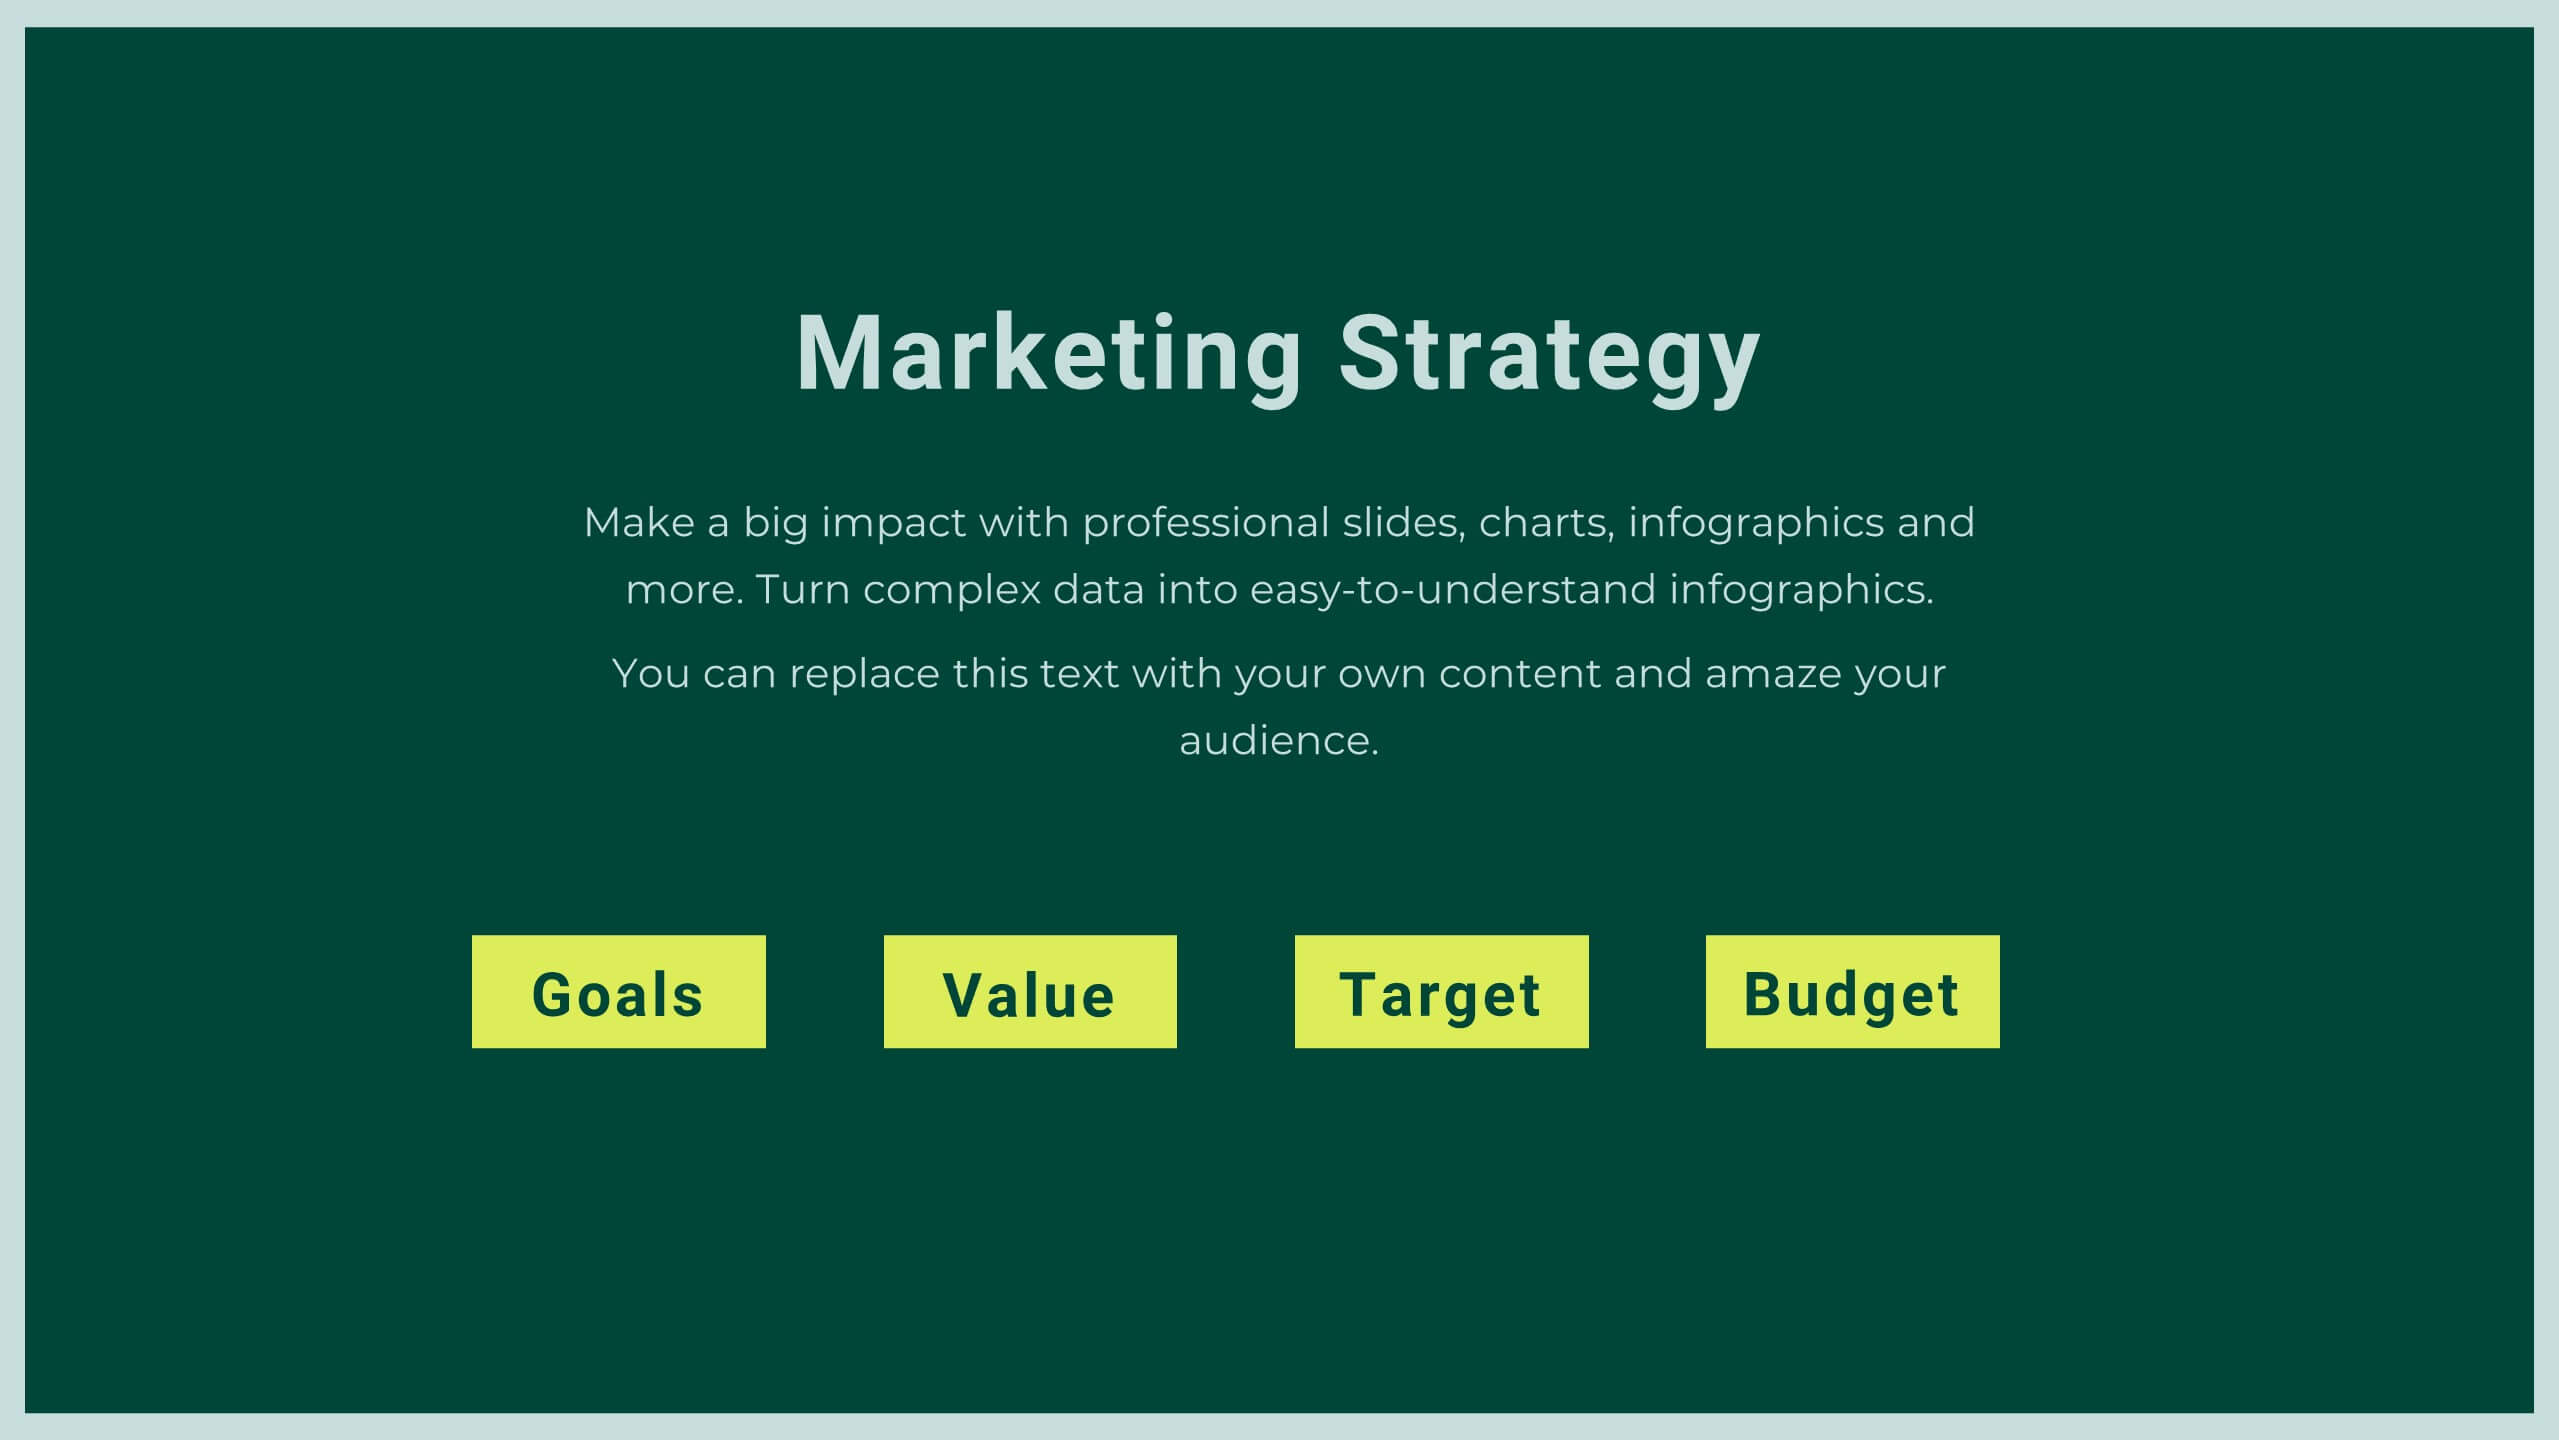
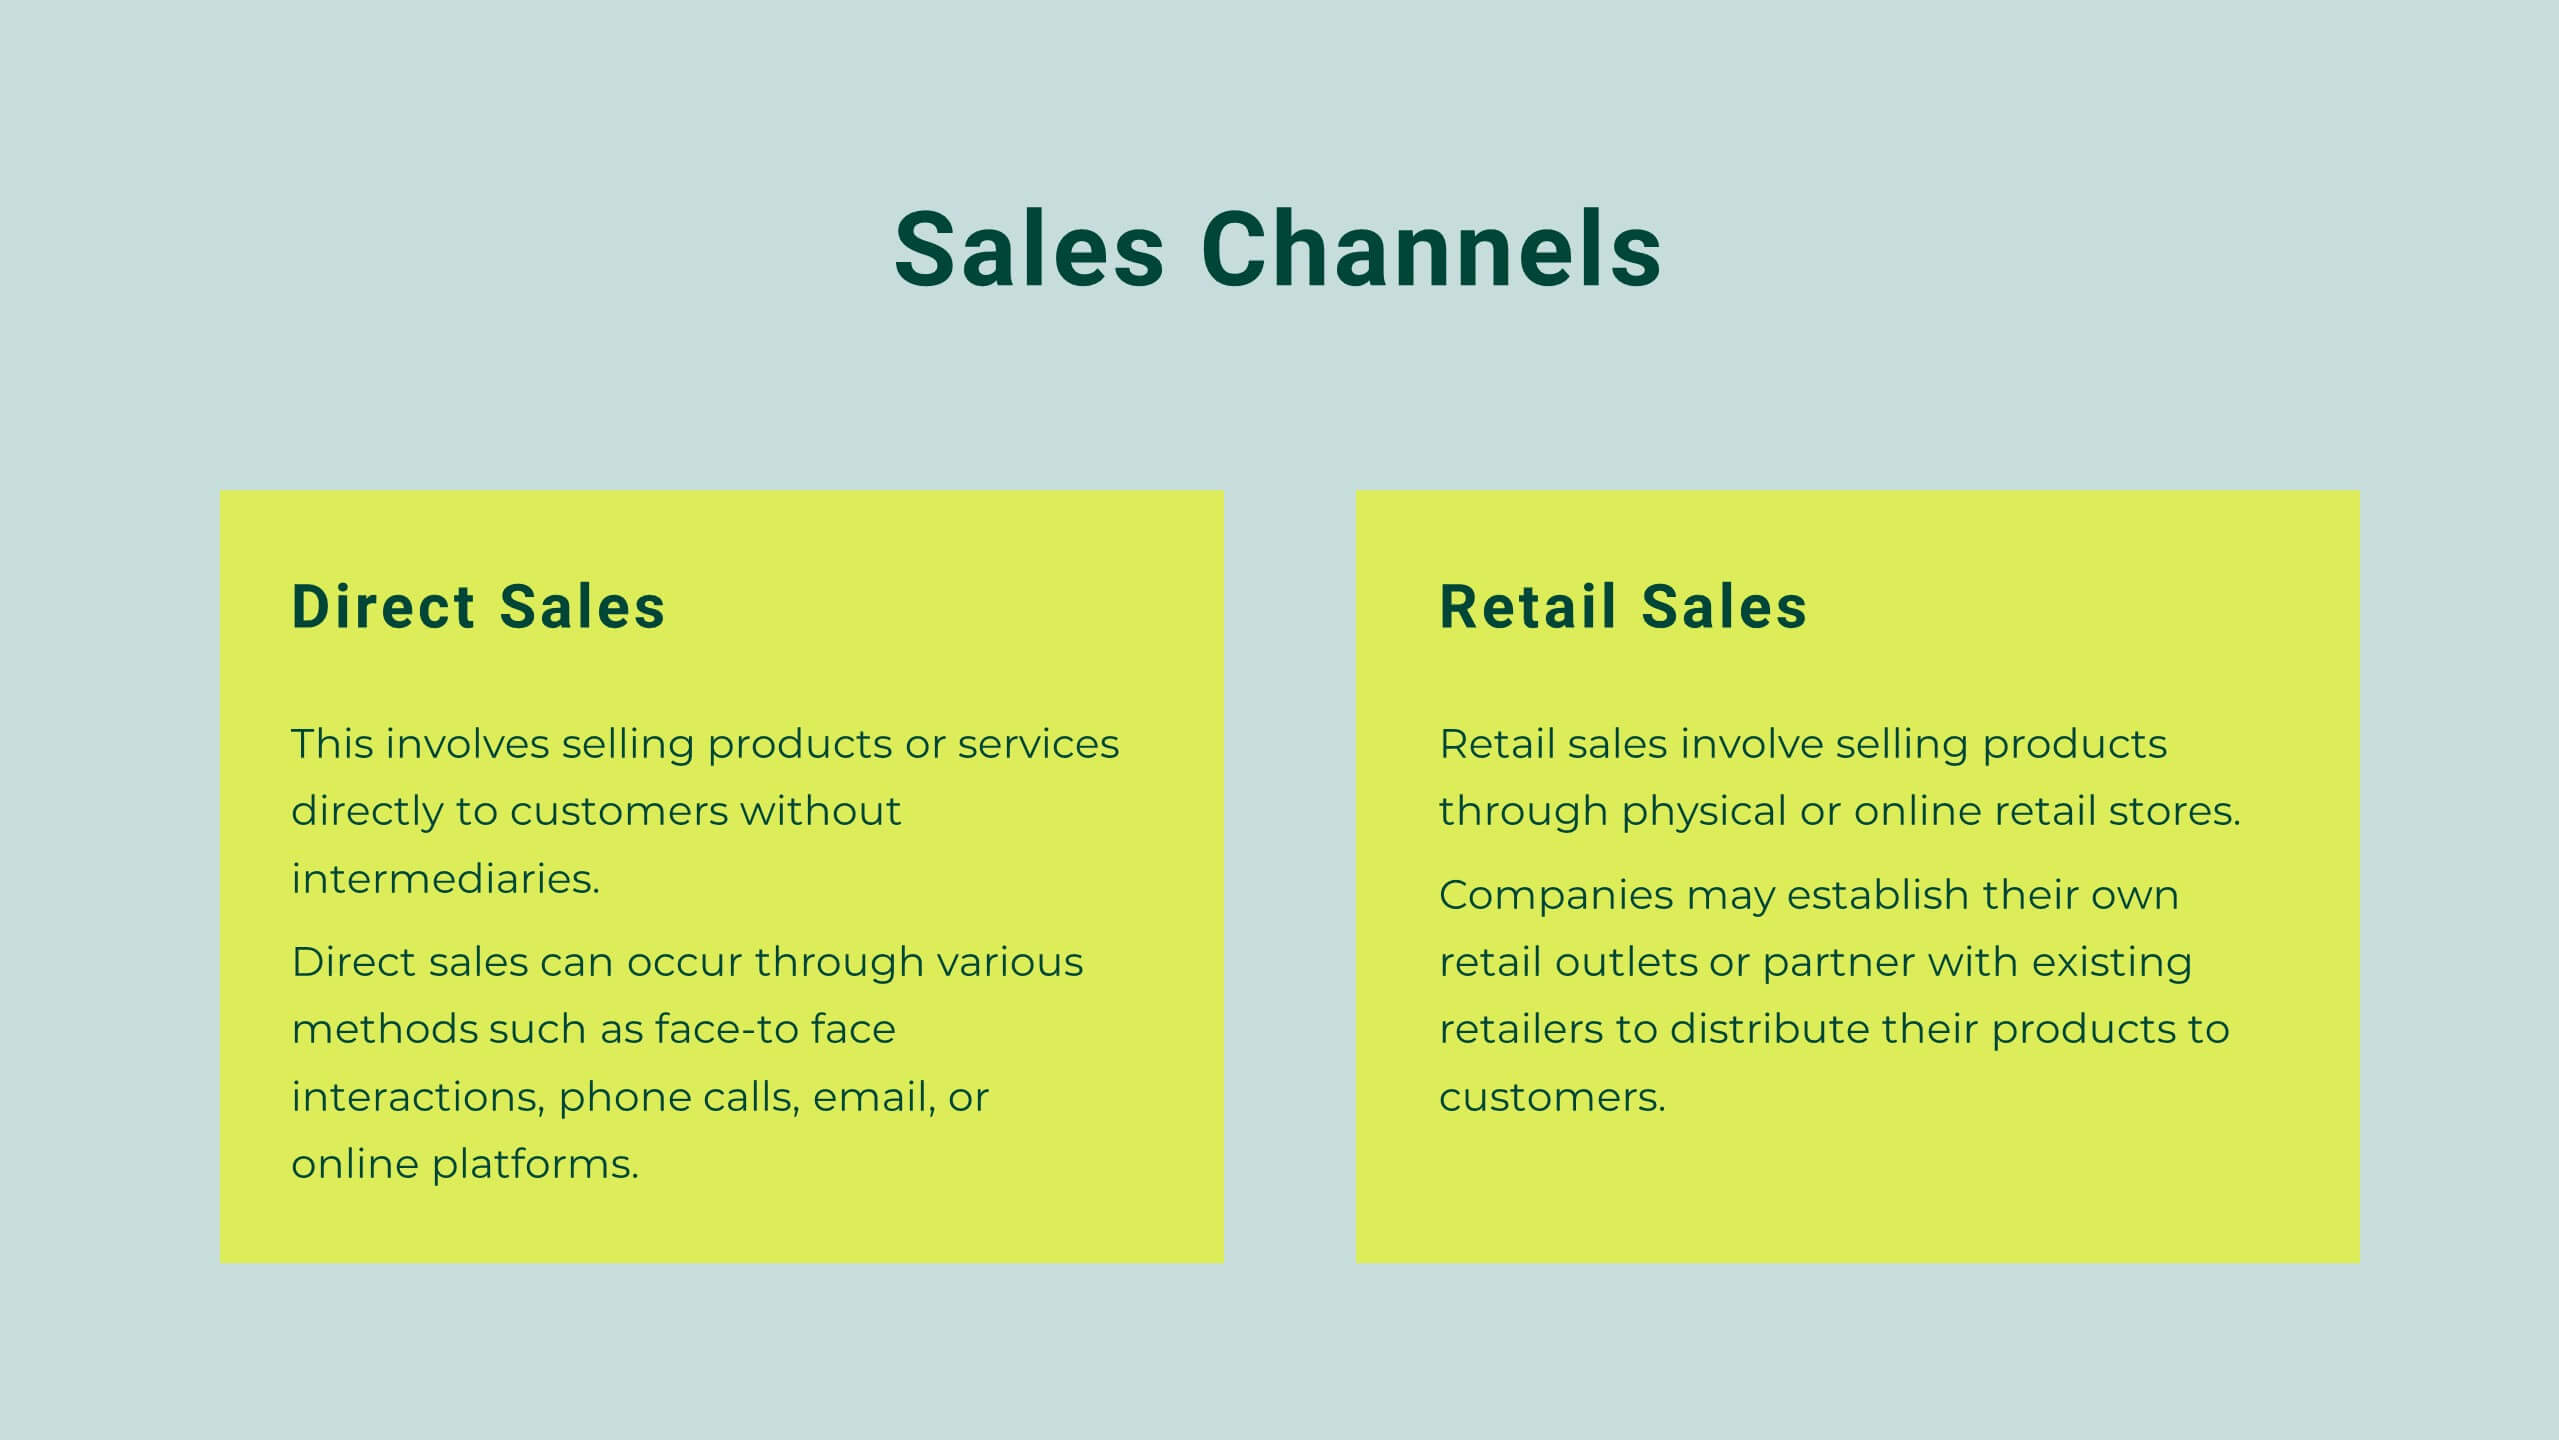
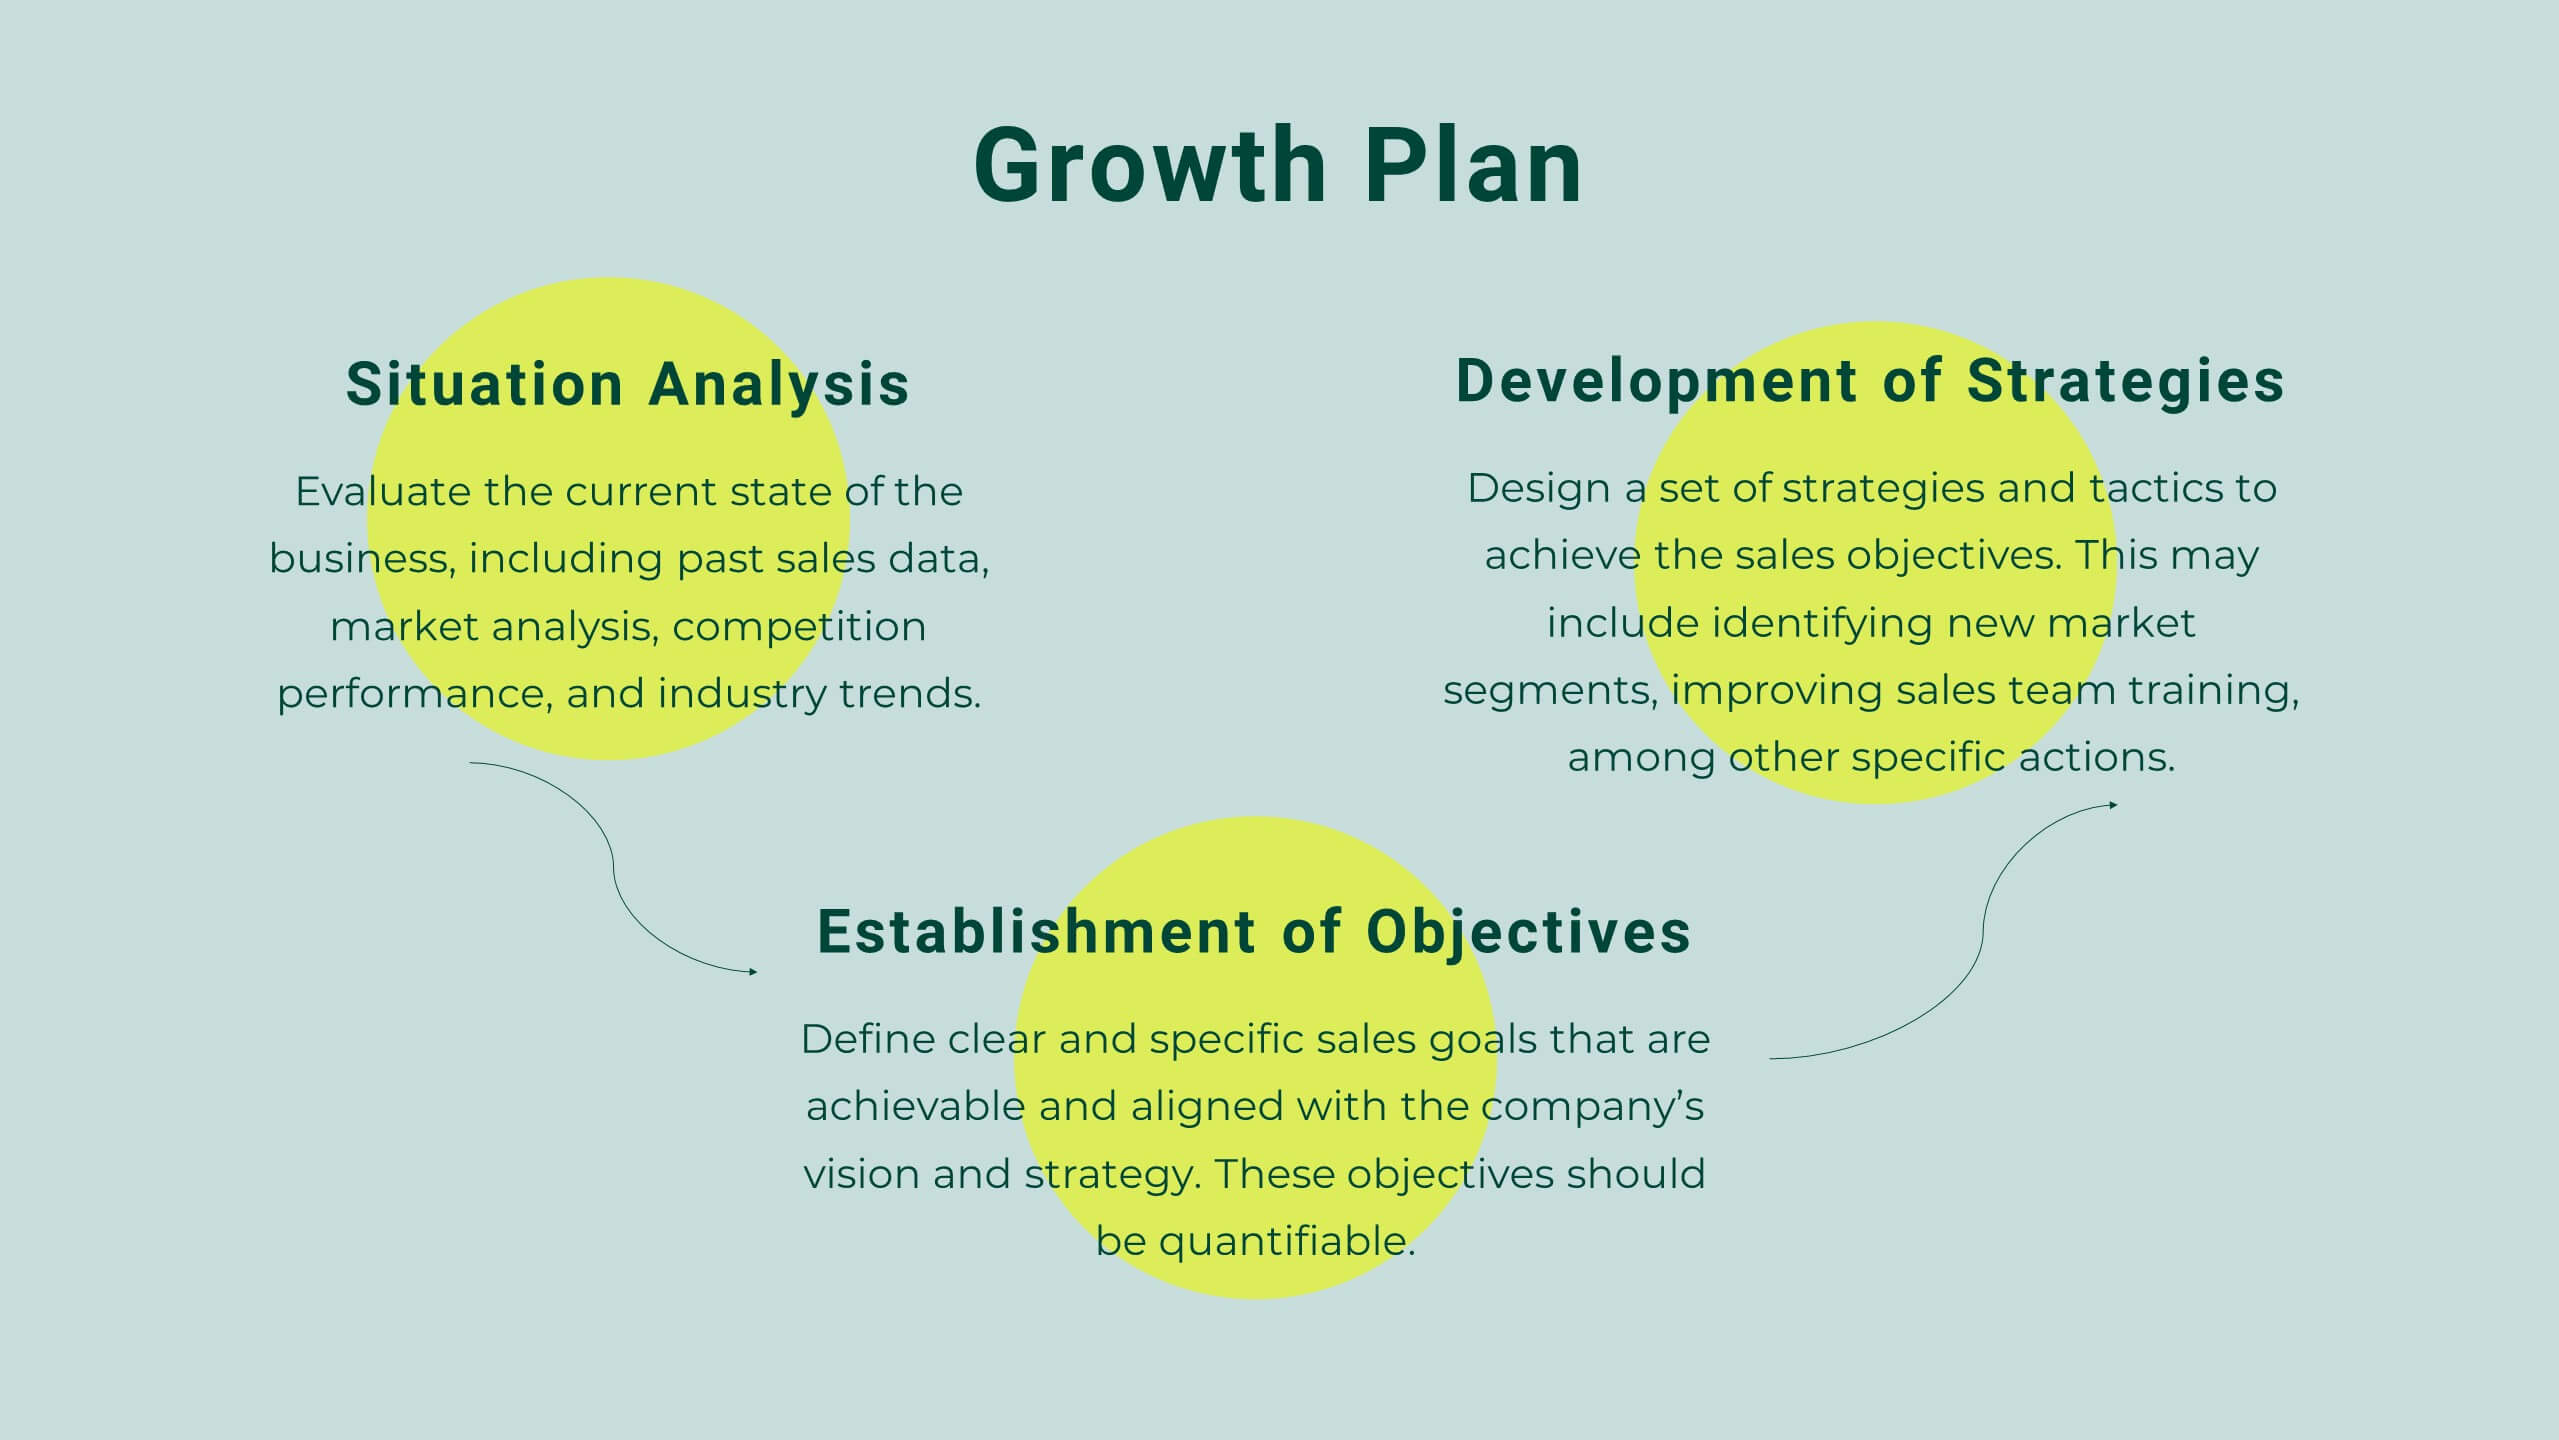
The Marketing Presentation Template is designed for impactful business storytelling. With 20+ slides, it features sections for company history, core values, target audience, competitive analysis, growth plans, and testimonials. Ideal for agencies and brands, it's fully customizable and compatible with PowerPoint, Keynote, and Google Slides. Perfect for pitching ideas effectively!


6 slides
Value Chain Model Infographic
The Value Chain Model is a concept developed by Michael Porter to understand and analyze how businesses create and deliver value to their customers. This infographic template illustrates the various activities and processes involved in creating and delivering a product or service to customers. This template is a strategic tool that breaks down the activities of a company into primary and support activities. This infographic breaks down the value chain into distinct stages, each contributing to the overall value and success of the business. It is a powerful tool for analyzing and understanding the competitive advantage of a company and identifying areas for improvement.


21 slides
Nimbus Startup Growth Plan Presentation
Supercharge your startup's growth with this vibrant presentation template! Ideal for outlining your business plan, it includes slides for mission, market analysis, and financial overview. Capture investor attention with clear visuals and compelling content. Compatible with PowerPoint, Keynote, and Google Slides for a seamless presentation experience on any platform.


7 slides
Market Focus and Demographic Insights Presentation
Present your audience data with clarity using this Market Focus and Demographic Insights presentation. Designed with a central persona and six key data points, this slide helps visualize customer characteristics, behavioral trends, and strategic targets. Great for marketing, branding, or investor decks. Fully editable in Canva, PowerPoint, and Google Slides.


10 slides
Project Management Stages
Master project management with our "Project Management Stages" template. This visually engaging presentation design effectively illustrates the project lifecycle across five key stages: Initiation, Planning, Execution, Monitoring, and Closure. Each stage is distinctively represented by a colored 3D block, visually stacked to highlight the progression and foundational importance of each phase. This clear, structured layout simplifies complex processes and emphasizes effective project management techniques. Ideal for project managers, team leaders, and educators, it serves as a vital tool for explaining workflows and responsibilities. Compatible with PowerPoint, Keynote, and Google Slides, this template is perfect for enhancing presentations on project planning and execution.


6 slides
Customer Targeting Strategy Overview Presentation
Present your customer approach clearly with this Customer Targeting Strategy Overview presentation. Featuring a central persona with speech bubble-style segments, this layout is perfect for showcasing targeting methods, segmentation insights, or buyer personas. Ideal for marketers and strategists. Fully editable in Canva, PowerPoint, and Google Slides for easy customization.


10 slides
HR Management Presentation
The HR Management Presentation template is expertly designed to communicate crucial aspects of human resource management. It features a visually engaging layout that systematically breaks down important HR elements such as recruitment, training, employee engagement, and performance metrics. Each section is clearly labeled and accompanied by intuitive icons that aid in quick comprehension, making it an ideal choice for HR professionals aiming to present complex data in an accessible format. This template enhances audience engagement through its structured presentation of information, focusing on strategic management within HR. It is perfectly suited for showcasing HR strategies, policy updates, or organizational improvements in a clear and effective manner.