


Features
- 12 Unique slides
- Fully editable and easy to edit in Microsoft Powerpoint, Keynote and Google Slides
- 16:9 widescreen layout
- Clean and professional designs
- Export to JPG, PDF or send by email


Do you have any questions?
Recommend


20 slides
Radiance Sales Forecast Presentation
This vibrant sales presentation template is perfect for showcasing your strategy, objectives, and team. It highlights key areas like pricing, sales process, and performance metrics with a modern and eye-catching design. Compatible with PowerPoint, Keynote, and Google Slides, it ensures you’ll deliver impactful and professional presentations every time. Get ready to wow your audience!


8 slides
Lean Business Model Canvas Framework Presentation
Visualize your entire business strategy on a single slide with this Lean Business Model Canvas. Ideal for startups or strategic planning, each editable block represents a key area: value propositions, customer segments, revenue, and more. Streamlined and clear, it's perfect for team alignment or investor-ready business model pitches.


6 slides
Investment Portfolio Breakdown Presentation
Give your financial insights a clean, confident voice with a layout designed to make complex data feel simple and strategic. This presentation helps you compare allocations, highlight key performance areas, and communicate investment decisions with clarity and ease. Fully editable and compatible with PowerPoint, Keynote, and Google Slides.


20 slides
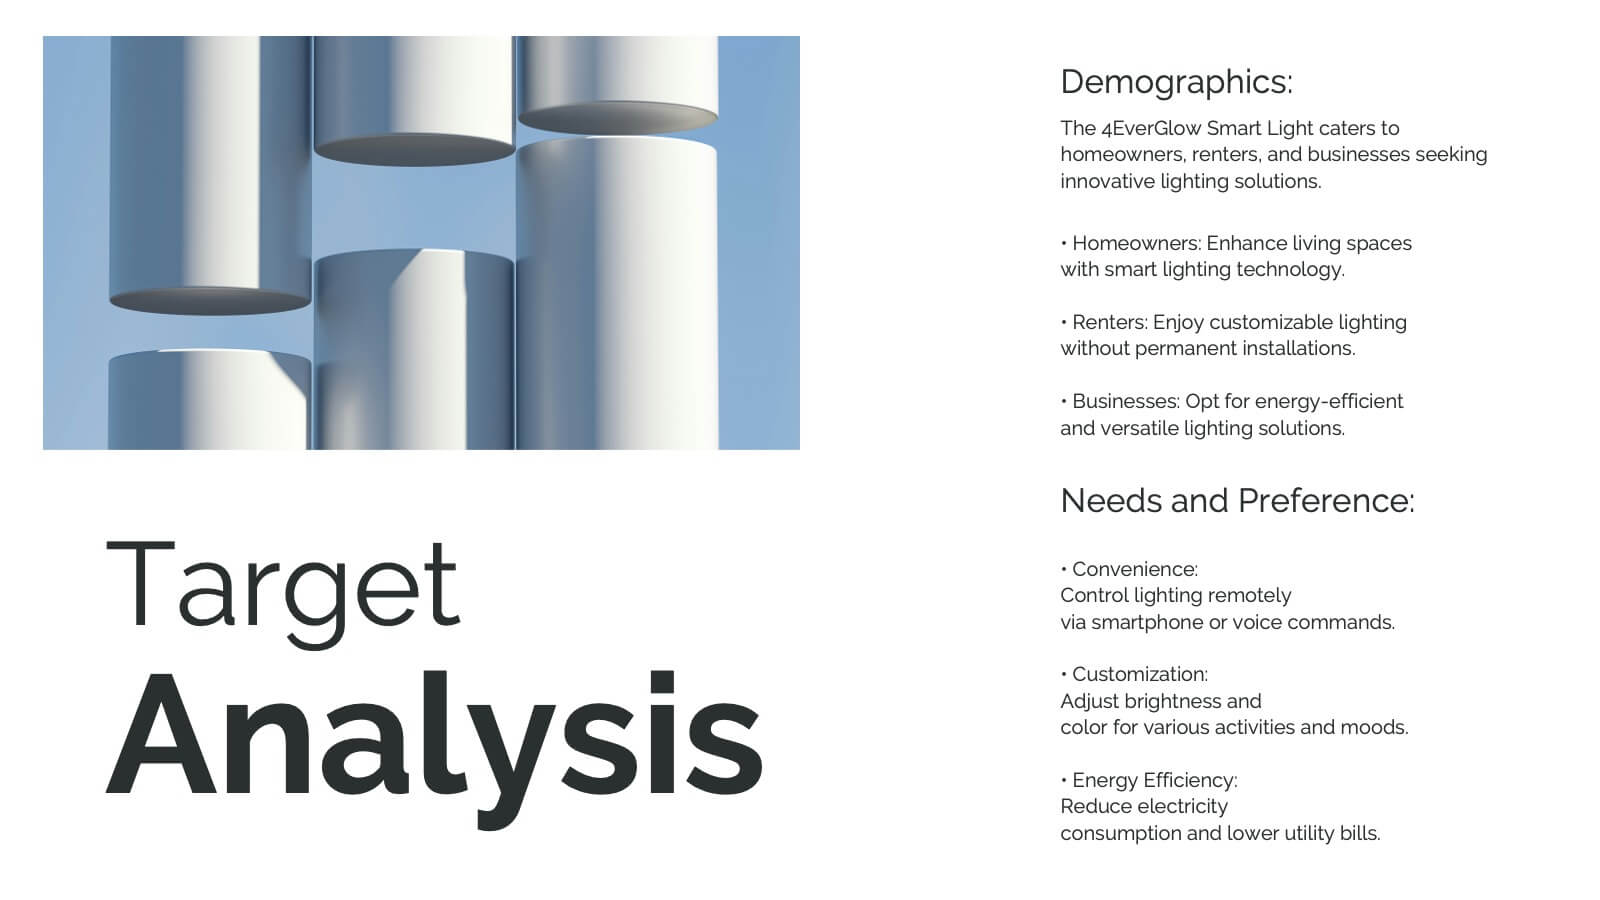
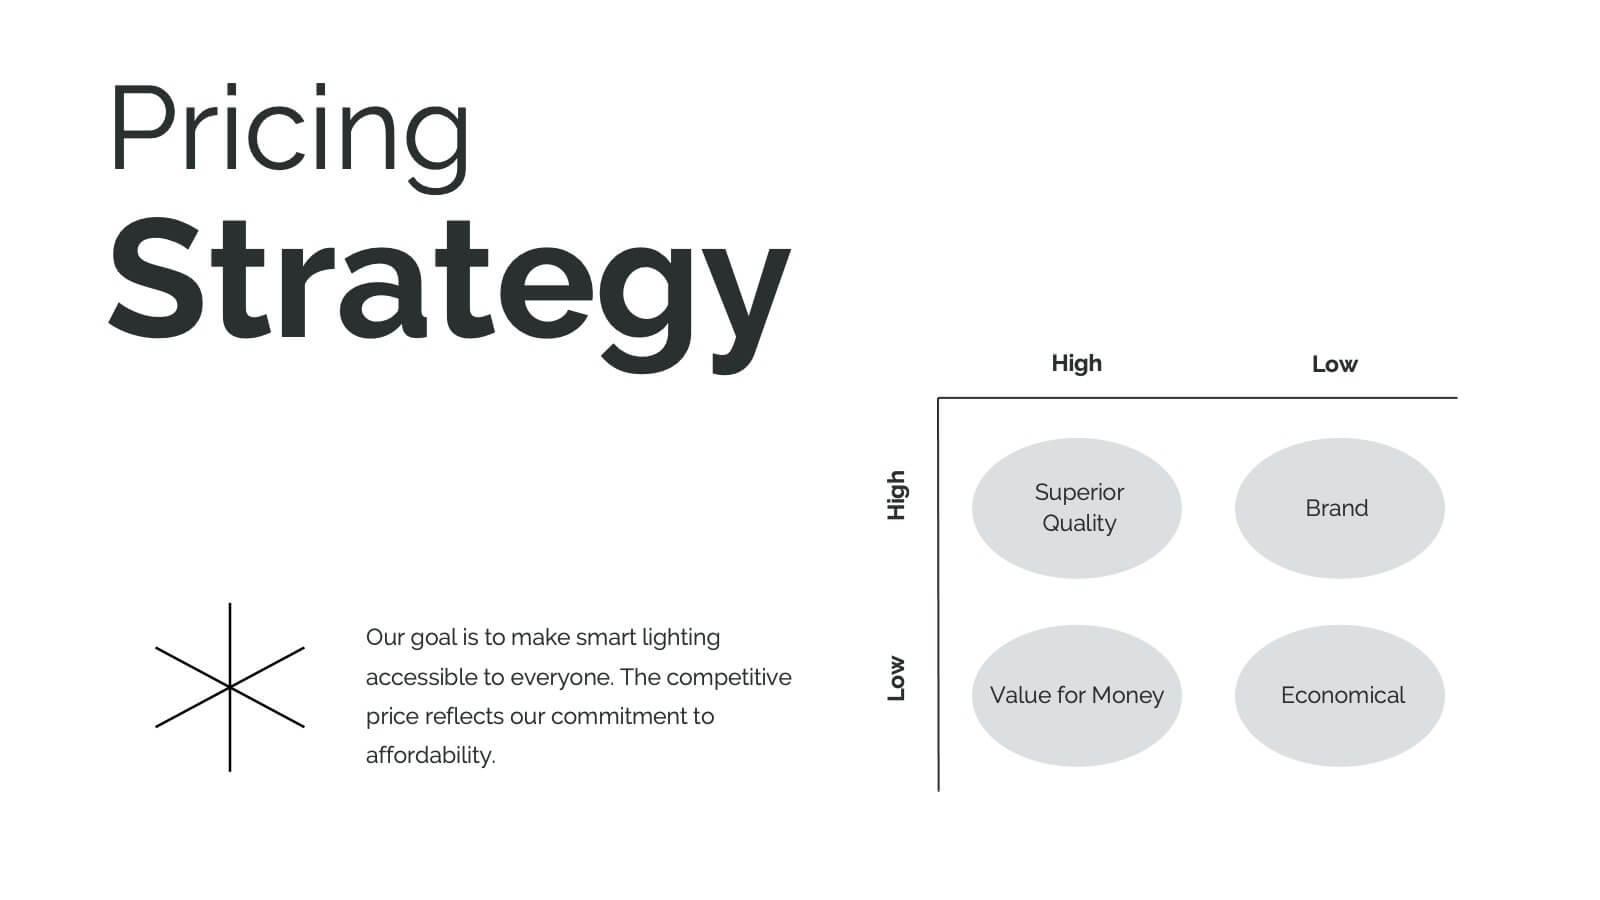
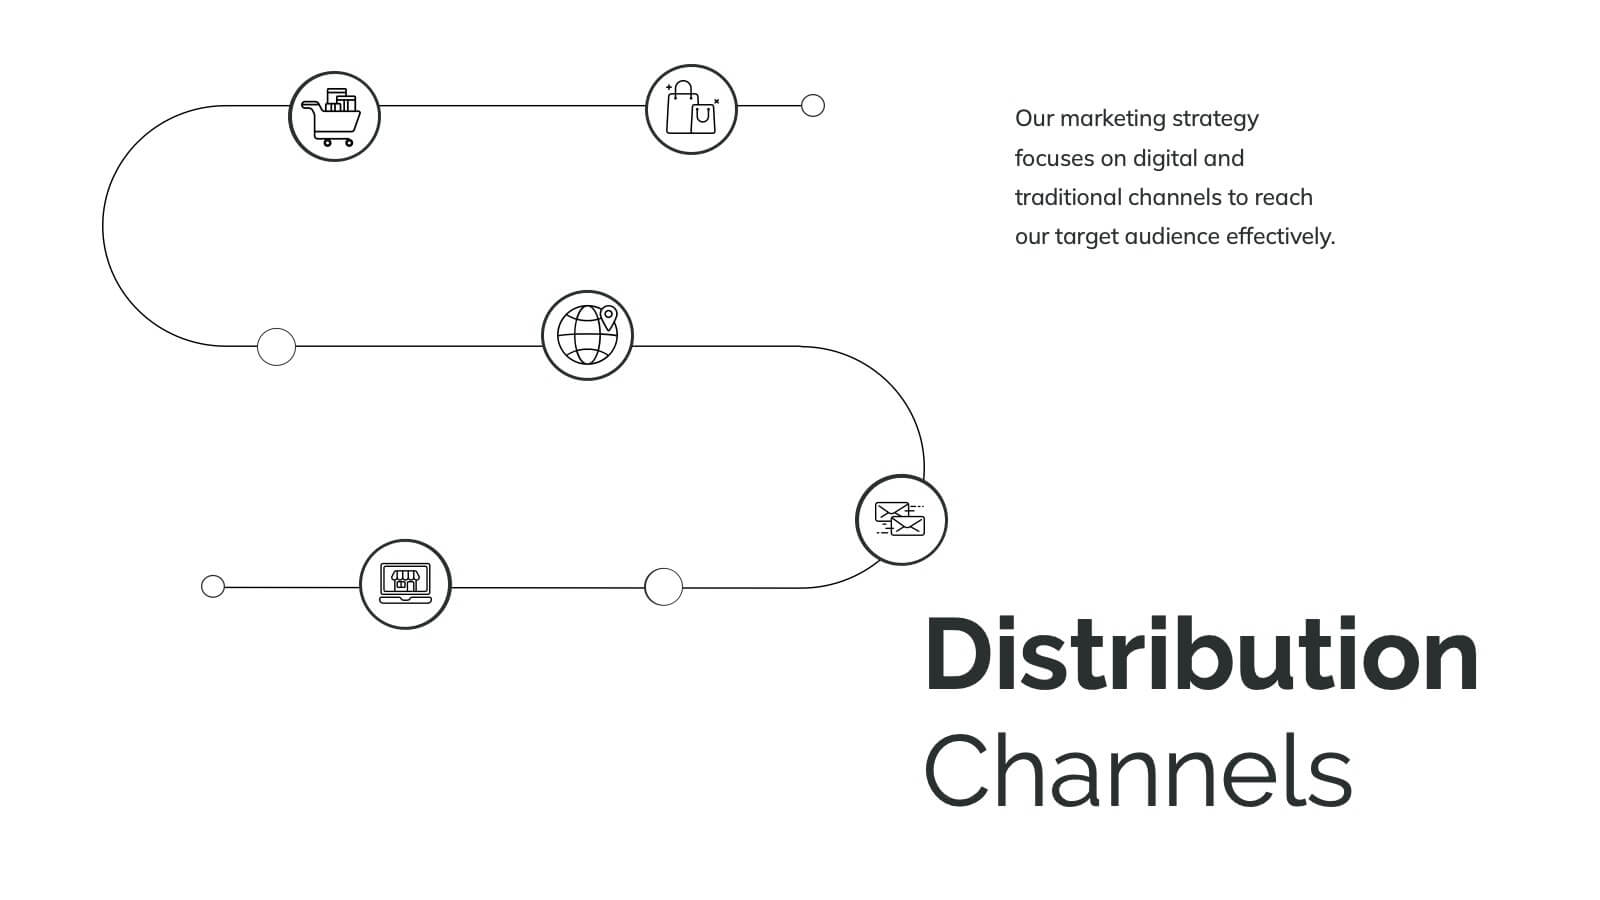
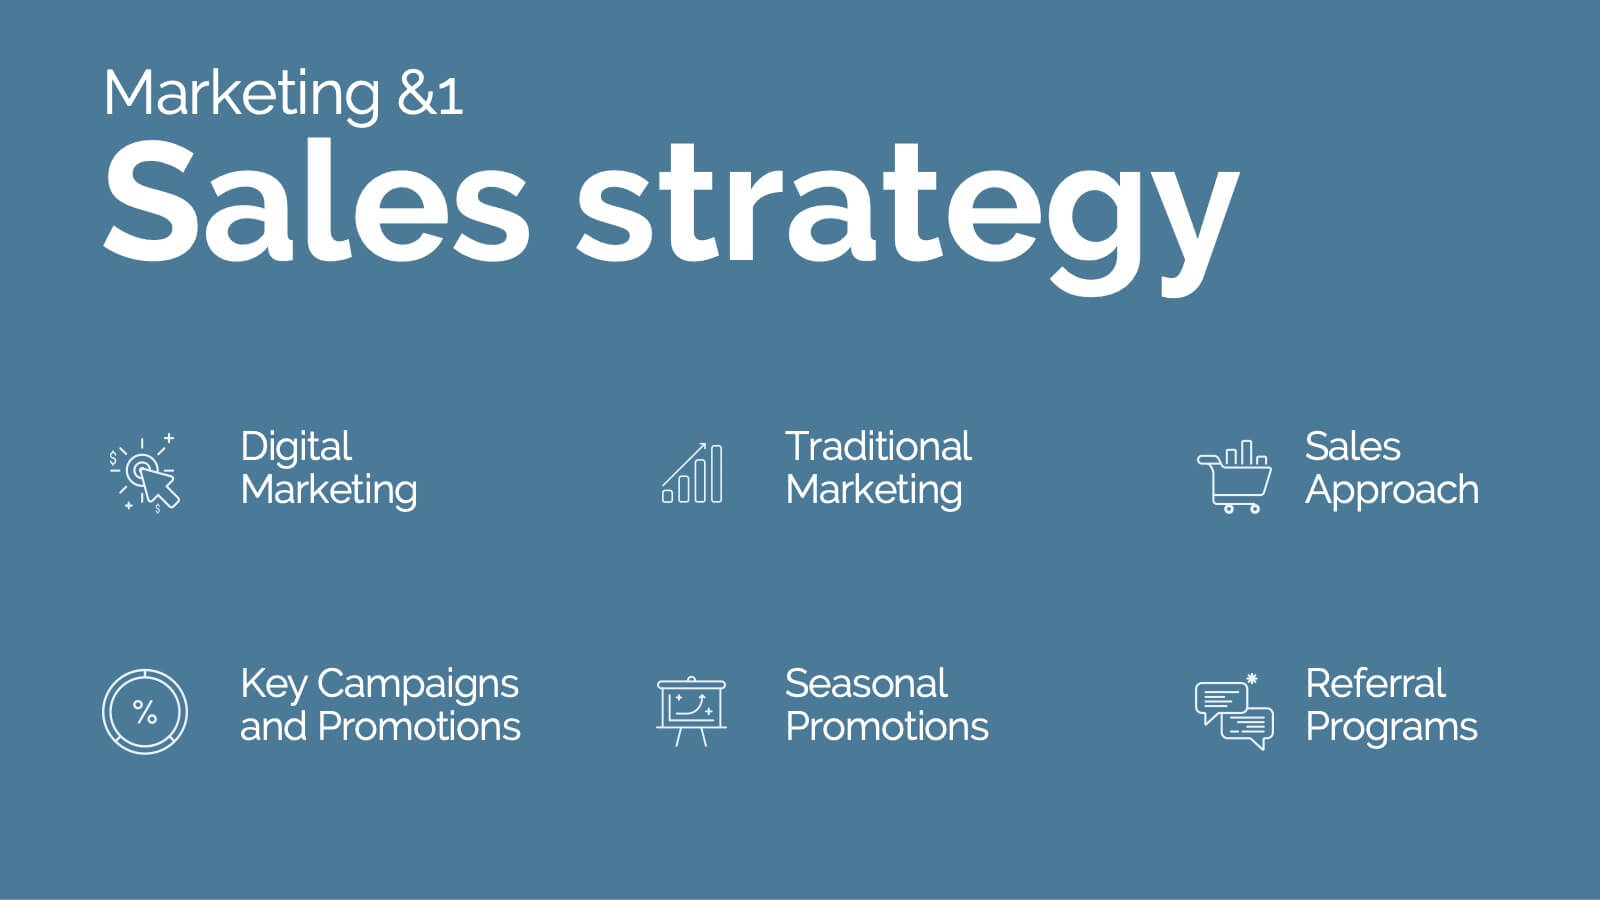
Hydra Product Launch Presentation
Unveiling your latest product has never been easier or more captivating! This comprehensive presentation template covers every aspect of your product's journey—from launch to competitive analysis. Engage your audience with detailed slides on features, target analysis, and pricing strategy. Seamlessly compatible with PowerPoint, Keynote, and Google Slides for maximum flexibility and impact.


6 slides
Business RAPID Model Diagram Presentation
Turn decision-making into a visual story with this bold, professional diagram that highlights each stage of responsibility and collaboration. Designed to simplify complex workflows, it’s perfect for outlining business strategies, performance reviews, or team structures. Fully compatible with PowerPoint, Keynote, and Google Slides for easy editing and presentation.


5 slides
Music Eras Infographics
Music history is often divided into distinct eras or periods based on the characteristics and predominant styles of music during specific time periods. These infographic templates are designed to present a chronological overview of significant musical periods, highlighting their characteristics, key composers, notable genres, and major developments. These templates serves as a comprehensive visual guide to help audiences understand the evolution of music throughout history. This template provides a captivating overview of the major music eras, allowing viewers to appreciate the distinct characteristics and contributions of each period.


5 slides
Infographic Business Charts Presentation
Bring your data to life with a bold, visual storytelling layout designed to make insights instantly clear and impossible to ignore. This presentation highlights key metrics using clean, modern business charts that simplify comparisons and trends for any audience. Fully compatible with PowerPoint, Keynote, and Google Slides.


4 slides
Team Collaboration Strategy
Illustrate cross-functional teamwork with this visually engaging slide. Featuring color-coded team clusters, it's perfect for showcasing group dynamics, collaborative workflows, or project responsibilities. Use this diagram to break down organizational units, collaboration models, or department contributions. Fully editable in PowerPoint, Keynote, and Google Slides.


8 slides
Social Media Engagement Metrics
Track engagement with clarity using the Social Media Engagement Metrics Presentation. This layout features a smartphone mockup at the center, with four vertically stacked icons representing key engagement indicators. Surrounding the device, space is allocated for concise data insights or definitions labeled A through D. Perfect for presenting analytics like likes, shares, comments, and reach. Fully editable in PowerPoint, Keynote, and Google Slides.


7 slides
Student Progress Infographic Presentation
Progress infographics are visual representations that show progress or improvement over time, often with the use of charts, graphs, and other visual elements. Visualize your progress with this infographic template that includes tips, illustrations and a variety of charts. Use this progress template to create a visual story of your goals and accomplishments in an engaging style. This includes helpful illustrations, colors and allows you to add your text, notes and other valuable information. This template was designed for progress, but can be used for presentations on various topics.


6 slides
Product Introduction Infographic
Showcase your new products with our series of slide templates designed for impactful product introductions. Each template is crafted to highlight the unique features and benefits of your products, making them ideal for launch presentations, marketing meetings, and stakeholder briefings. Featuring a clean and modern design, these slides are structured to guide the audience through a compelling narrative about your product, from its conception to its market entry. The use of vivid imagery, alongside detailed text descriptions, ensures that each aspect of the product is clearly communicated and visually engaging. Customizable to suit your specific needs, these templates can be adapted to feature your product’s specifications, advantages, and potential impact. They serve as a crucial tool for organizations looking to generate excitement and support for new offerings, providing a professional and persuasive presentation format.


4 slides
Top Priorities and Checklist Format Presentation
Stay focused and aligned with the Top Priorities and Checklist Format Presentation. This clear, checklist-based design is ideal for highlighting action items, goals, or key project deliverables. Visually guide your team with structured sections and a checklist illustration that reinforces accountability. Fully editable in PowerPoint, Keynote, and Google Slides.


5 slides
Industry Competition Assessment with Porter’s Forces Presentation
Present your competitive landscape with this Porter’s Five Forces slide. Designed for strategic analysis, it visually maps key industry forces—New Entrants, Supplier Power, Buyer Power, Substitutes, and Competitive Rivalry—around a central business icon. Fully customizable and ideal for PowerPoint, Keynote, or Google Slides to elevate professional presentations.


26 slides
Wave Brand Identity Presentation
Take your brand's identity to the next level with the Wave Brand Identity Presentation template! Designed to capture the essence of your brand in a visually striking and comprehensive format, this template is perfect for showcasing your brand's vision, values, and personality. It includes sections for brand vision and mission, core values, target audience, and brand positioning, ensuring that every aspect of your brand identity is clearly communicated. The sleek design elements and modern layout make it easy to present your brand's unique selling proposition (USP) and key differentiators, helping you to build a strong, cohesive brand story. Ideal for brand strategists, marketing teams, and creative professionals, this template is fully customizable and works seamlessly with PowerPoint, Keynote, and Google Slides. Bring your brand's story to life and leave a lasting impression with the Wave Brand Identity template!


26 slides
Quantum Computing Presentation
Step into the future of technology with this fascinating presentation on quantum computing. Covering key concepts like quantum bits, superposition, entanglement, and real-world applications, this template helps simplify complex ideas for any audience. Fully customizable and compatible with PowerPoint, Keynote, and Google Slides for a seamless and insightful presentation experience.


4 slides
Business Challenge Overview Presentation
Kick off your message with a dynamic overview that makes complex challenges feel clear, visual, and manageable. This presentation helps you break down obstacles, compare factors, and guide teams toward smarter decisions with an organized, flowing layout. Fully compatible with PowerPoint, Keynote, and Google Slides.


7 slides
Security Service Infographic Presentation
Security is the practice of protecting people, information, and assets from harm or damage. It is essential for compliance, business continuity, and protecting an organization's reputation. This template is designed to help you showcase or discuss security services, products or any other topic related to this. This template contains security graphics, and you can easily add your logo or icon to make the template more fun and eye catchy. This template allows you to customize the slides with any color scheme that suits your brand and communicate important features of your business.