


Features
- 6 Unique slides
- Fully editable and easy to edit in Microsoft Powerpoint, Keynote and Google Slides
- 16:9 widescreen layout
- Clean and professional designs
- Export to JPG, PDF or send by email


Do you have any questions?
Recommend


4 slides
Mind Mapping for Idea Expansion Presentation
Visualize your concepts clearly with this Mind Mapping for Idea Expansion presentation. Designed to help structure brainstorming sessions or strategic planning, this template organizes ideas around a central theme with clean, radial layouts. Ideal for creative teams and professionals. Fully editable in Canva, PowerPoint, and Google Slides.


7 slides
Social Media Engagement Infographic
Social media is the most influential tool in today's world. This infographic template is a great way to share the benefits of your services in an easy-to-read format that's sure to get your audience excited about what you have to offer. Whether you're looking to promote a new product line or simply want to provide information to your customers so they can make informed decisions, this infographic will be perfect for your needs. This infographic will help you understand how to use social media to engage with your audience and drive traffic to your site. Fully customizable and compatible with Powerpoint, Keynote, and Google Slides.


7 slides
Security Service Infographic Presentation
Security is the practice of protecting people, information, and assets from harm or damage. It is essential for compliance, business continuity, and protecting an organization's reputation. This template is designed to help you showcase or discuss security services, products or any other topic related to this. This template contains security graphics, and you can easily add your logo or icon to make the template more fun and eye catchy. This template allows you to customize the slides with any color scheme that suits your brand and communicate important features of your business.


23 slides
Maverick Business Plan Presentation
Navigate your business journey with ease using this comprehensive business plan presentation template. Structured to guide you through each critical aspect of your business, from market analysis and operational strategies to financial projections and employee management, this template provides a solid foundation for conveying your business objectives and plans. Ideal for startups and established enterprises alike, it's designed to facilitate discussions on company direction and strategic decisions. Compatible with PowerPoint, Google Slides, and Keynote, this template is accessible across devices, ensuring you can pitch or plan wherever you are.


7 slides
Female Anatomy Infographic
Anatomy is the branch of biology that focuses on the structure and organization of living things. Step into a world of discovery with our infographic template, this is an enlightening visual guide that celebrates the intricate beauty and functionality of the female body. This infographic is designed to educate and empower, offering a clear and artistic representation of the anatomy that defines women. This template will take your audience through an educational journey through the various systems that make up a woman's body. This is fully customizable and compatible with Powerpoint, Keynote, and Google Slides.


7 slides
Growth Mindset Infographic Presentation
A Growth Infographic is a visual representation of data that displays the growth of a particular business, industry, or market over time. It can be used to illustrate growth in areas such as revenue, profits, customer base, or market share. This growth template includes a timeline and graphs that shows the change in data over time, presented in a visually appealing way using icons, symbols, and color-coding. Use this infographic to include additional information such as industry trends, key drivers of growth, and future projections. Easily edit in Powerpoint, Keynote, and Google Slides.


6 slides
Gantt Charts Analysis Infographic
Streamline your project planning with our Gantt Chart Analysis Infographic, designed for seamless integration with Powerpoint, Google Slides, and Keynote. The Gantt chart layout allows you to display activities against a time scale, making it easy to identify key phases, task durations, and overlapping activities. Each bar represents a task, with colors and lengths that can be customized to reflect different stages or priorities. Perfect for detailing project timelines, and workflow coordination, this template is a visual aid that enhances clarity and fosters collaborative project management. With this Gantt Chart infographic, you can ensure your project stays on track.


3 slides
Market Size and Scaling Insights Presentation
Understand your market potential with the Market Size and Scaling Insights Diagram. This visually engaging template helps you analyze market segments, growth trends, and scaling opportunities with clarity. Ideal for business strategists, analysts, and investors, this slide ensures a concise and professional presentation of key market data. Fully customizable and compatible with PowerPoint, Keynote, and Google Slides.


7 slides
SWOT Analysis Marketing Infographic Presentation
SWOT Analysis is a simple, but powerful strategic planning method. It helps identify your company’s strengths, weaknesses, opportunities and threats as you plan a course for the future. This template includes everything you need for your next project, including data and insight about your business. This template comes with 7 slides. It includes a title for each infographic and allows you to build your swot charts, add icons and convert the text into bullet points. You have complete control over all elements within each slide and can easily add, delete or modify content at any time!


4 slides
Veterinary Medicine and Animal Health Presentation
Bring animal healthcare insights to life with this playful and professional slide, featuring an illustrated dog and four food bowls to represent key veterinary topics. Ideal for clinics, pet wellness brands, or animal science presentations. Fully editable in PowerPoint, Keynote, or Google Slides.


3 slides
Search Engine Optimization Strategy Presentation
Stand out in your next presentation with this dynamic visual breakdown of digital visibility tactics. Perfect for marketers, business owners, or SEO specialists, this colorful circular infographic highlights the key pillars of a search strategy in a way that's both professional and easy to follow. Compatible with PowerPoint, Keynote, and Google Slides.


20 slides
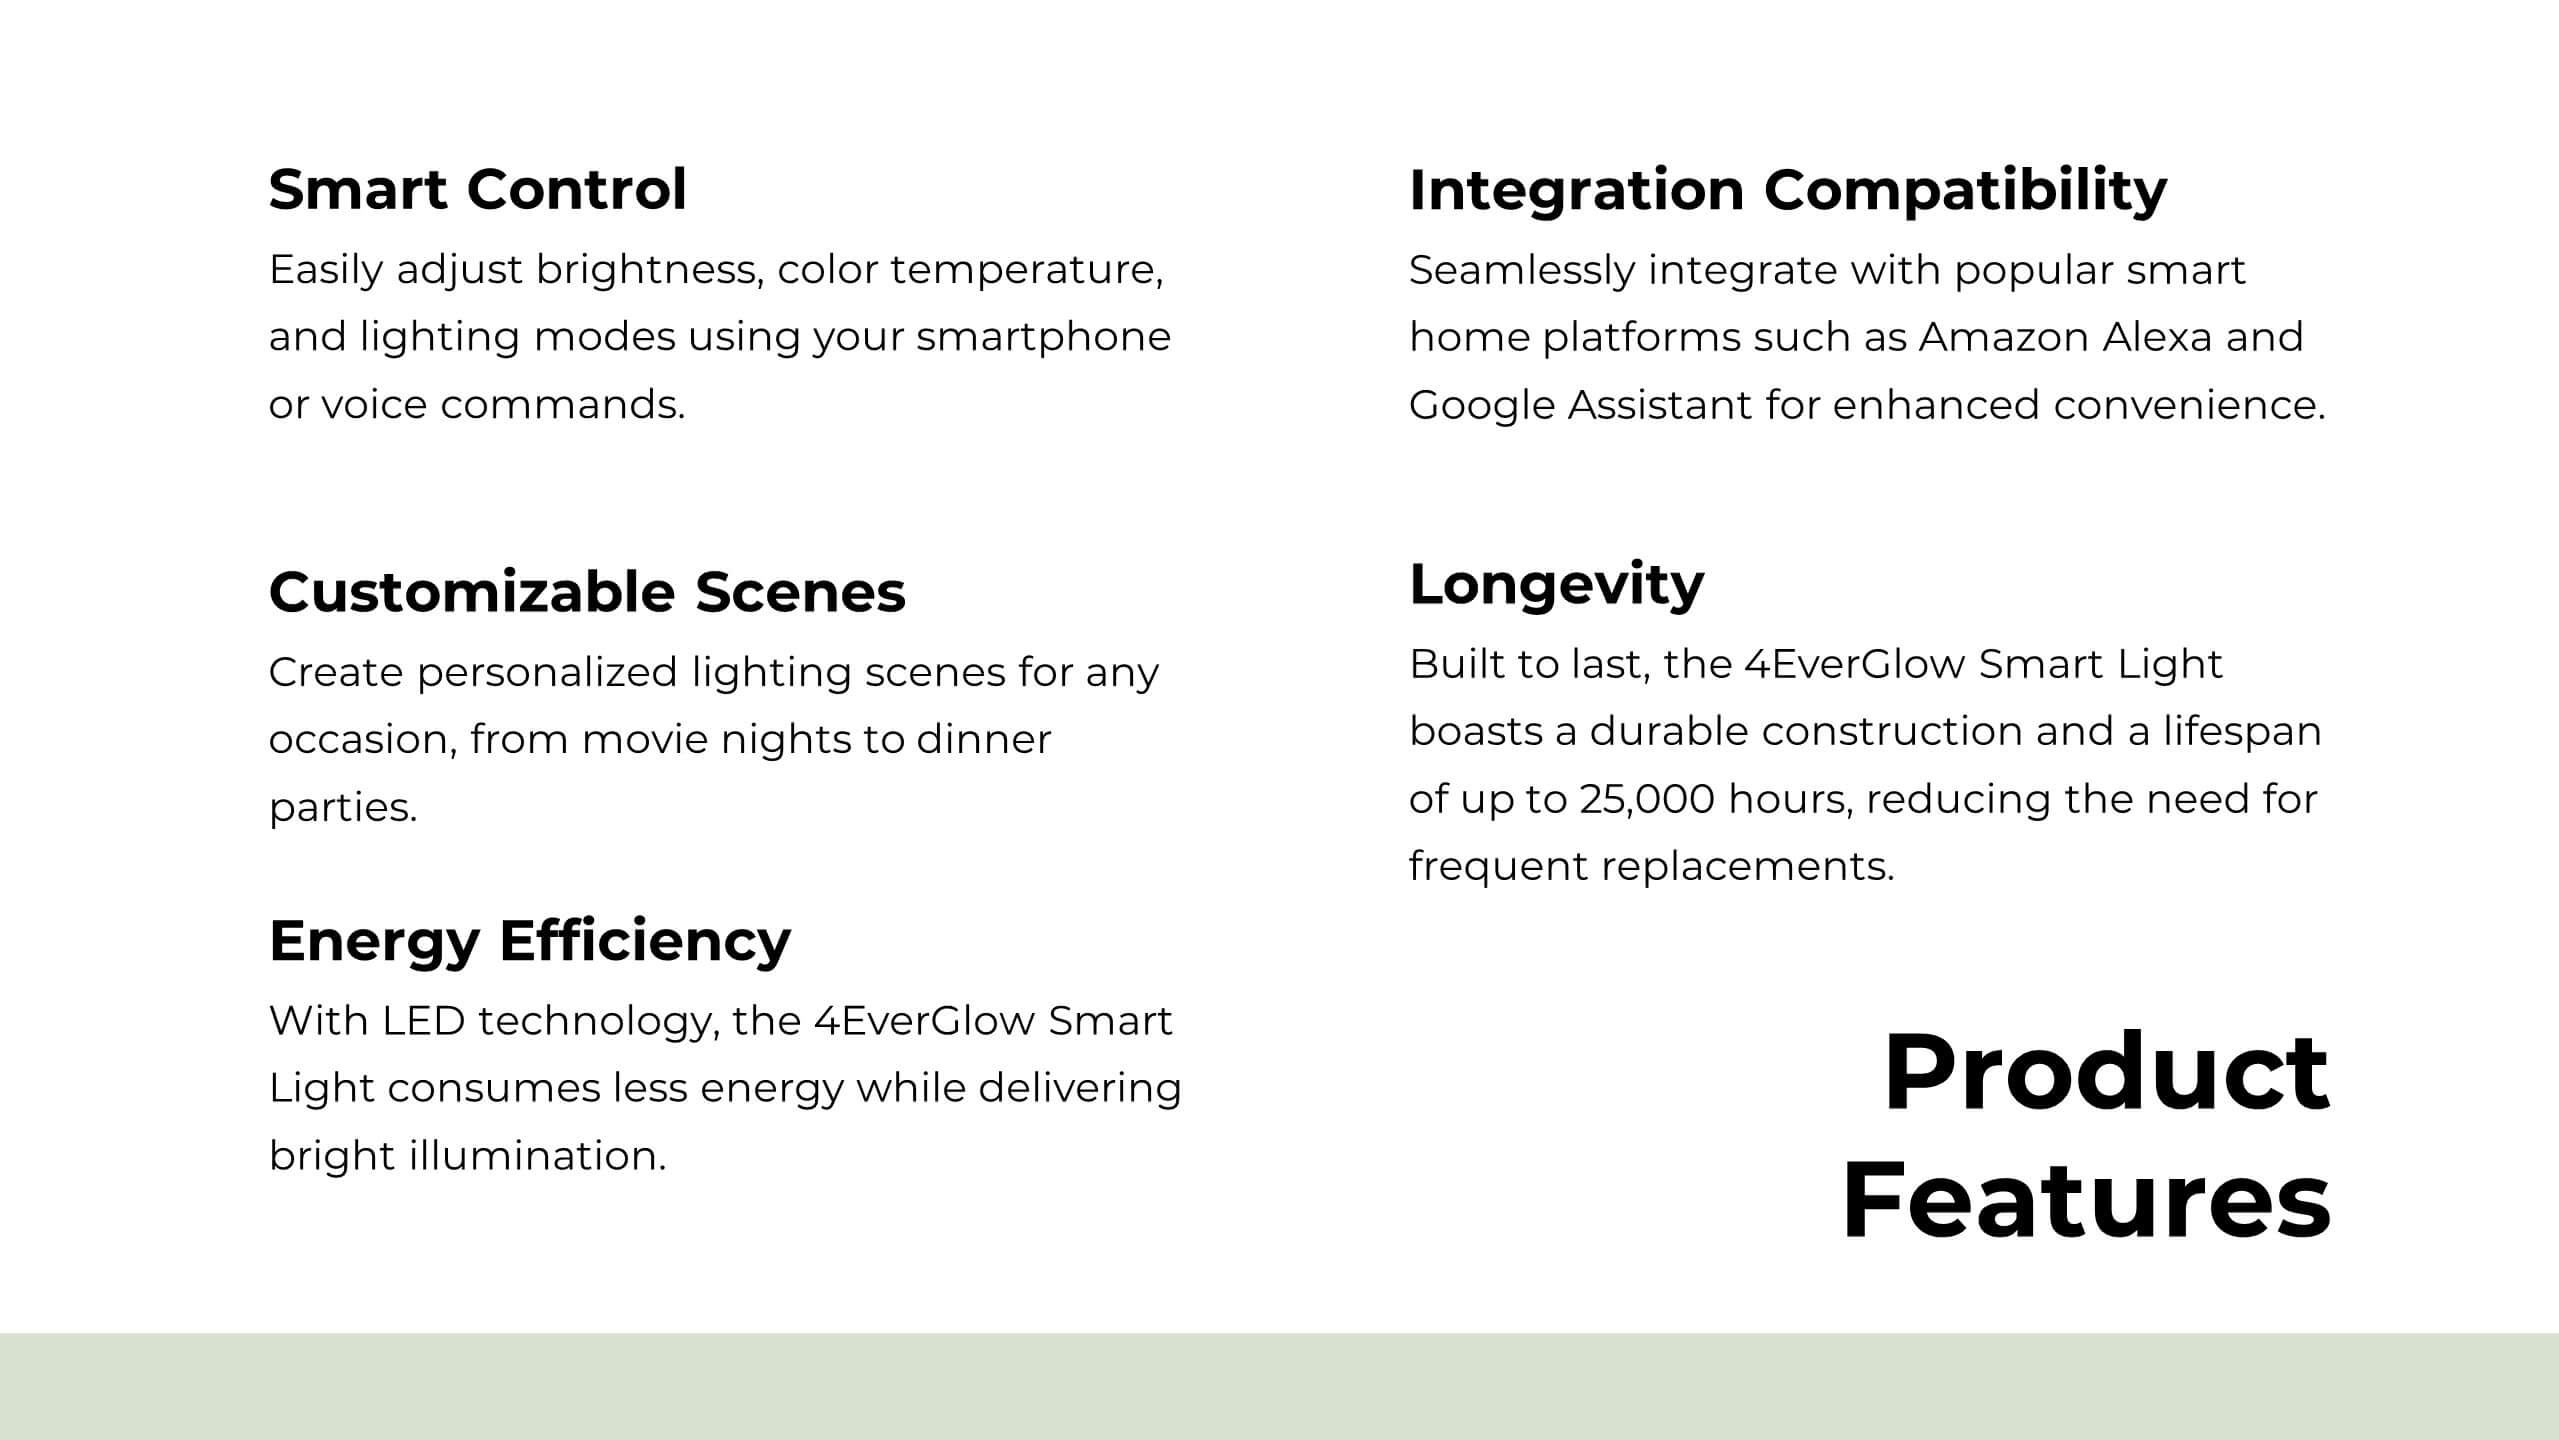
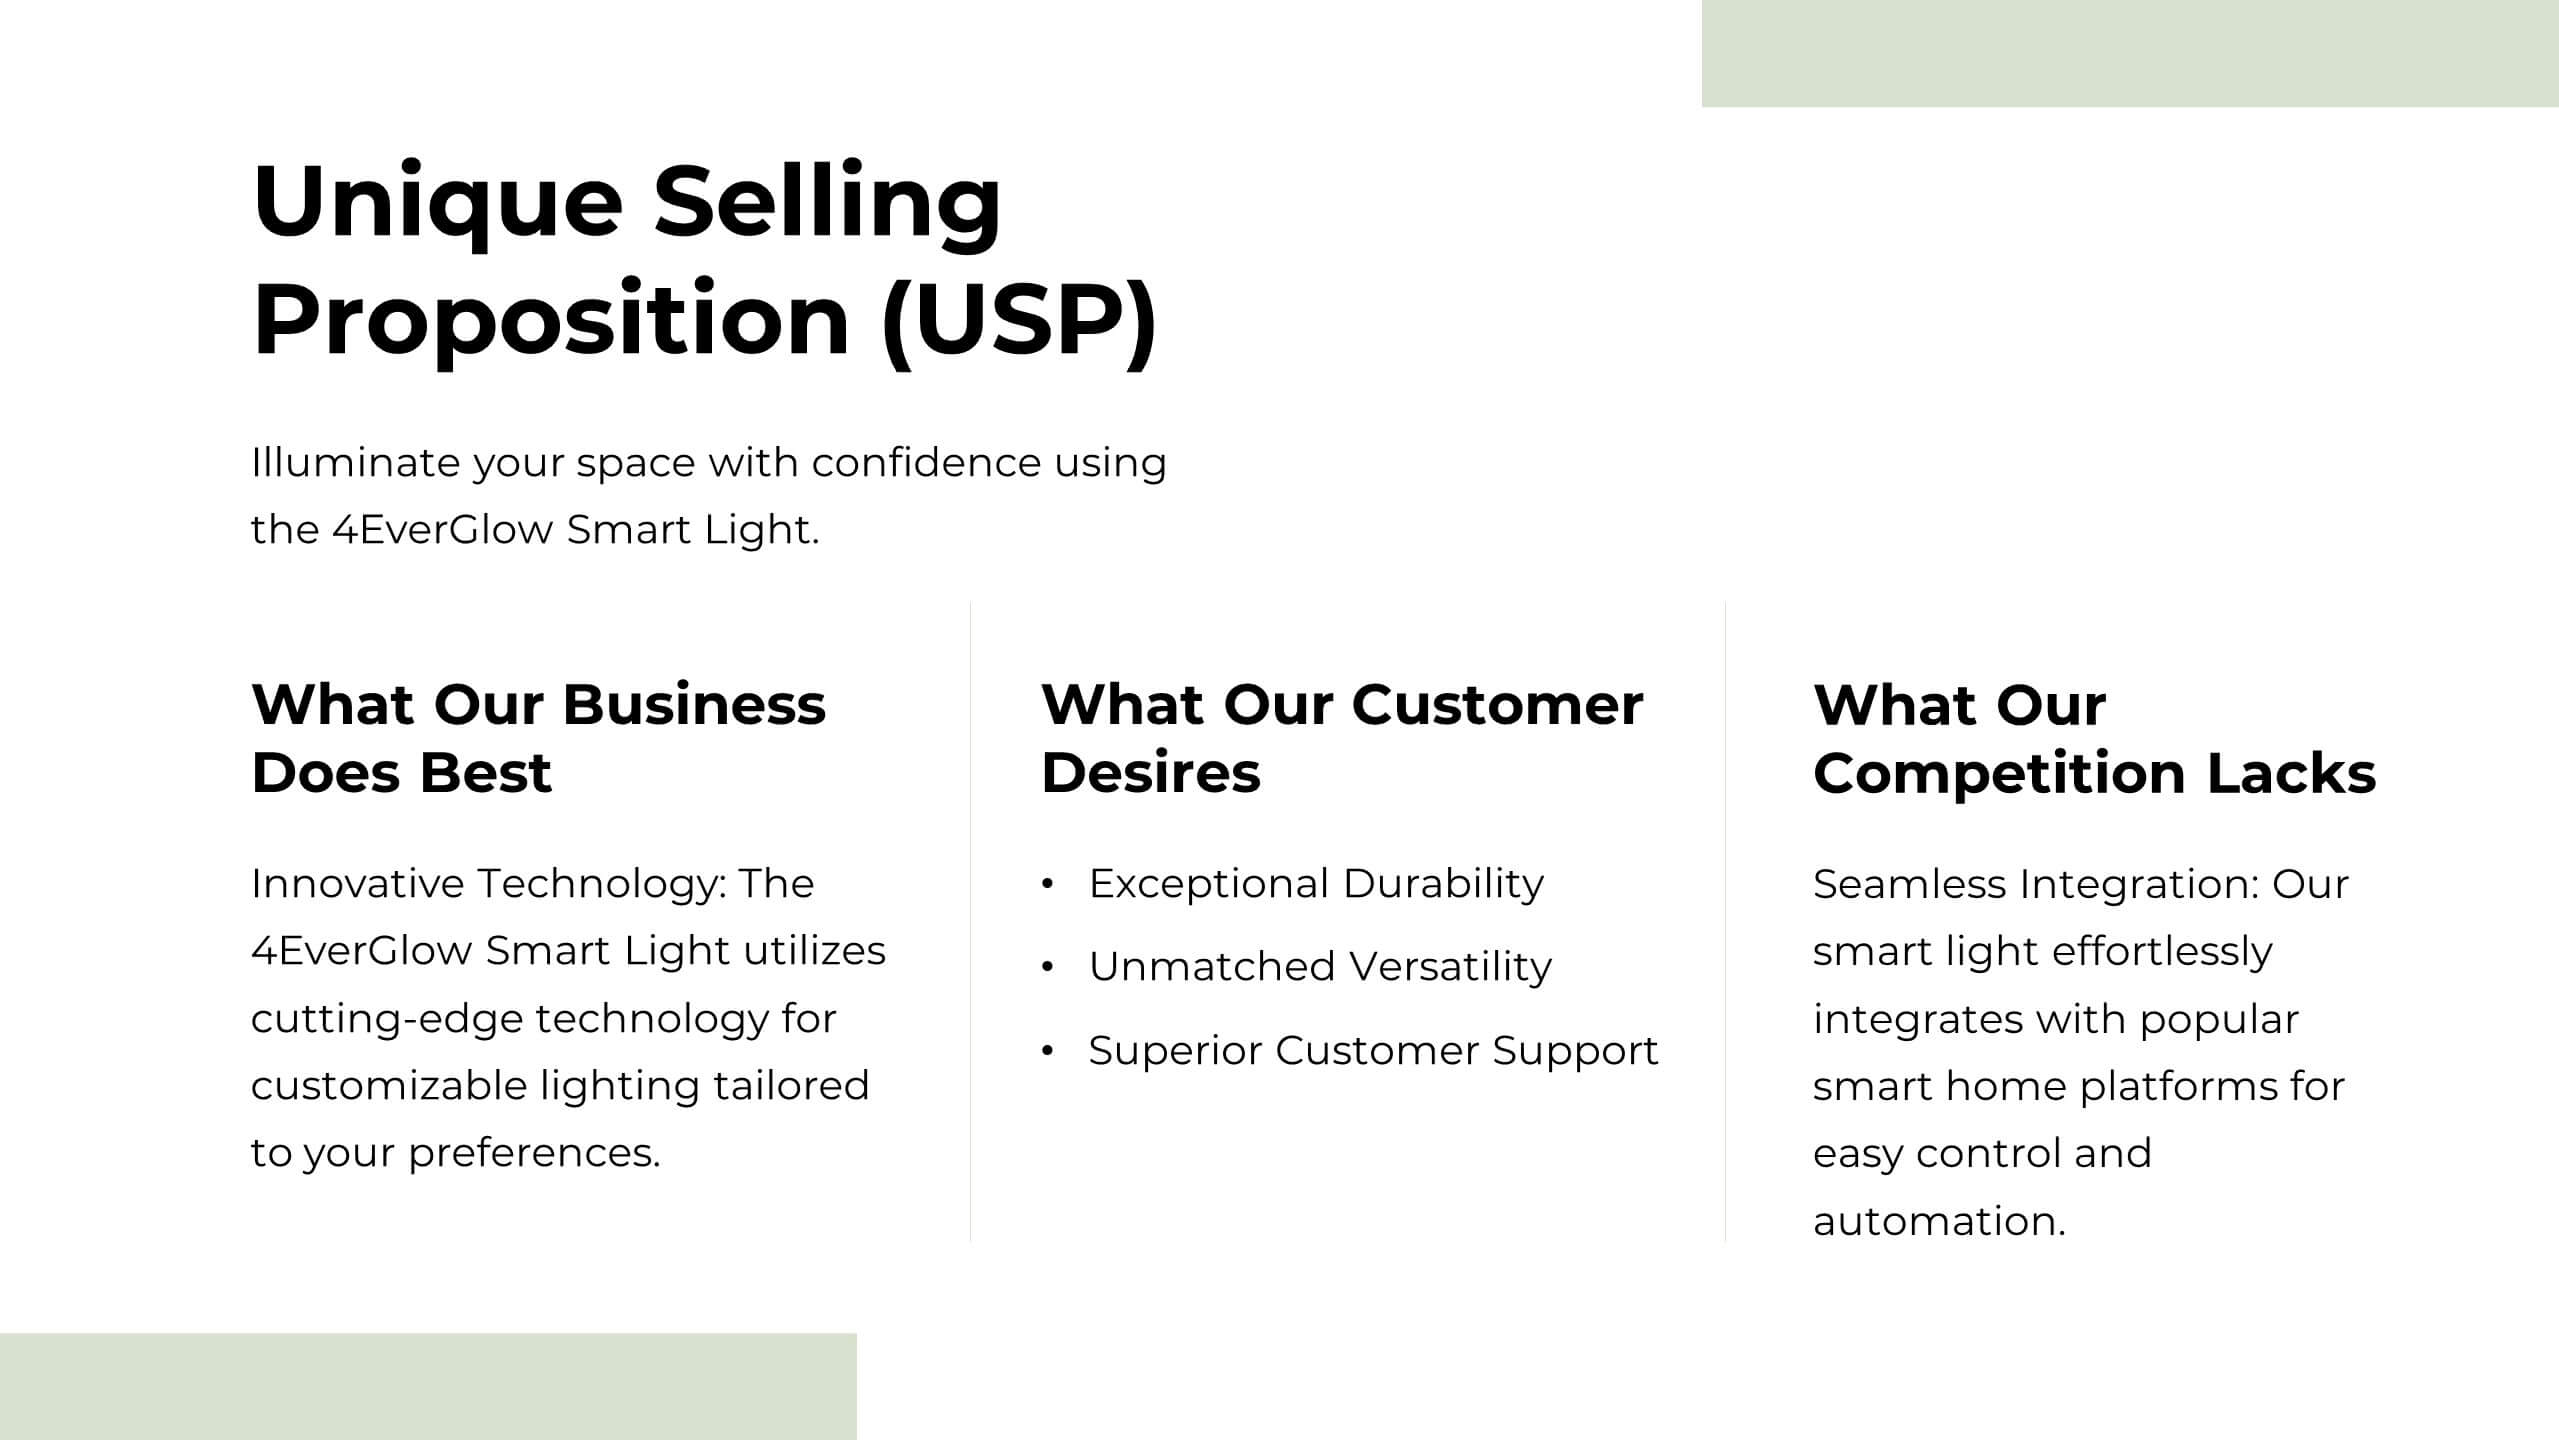
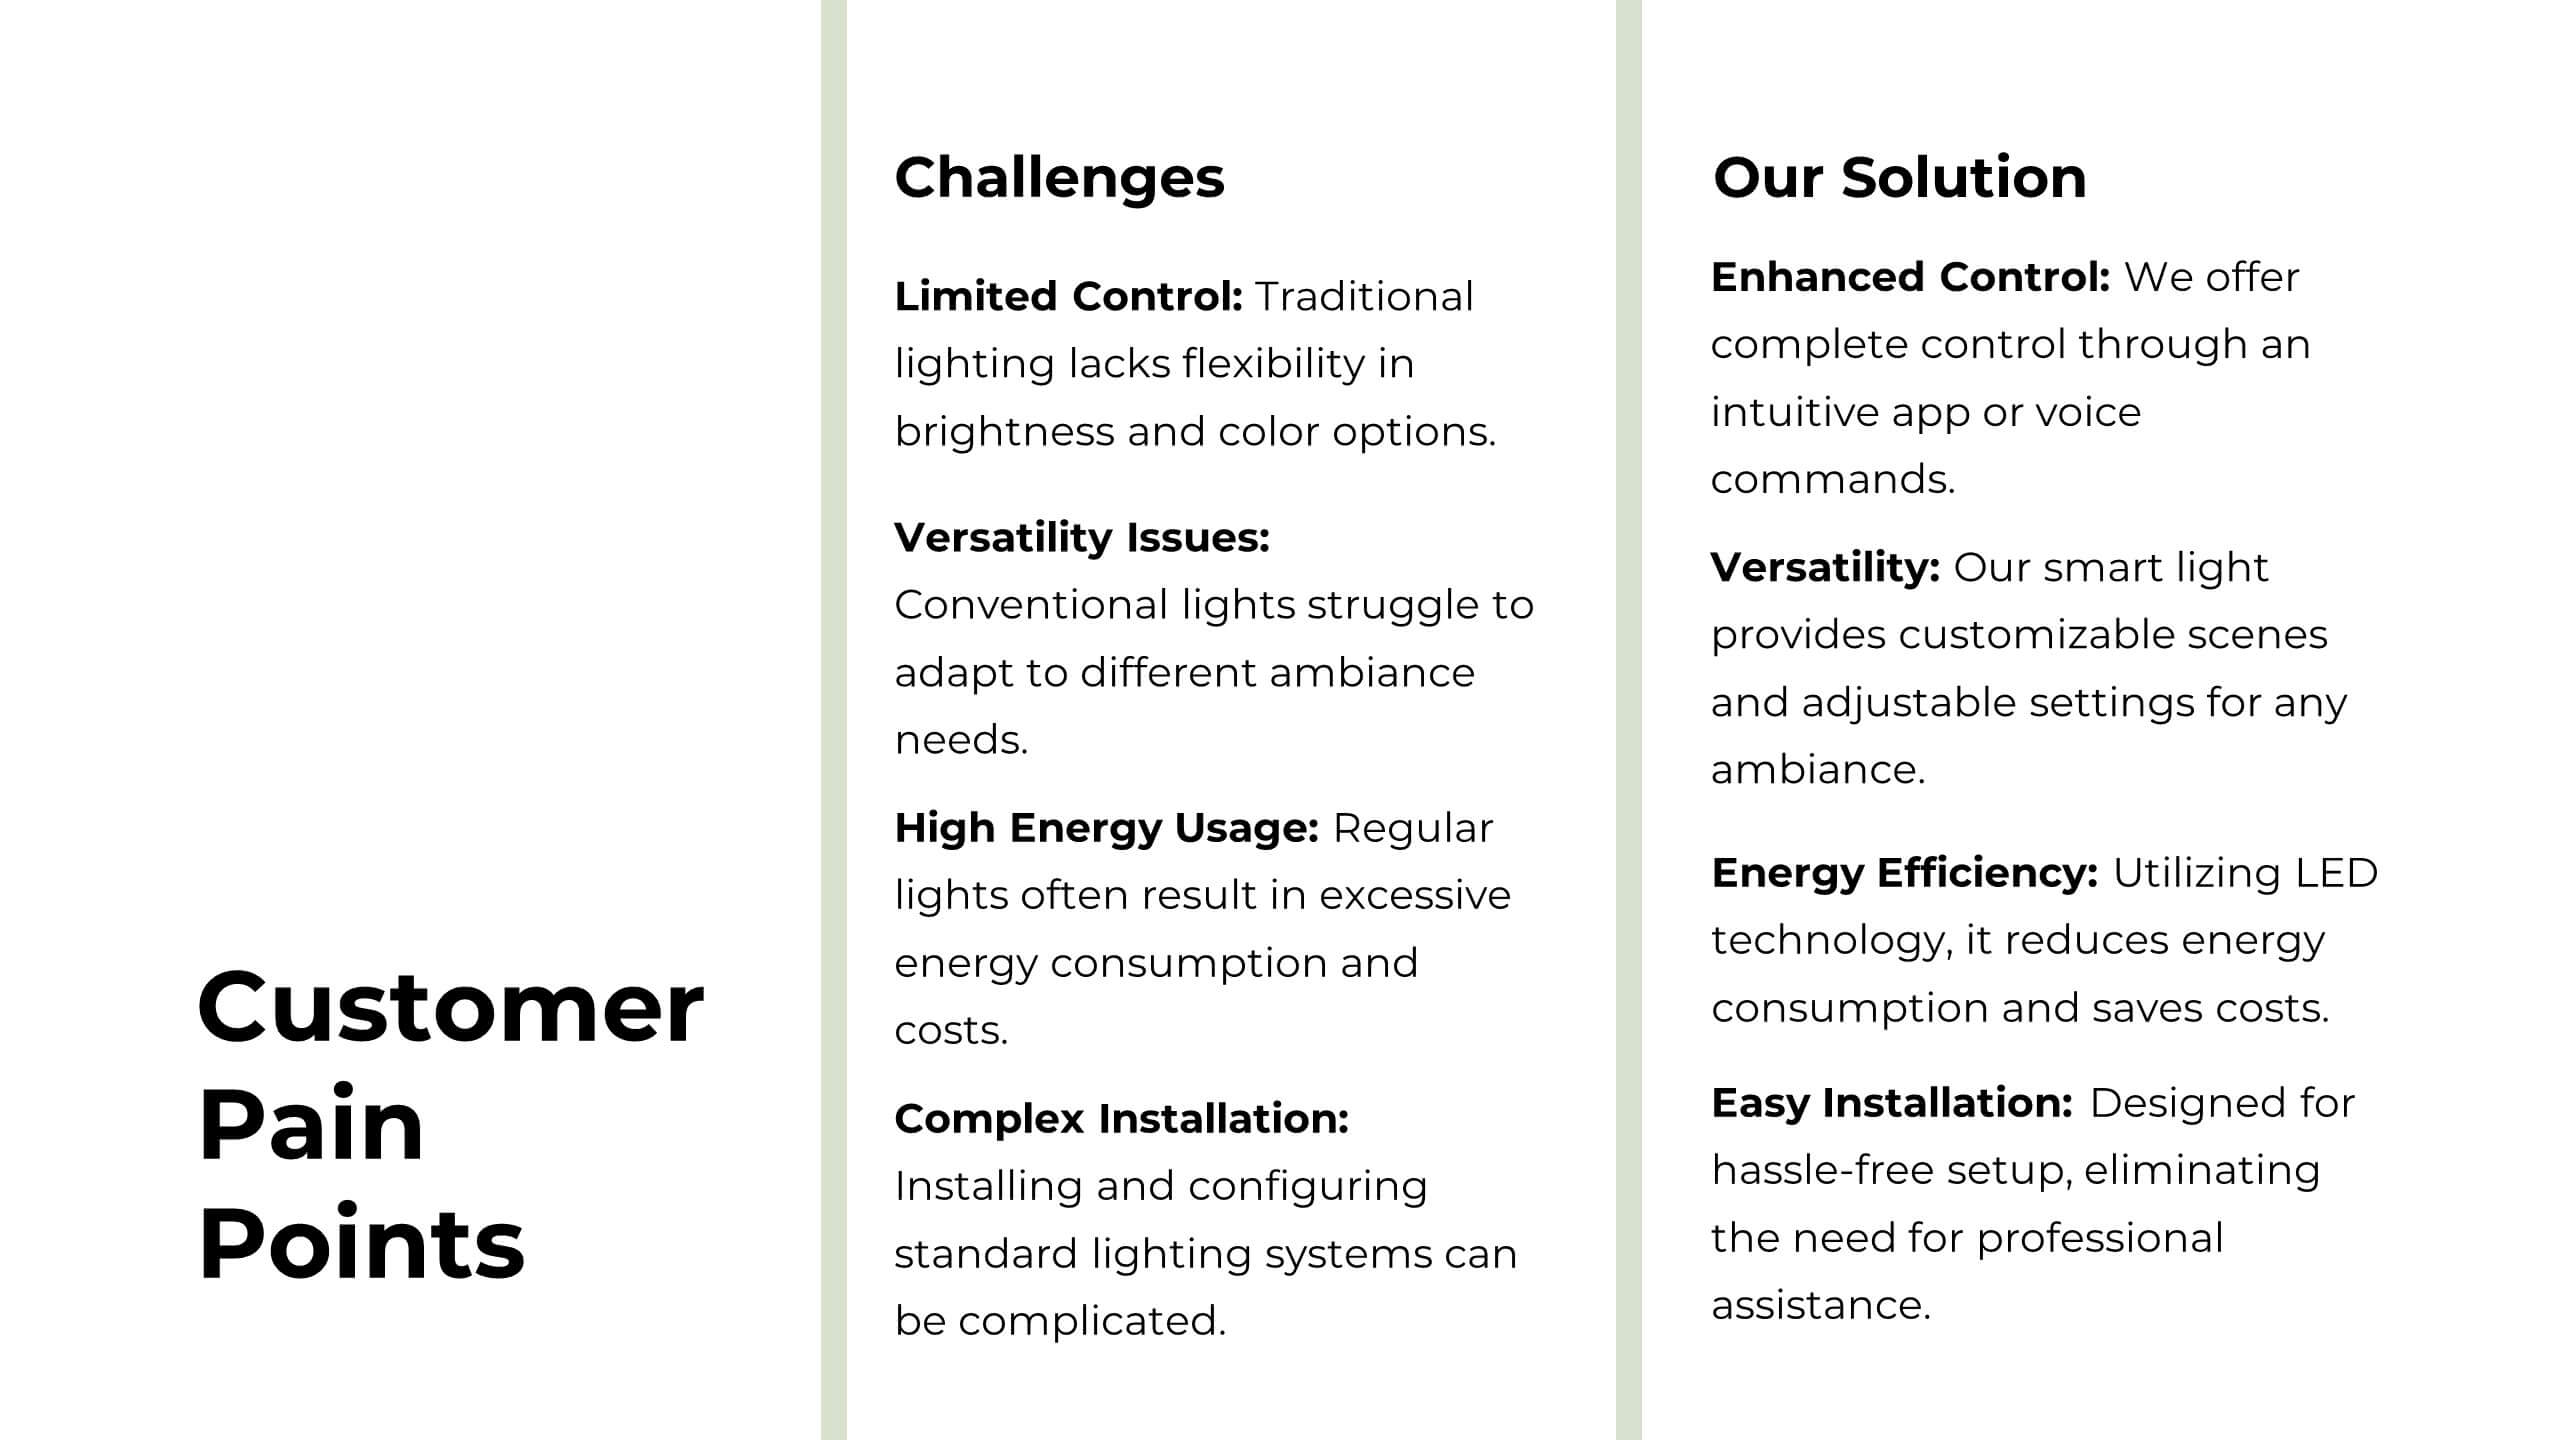
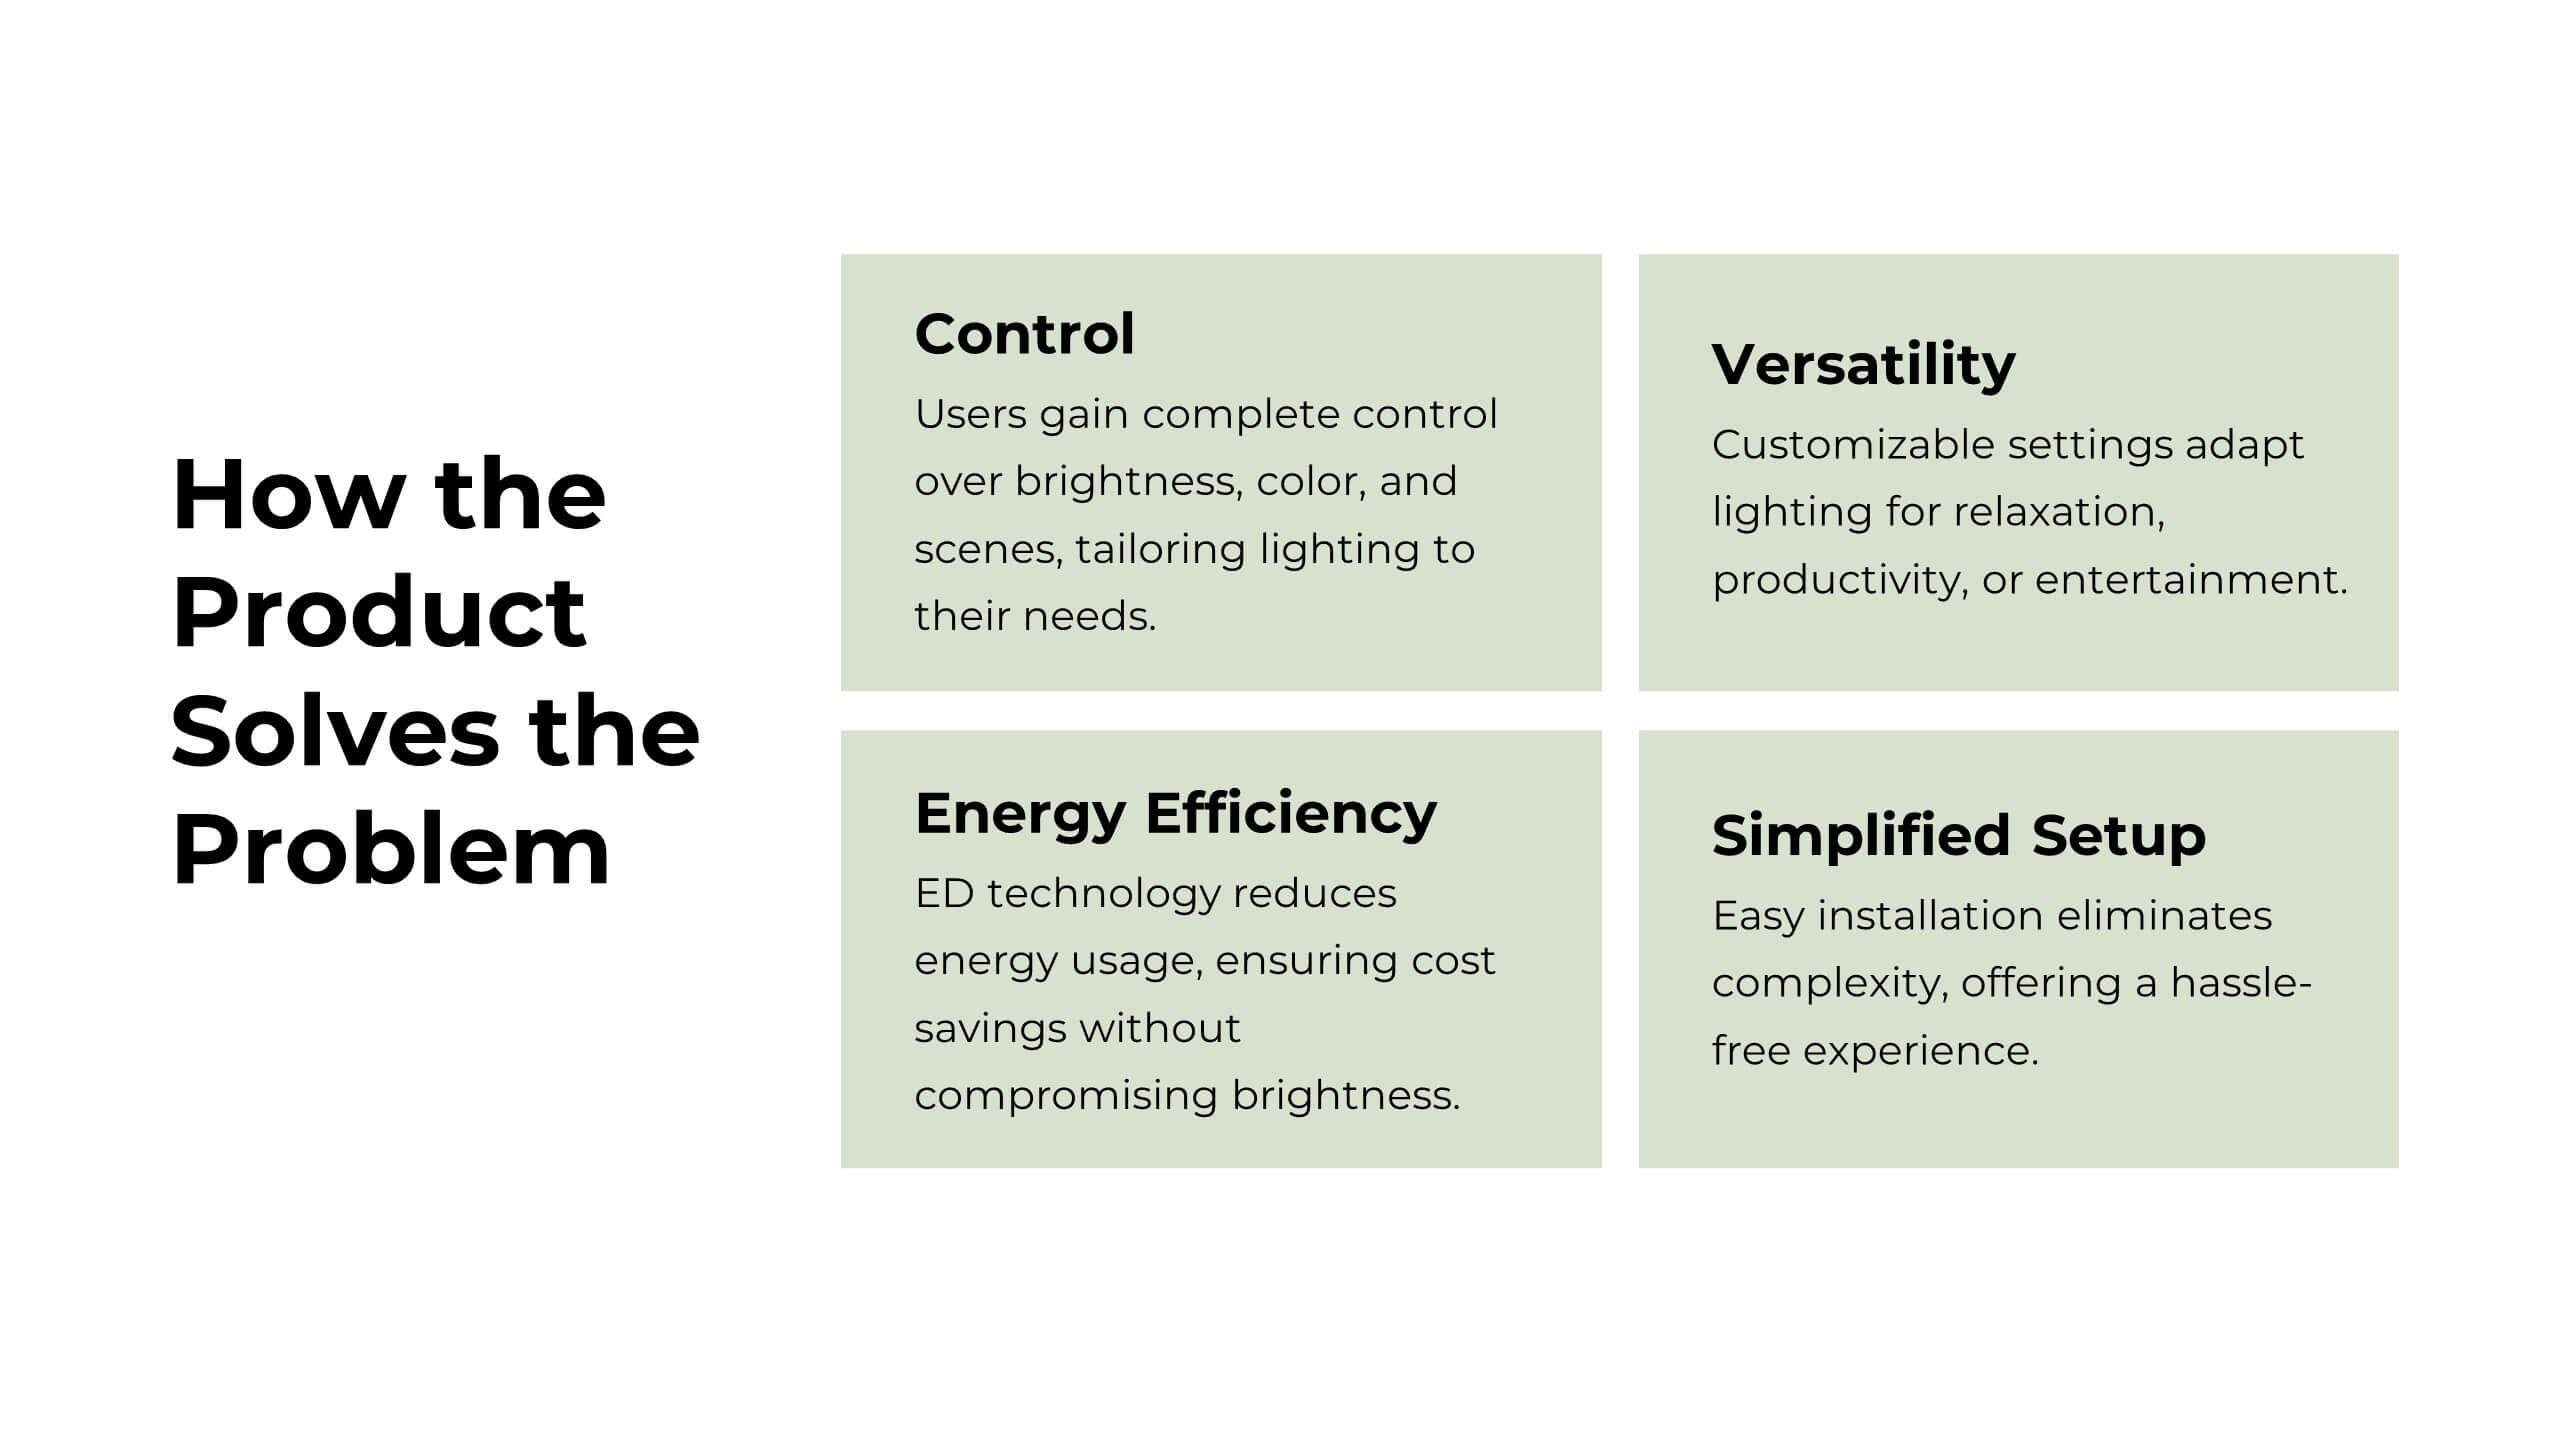
Glint Product Launch Presentation
Develop your product with confidence using this detailed product development plan template! Perfect for outlining features, market analysis, and competitive advantages. Ensure your team's efforts are aligned and maximize the impact of your product launch. Compatible with PowerPoint, Keynote, and Google Slides, it’s your ideal companion for successful product development.


4 slides
Team Collaboration Puzzle Slide Presentation
Showcase team synergy with the Team Collaboration Puzzle Slide Presentation. This engaging design uses interlocking human figures to symbolize unity and contribution, making it perfect for presenting roles, responsibilities, or collaborative workflows. Fully editable in Canva, PowerPoint, or Google Slides—ideal for team introductions, project planning, or partnership overviews.


4 slides
Task and Role Allocation Matrix
Clarify team responsibilities with this modern Task and Role Allocation Matrix. Easily visualize who is Responsible, Accountable, Contributing, and Informed for each task. Ideal for team leaders, HR planners, and project coordinators. Fully customizable in PowerPoint, Keynote, and Google Slides.


5 slides
Agile and Waterfall PM Models Presentation
Compare two popular project methodologies with ease using the Agile and Waterfall PM Models Presentation. This side-by-side layout highlights key differences in structure, flexibility, and delivery approach—perfect for client briefings, team onboarding, or stakeholder reviews. Fully editable in PowerPoint, Google Slides, Keynote, and Canva for seamless customization.


7 slides
Porter's Five Forces Analysis Infographic
Unveil the key elements influencing your industry with Porter's Five Forces Analysis Infographic. Drenched in vibrant shades of yellow, blue, and white, this template offers a lucid visualization of the five crucial forces that determine the competitive intensity in the market. Ideal for business analysts, strategy planners, or management students, it offers a nuanced understanding of market dynamics. Its engaging design captures attention while facilitating comprehensive discussions on potential opportunities or threats. With compatibility across PowerPoint, Keynote, and Google Slides, it promises smooth transitions during presentations.


5 slides
Value Chain Business Model Presentation
Spark fresh insight into how your organization creates value with this clean, arrow-based layout that makes every step feel intuitive and action-ready. This presentation breaks down key activities, support processes, and improvement opportunities in a clear visual flow perfect for strategy discussions. Fully compatible with PowerPoint, Keynote, and Google Slides.